|
시장보고서
상품코드
2123106
기업 거버넌스, 리스크 및 컴플라이언스(EGRC) 시장 : 점유율 분석, 산업 동향 및 통계 데이터, 성장 예측(2026-2031년)Enterprise Governance, Risk And Compliance - Market Share Analysis, Industry Trends & Statistics, Growth Forecasts (2026 - 2031) |
||||||
 Mordor Intelligence
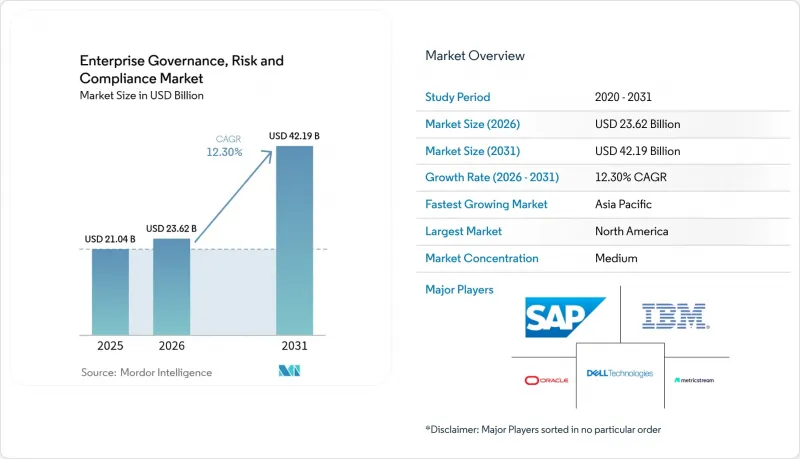
Mordor Intelligence에 의하면, 기업 거버넌스, 리스크 및 컴플라이언스(EGRC) 시장 규모는 2025년 210억 4,000만 달러에서 2026년에는 236억 2,000만 달러로 확대되어 2026년부터 2031년까지 CAGR 12.3%로 성장을 지속하여, 2031년에는 421억 9,000만 달러에 이를 것으로 예측됩니다.

본 보고서는 구성 요소(소프트웨어, 서비스), 배포 방식(On-Premise, 클라우드), 조직 규모(중소기업, 대기업), 최종 사용자 산업(은행, 금융서비스 및 보험(BFSI), 의료, 생명과학, 제조업, IT 및 통신, 에너지 및 유틸리티 등) 및 지역별로 분류되어 있습니다. 시장 예측은 금액(달러)으로 표시되어 있습니다.
전 세계 기업 거버넌스, 리스크 및 컴플라이언스(EGRC) 시장 동향 및 인사이트
엄격한 정부 규제 및 의무화 조치가 플랫폼 통합을 촉진
규제 제정이 활발해짐에 따라 기업 거버넌스, 리스크 및 컴플라이언스(EGRC) 시장은 계속 확대되고 있습니다. 2025년 1월에 시행될 DORA에 따라, EU 금융 기관은 사고 대응, 복원력 테스트 및 제3자 감독을 포괄하는 ICT 위험 프레임워크를 도입해야 합니다. 기업들은 현재 하루 250건 이상의 규제 변경 사항을 모니터링하고 있으며, 그 속도는 수작업으로 처리할 수 있는 능력을 초과하고 있습니다. 머신러닝 모델은 새로운 법규를 분석하고, 관련성을 순위화하며, 몇 분 이내에 담당자에게 업무를 할당함으로써 컴플라이언스 팀이 전략적 리스크 분석에 자원을 집중할 수 있도록 지원합니다. 따라서 여러 관할 구역에 걸친 매핑 기능과 자동 업데이트 엔진을 제공하는 벤더가 기업의 후보 목록 상위에 떠오르고 있습니다. 규정 준수를 이행하지 못할 경우 막대한 벌금이나 평판 하락의 위험이 있는 반면, 조기에 도입한 기업은 운영상의 회복력을 입증함으로써 투자자의 신뢰를 확보하고 있습니다.
사이버 보안 위협 증가가 GRC 기술 통합을 가속화
2024년에는 사이버 사고가 75% 급증함에 따라, CISO(최고 정보 보안 책임자)는 보안 태세 지표를 개별적으로 다루기보다는 핵심 거버넌스 대시보드에 통합해야 할 수밖에 없습니다. 위협 텔레메트리에 정책 점검을 중첩할 수 있는 단일 콘솔을 통해 업무 중복이 줄어들고, 하이브리드 환경 전반에 걸친 취약점 수정 시간이 단축됩니다. AI 지원 GRC 제품군을 도입한 의료 서비스 제공업체는 위험 감지율이 37% 향상되고 오감지가 42% 감소하여, 규정 준수 데이터와 보안 데이터를 통합하는 것의 가치를 입증하고 있습니다. 조직의 70%가 현재의 On-Cloud험 할당 프로세스를 비효율적이라고 평가함에 따라, 중앙 집중화된 클라우드 독립형 통제에 대한 수요가 증가하고 있습니다. 원시 알림이 아닌 실용적인 대시보드를 제공하는 벤더는 사용자의 부담을 줄이고 전문가가 영향력이 큰 위협에 집중할 수 있도록 함으로써 지지를 얻고 있습니다.
초기 통합 비용이 높아 레거시 시스템 현대화의 과제로 대두되고 있습니다.
주요 제품군의 연간 구독료는 5만 달러에서 50만 달러 사이이지만, 도입 비용은 라이선스 비용의 2배에서 6배에 달하는 경우가 많아 노후화된 ERP 기반을 운영하는 기업의 예산을 압박하고 있습니다. SaaS 가격 상승률이 11.3%에 달하는 가운데, 직원 수가 정체되어 있음에도 불구하고 벤더가 25%의 가격 인상을 단행하고 있어 가격에 대한 민감도가 더욱 높아지고 있습니다. 최신 GRC 도구를 각 기업의 독자적인 재무, 인사, 제조 시스템과 통합하려면 대부분의 경우 맞춤형 API나 변경 관리 프로그램이 필요하며, 이로 인해 도입 기간이 길어집니다. 성과 기반 라이선싱 및 로우코드 커넥터는 자본 지출을 운영비로 전환하고, 정량화 가능한 위험 감소 지표를 통해 투자 회수를 입증할 수 있어 인기가 높아지고 있습니다.
부문 분석
솔루션은 2025년 매출의 66.72%를 차지하며, 정책 라이브러리, 감사 추적, 리스크 스코어링, 사고 대응을 하나의 스택으로 통합한 엔드투엔드 제품군에 대한 구매자의 선호도를 여실히 보여주고 있습니다. 이러한 압도적인 점유율은 기업 거버넌스, 리스크 및 컴플라이언스(EGRC) 시장의 모든 기능에 대해, 각 기업이 단일 벤더에 의한 책임 체계와 일관된 사용자 경험을 얼마나 중요하게 여기는지를 반영합니다. 컨설팅, 통합, 관리형 서비스는 절대 금액으로는 적지만, 규제 해석이나 복잡한 시스템 도입에 있어 구매자가 외부 전문가에 의존하게 됨에 따라 2031년까지 12.6%의 성장이 예상됩니다. 리스크 관리 및 감사 관리 모듈은 스프레드시트 기반의 워크플로우를 대체하고, 경영진이 모바일 앱을 통해 추적 가능한 실시간 분석 기능을 제공함으로써 가장 빠르게 보급되고 있습니다. 공급망 혼란으로 인한 손실이 평균 1억 8,400만 달러에 달함에 따라, 기업들은 사업 연속성 계획을 공급업체의 스코어카드와 직접 연계하게 되었기 때문에 사업 연속성 기능에 대한 수요가 급증했습니다.
은행이나 병원에서는 기밀 기록을 로컬에 저장해야 하기 때문에 2025년 매출의 53.40%는 On-Premise 도입이 차지했으나, CIO들이 AI 워크로드를 위해 탄력적인 컴퓨팅을 선호함에 따라,클라우드 구독은 2031년까지 연평균 13.3%의 성장률을 보일 것으로 전망됩니다. 클라우드 플랫폼은 업그레이드를 자동화하고, 도입 주기를 단축하며, 원격 팀의 업무를 지원하기 때문에 중소기업부터 다국적 기업에 이르기까지 폭넓게 매력적으로 다가오고 있습니다. DORA를 통한 제3자 복원력에 대한 규제 당국의 감시가 강화됨에 따라, 기업들은 외부 클라우드 제공업체에 대한 지속적인 모니터링을 요구하고 있습니다. 이 기능은 클라우드 네이티브 GRC 제품군에 설계상 내장되어 있습니다. 중요한 데이터를 On-Premise에 보관하면서 분석을 클라우드로 이전하는 하이브리드 모델을 통해, 리스크 회피 성향이 강한 기업도 데이터 보관 규정을 위반하지 않고 신중하게 클라우드 도입을 시도할 수 있습니다.
프로바이더는 고객이 관리하는 암호화 키를 제공하거나, 각국의 규정 준수 규제를 준수하여 인증을 받은 ‘소버린 클라우드’ 리전을 제공함으로써 우려되는 보안 격차를 줄이고 있습니다. 또한, 인프라스트럭처 애즈 코드(IaC) 템플릿을 활용하여 도입을 효율화하고, 전체 환경 구축을 몇 주가 아닌 몇 시간 내에 완료할 수 있도록 하고 있습니다. AI 알고리즘에는 대규모 훈련 데이터 세트와 확장 가능한 GPU가 필요하기 때문에 예측형 규정 준수 분석에서는 클라우드 도입이 기본 선택지가 되고 있으며, 이를 통해 기업 거버넌스, 리스크 및 컴플라이언스(EGRC) 시장 전망 비전에서 클라우드의 역할이 확고해지고 있습니다.
지역별 분석
북미는 성숙한 규제 환경과 풍부한 기술 예산에 힘입어 2025년에는 전 세계 매출의 34.80%를 차지했습니다. 금융 기관들은 규정 준수에 연간 610억 달러를 지출하고 있으며, 99%가 비용 증가를 예상하고 있습니다. 이에 따라 비용 효율을 높이는 자동화 솔루션에 대한 수요가 증가하고 있습니다. 연방 정부 지침에서는 자발적인 보고와 탄탄한 업무 운영이 높이 평가되므로, 기업들은 GRC 투자를 경쟁 우위로 간주하고 있습니다. ServiceNow와 Visa와 같은 파트너십은 기술 공급업체들이 규제 준수를 확보하면서 분쟁 관리를 강화하는 AI 워크플로를 공동으로 구축하고 있는 실제 사례를 보여줍니다.
아시아태평양은 세계 최고 수준인 연평균 성장률(CAGR) 12.9%를 나타낼 것으로 예측됩니다. 싱가포르, 호주, 인도 정부는 영국 뇌물방지법에 부합하는 기업 책임 관련 규정을 도입하고 있어, 기업들은 최신 규정 준수 아키텍처에 투자할 수밖에 없는 상황입니다. 또한, 아시아태평양의 은행들은 금융 범죄 대응을 위한 규정 준수 비용으로 450억 달러를 부담하고 있으며, 70%의 기업이 2024년에 소프트웨어 지출이 증가할 것으로 예상하고 있습니다. 이에 따라 급속한 디지털화에 대응한 클라우드 네이티브 기술의 도입이 촉진되고 있습니다.
기타 혜택:
- Excel 형식 시장 예측(ME) 시트
- 3개월간의 애널리스트 지원
자주 묻는 질문
목차
제1장 서론
제2장 분석 방법
제3장 주요 요약
제4장 시장 구도
제5장 시장 규모와 성장 예측
제6장 경쟁 구도
제7장 시장 기회와 향후 전망
JHS 26.09.09According to Mordor Intelligence, the enterprise governance risk compliance market size is expected to grow from USD 21.04 billion in 2025 to USD 23.62 billion in 2026 and is forecast to reach USD 42.19 billion by 2031 at 12.3% CAGR over 2026-2031.
This report is Segmented by Component (Software and Services), Deployment Model (On-Premises and Cloud), Organisation Size (Small and Medium Enterprises, Large Enterprises), End-User Industry (BFSI, Healthcare and Life Sciences, Manufacturing, IT and Telecom, Energy and Utilities, and More), and Geography. The Market Forecasts are Provided in Terms of Value (USD).
Global Enterprise Governance, Risk And Compliance Market Trends and Insights
Stringent government regulations and mandates drive platform consolidation
Heightened rulemaking continues to swell the enterprise governance risk compliance market as DORA, effective January 2025, obliges EU financial entities to embed ICT risk frameworks covering incident response, resilience testing, and third-party oversight. Firms now monitor more than 250 regulatory changes each day, a pace that outstrips manual processes. Machine-learning models parse new statutes, rank their relevance, and route tasks to accountable owners within minutes, enabling compliance teams to redeploy effort toward strategic risk analysis. Vendors offering multijurisdictional mapping and automated update engines have therefore moved to the top of enterprise shortlists. Failure to comply risks both material penalties and reputational damage, whereas early movers secure investor confidence by demonstrating operational resilience.
Rising cybersecurity threats accelerate GRC technology integration
Cyber incidents spiked 75% in 2024, pushing CISOs to embed security posture metrics into core governance dashboards instead of handling them in isolation. A single console that overlays policy checks onto threat telemetry cuts duplication and shrinks time to remediate vulnerabilities across hybrid environments. Healthcare providers adopting AI-enabled GRC suites recorded 37% stronger risk detection rates and 42% fewer false positives, illustrating the value of unifying compliance and security data. Because 70% of organizations label current cloud-risk assignment processes ineffective, appetite for centralised, cloud-agnostic controls has intensified. Suppliers that deliver actionable dashboards-rather than raw alerts-win traction by easing user fatigue and freeing specialists to focus on high-impact threats.
High initial integration costs challenge legacy system modernization
Annual subscriptions for leading suites range from USD 50,000 to USD 500,000, while implementation often costs two to six times the license fees, straining budgets for firms running ageing ERP backbones. SaaS inflation running at 11.3% further heightens price sensitivity as vendors impose 25% hikes despite flat headcount. Integrating modern GRC tools with bespoke finance, HR, and manufacturing systems often demands custom APIs and change-management programmes that extend timelines. Outcome-based licensing and low-code connectors are gaining popularity by shifting capital expenditure to operating expense and demonstrating payback through quantifiable risk-reduction metrics.
Other drivers and restraints analyzed in the detailed report include:
- AI-powered predictive compliance analytics transform risk management
- ESG reporting pressure creates new compliance categories
- Organizational GRC-fatigue impedes platform adoption
For complete list of drivers and restraints, kindly check the Table Of Contents.
Segment Analysis
Solutions generated 66.72% of 2025 revenue, underscoring buyer preference for end-to-end suites that blend policy libraries, audit trails, risk scoring, and incident response into one stack. This dominance reflects how enterprises value single-vendor accountability and consistent user experience across all functions of the enterprise governance risk compliance market. Consulting, integration, and managed services, though smaller in absolute value, are set to grow 12.6% through 2031 as buyers turn to external experts for regulatory interpretation and complex system rollouts. Risk Management and Audit Management modules experience the fastest take-up because they replace spreadsheet workflows and provide real-time analytics that executives can track on mobile apps. Demand for Business Continuity features surged after supply-chain shocks averaged USD 184 million in losses, prompting firms to link continuity plans directly to supplier scorecards.
On-premise installations retained 53.40% of 2025 revenue because banks and hospitals must store sensitive records locally, but cloud subscriptions will expand 13.3% annually through 2031 as CIOs favor elastic compute for AI workloads. Cloud platforms automate upgrades, shorten implementation cycles, and empower remote teams, making them attractive to SMEs and multinationals alike. Regulatory scrutiny on third-party resilience through DORA pushes firms to demand continuous oversight of external cloud providers-a capability that cloud-native GRC suites embed by design. Hybrid models, which keep critical data on-site while shifting analytics to the cloud, enable risk-averse firms to test the waters without breaching residency rules.
Providers mitigate perceived security gaps by offering customer-managed encryption keys and sovereign-cloud regions certified for local compliance regimes. They also streamline deployment through infrastructure-as-code templates that stand up full environments in hours rather than weeks. As AI algorithms require large training sets and scalable GPUs, cloud deployments become the default choice for predictive compliance analytics-cementing their role in the future landscape of the enterprise governance risk compliance market.
Complete Report Scope:
- By Component
- Solutions
- Policy and Compliance Management
- Audit Management
- Risk Management
- Incident Management
- Business Continuity and Disaster Recovery
- Services
- Consulting
- Integration and Implementation
- Training and Support
- Solutions
- By Deployment Model
- On-premises
- Cloud
- By Organisation Size
- Small and Medium Enterprises
- Large Enterprises
- By End-user Industry
- BFSI
- Healthcare and Life Sciences
- Manufacturing
- IT and Telecom
- Energy and Utilities
- Retail and Consumer Goods
- Government and Public Sector
- By Geography
- North America
- United States
- Canada
- Mexico
- South America
- Brazil
- Argentina
- Rest of South America
- Europe
- Germany
- United Kingdom
- France
- Russia
- Rest of Europe
- Asia-Pacific
- China
- Japan
- India
- Australia
- South Korea
- Rest of Asia-Pacific
- Middle East
- Saudi Arabia
- United Arab Emirates
- Turkey
- Rest of Middle East
- Africa
- South Africa
- Nigeria
- Rest of Africa
- North America
Geography Analysis
North America generated 34.80% of global revenue in 2025, supported by mature regulatory ecosystems and robust technology budgets. Financial institutions spend USD 61 billion annually on compliance, and 99% expect costs to rise, reinforcing demand for automated solutions that lower expense ratios. Federal guidelines reward self-reporting and resilient operations, so firms treat GRC investment as a competitive edge. Partnerships such as ServiceNow-Visa illustrate how technology vendors co-create AI workflows that enhance dispute management while ensuring regulatory adherence.
Asia-Pacific is projected to log a 12.9% CAGR, the highest globally. Governments in Singapore, Australia, and India introduce corporate liability rules mirroring the UK Bribery Act, compelling companies to invest in modern compliance architecture. APAC banks also confront USD 45 billion in financial-crime compliance costs, with 70% citing higher software spend in 2024, driving cloud-native uptake that aligns with rapid digitalization.
- Dell Technologies (incl. RSA Security)
- IBM Corporation
- SAP SE / GRC Suite
- Oracle Corporation
- MetricStream Inc.
- Wolters Kluwer / Enablon
- SAS Institute Inc.
- Software AG
- NAVEX Global
- Thomson Reuters Corp.
- ServiceNow Inc.
- Riskonnect Inc.
- LogicManager Inc.
- OneTrust LLC
- Galvanize (Diligent)
- Ideagen Plc
- SAI Global
- AxiomSL (Adenza)
- Cura Software
- BWise (SandP Global)
- FutureShield Inc.
- Maclear LLC
- RSA Archer Suite
Additional Benefits:
- The market estimate (ME) sheet in Excel format
- 3 months of analyst support
TABLE OF CONTENTS
1 INTRODUCTION
- 1.1 Study Assumptions and Market Definition
- 1.2 Scope of the Study
2 RESEARCH METHODOLOGY
3 EXECUTIVE SUMMARY
4 MARKET LANDSCAPE
- 4.1 Market Overview
- 4.2 Market Drivers
- 4.2.1 Stringent government regulations and mandates
- 4.2.2 Rising cybersecurity threats with digital transformation
- 4.2.3 Move toward integrated risk-management platforms
- 4.2.4 ESG reporting pressure and non-financial disclosure rules
- 4.2.5 AI-powered predictive compliance analytics adoption
- 4.2.6 Insurance underwriting dependencies on real-time GRC metrics
- 4.3 Market Restraints
- 4.3.1 Lack of skilled GRC professionals
- 4.3.2 High initial integration cost for legacy environments
- 4.3.3 Data-residency and sovereignty complexity in multi-cloud
- 4.3.4 Organisational GRC-fatigue and alert overload
- 4.4 Supply-Chain Analysis
- 4.5 Regulatory Landscape
- 4.6 Technological Outlook
- 4.7 Porter's Five Forces
- 4.7.1 Bargaining Power of Suppliers
- 4.7.2 Bargaining Power of Buyers
- 4.7.3 Threat of New Entrants
- 4.7.4 Threat of Substitutes
- 4.7.5 Intensity of Competitive Rivalry
- 4.8 Assesment of Macroeconomic Factors on the Market
5 MARKET SIZE AND GROWTH FORECASTS (VALUE)
- 5.1 By Component
- 5.1.1 Solutions
- 5.1.1.1 Policy and Compliance Management
- 5.1.1.2 Audit Management
- 5.1.1.3 Risk Management
- 5.1.1.4 Incident Management
- 5.1.1.5 Business Continuity and Disaster Recovery
- 5.1.2 Services
- 5.1.2.1 Consulting
- 5.1.2.2 Integration and Implementation
- 5.1.2.3 Training and Support
- 5.1.1 Solutions
- 5.2 By Deployment Model
- 5.2.1 On-premises
- 5.2.2 Cloud
- 5.3 By Organisation Size
- 5.3.1 Small and Medium Enterprises
- 5.3.2 Large Enterprises
- 5.4 By End-user Industry
- 5.4.1 BFSI
- 5.4.2 Healthcare and Life Sciences
- 5.4.3 Manufacturing
- 5.4.4 IT and Telecom
- 5.4.5 Energy and Utilities
- 5.4.6 Retail and Consumer Goods
- 5.4.7 Government and Public Sector
- 5.5 By Geography
- 5.5.1 North America
- 5.5.1.1 United States
- 5.5.1.2 Canada
- 5.5.1.3 Mexico
- 5.5.2 South America
- 5.5.2.1 Brazil
- 5.5.2.2 Argentina
- 5.5.2.3 Rest of South America
- 5.5.3 Europe
- 5.5.3.1 Germany
- 5.5.3.2 United Kingdom
- 5.5.3.3 France
- 5.5.3.4 Russia
- 5.5.3.5 Rest of Europe
- 5.5.4 Asia-Pacific
- 5.5.4.1 China
- 5.5.4.2 Japan
- 5.5.4.3 India
- 5.5.4.4 Australia
- 5.5.4.5 South Korea
- 5.5.4.6 Rest of Asia-Pacific
- 5.5.5 Middle East
- 5.5.5.1 Saudi Arabia
- 5.5.5.2 United Arab Emirates
- 5.5.5.3 Turkey
- 5.5.5.4 Rest of Middle East
- 5.5.6 Africa
- 5.5.6.1 South Africa
- 5.5.6.2 Nigeria
- 5.5.6.3 Rest of Africa
- 5.5.1 North America
6 COMPETITIVE LANDSCAPE
- 6.1 Market Concentration
- 6.2 Strategic Moves
- 6.3 Market Share Analysis
- 6.4 Company Profiles (includes Global-level Overview, Market-level Overview, Core Segments, Financials as available, Strategic Information, Market Rank/Share, Products and Services, Recent Developments)
- 6.4.1 Dell Technologies (incl. RSA Security)
- 6.4.2 IBM Corporation
- 6.4.3 SAP SE / GRC Suite
- 6.4.4 Oracle Corporation
- 6.4.5 MetricStream Inc.
- 6.4.6 Wolters Kluwer / Enablon
- 6.4.7 SAS Institute Inc.
- 6.4.8 Software AG
- 6.4.9 NAVEX Global
- 6.4.10 Thomson Reuters Corp.
- 6.4.11 ServiceNow Inc.
- 6.4.12 Riskonnect Inc.
- 6.4.13 LogicManager Inc.
- 6.4.14 OneTrust LLC
- 6.4.15 Galvanize (Diligent)
- 6.4.16 Ideagen Plc
- 6.4.17 SAI Global
- 6.4.18 AxiomSL (Adenza)
- 6.4.19 Cura Software
- 6.4.20 BWise (SandP Global)
- 6.4.21 FutureShield Inc.
- 6.4.22 Maclear LLC
- 6.4.23 RSA Archer Suite
7 MARKET OPPORTUNITIES AND FUTURE OUTLOOK
- 7.1 White-space and Unmet-Need Assessment