

|
시장보고서
상품코드
2123355
e스포츠 시장 : 점유율 분석, 업계 동향과 통계, 성장 예측(2026-2031년)Esports - Market Share Analysis, Industry Trends & Statistics, Growth Forecasts (2026 - 2031) |
||||||
 Mordor Intelligence
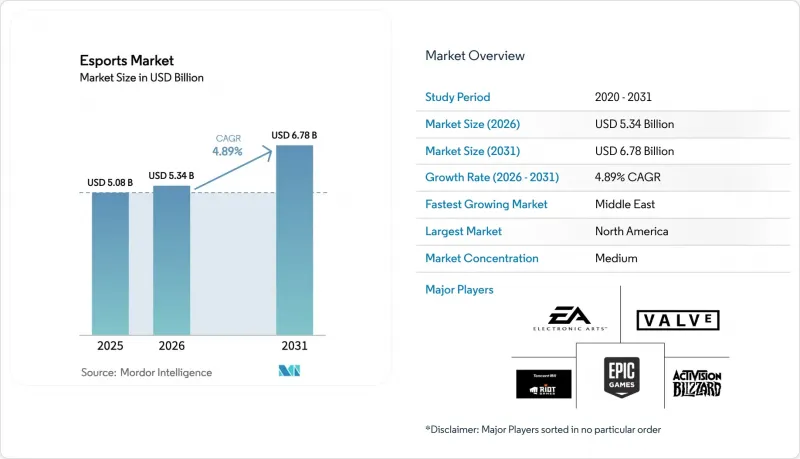
Mordor Intelligence에 의하면, e스포츠 시장 규모는 2025년 50억 8,000만 달러에서 2026년에는 53억 4,000만 달러로 확대되어 2026년부터 2031년까지 CAGR 4.89%로 성장을 지속하여, 2031년까지 67억 8,000만 달러에 이를 것으로 예측됩니다.
본 보고서는 수익 모델(스폰서십, 미디어 권리, 광고, 퍼블리셔 수수료·게임 내 과금, 티켓·굿즈, 베팅·판타지),스트리밍 플랫폼(Twitch, YouTube Gaming, Facebook Gaming, Huya 등), 기기 유형(PC, 모바일/핸드헬드, 콘솔), 게임 장르(MOBA, FPS, 배틀로얄 등), 지역별로 분류되어 있습니다. 시장 예측은 금액(달러)으로 제시되어 있습니다.
세계 e스포츠 시장 동향 및 인사이트
5G 및 광섬유 확산이 아시아 모바일 e스포츠의 수익화를 촉진
2025년 12월까지 한국의 5G 전국 보급률은 모바일 가입자 수의 68%에 달했습니다. 한편, 차이나 모바일은 독립형 5G로 현급 도시의 95%를 커버하고 평균 지연 시간을 20밀리초 미만으로 줄임으로써 스마트폰과 PC 간의 경쟁 조건을 균등화했습니다. 텐센트는 이러한 인프라 개선을 활용하여 2025년에 1,000만 달러를 투자해 ‘Honor of Kings’ 세계 선수권 대회를 개최했습니다. 이 대회는 1억 2,000만 명의 동시 시청자를 모았으며, 연간 24억 5,000만 달러의 수익을 창출했습니다. 가레나(Garena)의 ‘Free Fire’는 200달러 미만의 단말기에서도 1억 5,000만 명의 일일 활성 사용자를 유지하고 있어, 합리적인 가격의 하드웨어를 통해 새로운 잠재 고객층이 개척되었음을 보여줍니다. 인도네시아와 필리핀의 정부 주도 FTTH(Fiber-to-the-Home) 프로그램은 참여자를 더욱 확대하고 있으며, 필리핀 정보통신기술부는 2027년까지 가구 커버리지 50%를 목표로 하고 있습니다. 이러한 연결성 향상은 모바일 스트리밍 시간 증가, 앱 내 결제 전환율 향상, 지역별 상금 총액 확대로 이어지며, 이 모든 요소가 결합되어 e스포츠 시장의 성장 전망을 끌어올리고 있습니다.
블록체인 기반 디지털 자산 소유권이 퍼블리셔의 수익을 끌어올립니다.
대체 불가능 토큰(NFT)을 통해 시청자와 기업은 인증된 토너먼트용 스킨을 거래할 수 있게 되었으며, 퍼블리셔는 재판매 시마다 5%-10%의 로열티를 획득함으로써 일회성 아이템 판매를 지속적인 수익으로 전환하고 있습니다. Immutable은 GameStop, Ubisoft와의 제휴를 통해 서비스 시작 후 6개월 이내에 세컨더리 시장에서 1,800만 달러의 거래액을 창출했습니다. 라이엇 게임즈는 2025년 8월, 블록체인에서 검증된 아이템 소유권에 관한 미국 특허를 취득하여 게임 간 경제 시스템의 기반을 마련했습니다. 유럽증권시장감독청(ESMA)은 현재 특정 토큰을 금융상품으로 취급하고 있지만, 규정 준수 등록에 소요되는 비용은 평생 로열티 수입 증가 전망에 비하면 허용 가능한 범위 내라고 볼 수 있습니다.
유럽 내 디지털 광고 둔화에 따른 스폰서 지출 감소
2024년, 유럽의 디지털 광고 예산은 전년 대비 8% 감소했으며, 인텔(Intel)이나 마스터카드(Mastercard)와 같은 업계를 대표하는 스폰서 기업들은 e스포츠 캠페인을 약 15% 감축할 수밖에 없었습니다. 인텔은 2024년 12월, 10년에 걸친 ‘익스트림 마스터즈(Extreme Masters)’ 타이틀 스폰서 계약을 종료했고, 연간 2,000만 달러의 보증금이 소멸됨에 따라 ESL FACEIT 그룹은 광고 공간을 위험이 수반되는 수익 분배형 계약으로 전환할 수밖에 없게 되었습니다. 암호화폐 거래소 FTX의 파산으로 인해 2억 달러 규모의 스폰서십 공백이 발생했으나, 2025년 시점에서 그 중 40%만 메워진 상태였습니다. GDPR(EU 개인정보보호규정)(일반 데이터 보호 규정)의 집행이 엄격해지면서 타겟팅 정확도가 떨어졌고, 2024년 메타(Meta)가 3억 9,000만 유로의 벌금을 부과받은 것이 그 증거이며, e스포츠 중계의 CPM 프리미엄도 약화되고 있습니다. 각 브랜드는 퍼포먼스 마케팅으로 예산을 전환하고 있으며, e스포츠 사업자들은 표준화가 제한된 상황에서 참여도(engagement)의 투자 대비 효과를 입증해야만 하는 상황에 처해 있습니다.
부문 분석
2025년에는 e스포츠 수익의 39.93%를 스폰서십이 차지했으나, 베팅 및 판타지 플랫폼은 2031년까지 연평균 성장률(CAGR) 5.53%로 확대되고 있으며, 이는 관할 구역 내 합법화와 실제 현금 베팅이 스트리밍 인터페이스에 통합된 것을 반영합니다. DraftKings는 2025년 미국에서 e스포츠 전용 베팅 시장을 출시하여, 리그 오브 레전드 챔피언십 시리즈(League of Legends Championship Series) 및 카운터스트라이크 메이저(Counter-Strike Major) 토너먼트에서 머니라인, 맵 핸디캡, 인플레이 베팅을 제공했으며, 출시 후 6개월 만에 8,500만 달러의 거래액을 창출했습니다. 2025년 매출의 18%를 차지했던 미디어 권리 수입은 YouTube Gaming과 Twitch가 최저 보장액 방식에서 수익 분배형 계약으로 전환함에 따라 축소 압박에 직면해 있습니다. 라이엇 게임즈는 2024년에 LCS 방송 계약을 재협상하여 고정 연회비를 3,000만 달러에서 1,800만 달러로 낮추고, 광고 슬롯의 25%로 조정했습니다. 2025년 시장 가치의 15%를 차지하는 광고 수익은 관리되지 않은 채팅 환경을 이유로 프로그래매틱 거래소가 e스포츠 중계를 브랜드에 안전하지 않은 것으로 분류함에 따라,CPM(1,000회 노출당 비용) 하락에 직면해 있으며, 평균 CPM은 2022년 8달러에서 2025년에는 4.50달러로 하락했습니다.
퍼블리셔 수수료와 게임 내 과금은 2025년 수익의 22%를 차지하고 있으며, 밸브(Valve)의 도타 2 배틀패스는 수익의 25%를 ‘더 인터내셔널(The International)’의 상금 풀에 할당함으로써 2025년에는 1억 8,000만 달러의 수익을 창출하고 있습니다. 이를 통해 팬들의 기여가 직접 대회의 위상을 뒷받침하는 선순환이 만들어지고 있습니다. 2025년 수익의 5%를 차지하는 가장 작은 부문인 티켓 및 굿즈 매출은 팬데믹 이후 회복세를 보이고 있습니다. 상하이에서 개최된 2025년 리그 오브 레전드 월드 챔피언십에서는 하루 평균 경기장 방문객 수가 4만 명에 달했으며, 500달러짜리 프리미엄 좌석 패키지는 90분 만에 매진되었습니다. 베팅 및 판타지 게임의 급증은 규제 체계가 성숙한 관할 구역에 집중되어 있습니다. 2022년 4월 단일 이벤트에 대한 스포츠 베팅을 합법화한 온타리오주의 iGaming 시장에서는 2025년 e스포츠 베팅 거래액이 5,200만 캐나다 달러(3,800만 달러)를 기록하며, 스포츠 베팅 총액의 2.1%를 차지했습니다.
2025년, Twitch는 스트리밍 플랫폼 수익의 47.07%를 차지했지만, Meta가 e스포츠 생중계를 핵심 소셜 그래프에 통합하고 Instagram Reels를 활용하여 하이라이트를 전달함에 따라 Facebook Gaming은 2031년까지 연평균 성장률(CAGR) 5.21%로 급성장하고 있습니다. 아마존 산하의 트위치는 2025년 1월 직원 500명(전체 직원의 35%)를 해고했으며, 2025년 2월에는 현지 인터넷 서비스 제공업체가 부과하는 터무니없는 네트워크 전송 비용을 이유로 한국 시장에서 철수하여, YouTube Gaming과 아프리카의 스트리밍 플랫폼 Bigo Live에 시장 점유율을 양보하게 되었습니다. YouTube Gaming은 Twitch의 구독 수익 분배율 50%에 비해 크리에이터에게 슈퍼챗 수익의 70%를 제공함으로써 2025년 플랫폼 수익의 28%를 확보했으며, Valkyrae나 Ludwig와 같은 유명 스트리머들을 다년간의 독점 계약으로 영입했습니다. Facebook Gaming은 2022년 10월 독립형 모바일 앱을 종료한 대신, 토너먼트 중계를 Facebook 뉴스피드에 직접 삽입하고 친구 그룹을 위한 지연 없는 공동 중계를 제공함으로써 2025년 시청 시간을 전년 대비 18% 늘렸습니다.
2025년 전 세계 총 수익의 12%를 차지한 중국의 플랫폼 Huya와 DouYu는 2025년 3월 중국 국가라디오텔레비전총국이 컨텐츠 심사 요건을 강화하고, 스트리머에게 실명 등록을 의무화하며,18세 미만 사용자의 경우 오후 10시부터 오전 8시까지 방송을 금지함에 따라 규제상의 압박에 직면했습니다. Huya와 DouYu는 2025년 6월, 인프라 비용 통합 및 퍼블리셔와의 통합 라이선스 계약 협상을 목적으로 합병 협의를 진행 중이라고 발표했으나, 중국 국가시장감독관리총국은 현재까지 이 거래를 승인하지 않았습니다. Stake.com이 지원하는 Kick과 Tencent 산하의 Trovo를 포함한 기타 플랫폼들은 서비스가 충분히 제공되지 않는 지역을 타겟으로 삼아 2025년 매출의 8%를 차지했습니다. Kick은 2025년 브라질 Free Fire Pro League의 독점 중계권을 확보했으며, 그랜드 파이널에서는 동시 시청자 수 800만 명을 기록했습니다.
지역별 분석
2025년, 북미는 프랜차이즈 리그와 e스포츠 특유의 스폰서십을 기반으로 e스포츠 시장 가치의 42.49%를 차지했습니다. 한편, 사우디아라비아 공공투자기금(PIF)이 Savvy Games Group을 통해 380억 달러를 투자하여 토너먼트 주최사, 팀, 퍼블리셔의 지분을 확보함에 따라, 중동은 2031년까지 연평균 성장률(CAGR) 5.94%로 확대되고 있습니다. Savvy Games Group은 2024년 1월, ESL FACEIT 그룹을 15억 달러에 인수하여 Intel Extreme Masters, ESL One, BLAST Premier 각 서킷의 운영권을 획득했습니다. 이 서킷들에서는 2025년에 총 85개의 Tier 1 토너먼트가 개최되었습니다. 2024년 리야드에서 개최된 e스포츠 월드컵에서는 21개 타이틀에 총 6,000만 달러가 배분되었으며, 이는 사상 최대 규모의 멀티 게임 상금 총액이 되었습니다. 또한, 인권 단체들이 각 팀에 해당 행사 보이콧을 촉구했음에도 불구하고, 1만 5,000명의 해외 참가자를 모았습니다. 2025년 수익의 28%를 차지하는 유럽은스폰서십 축소와 규제 분열이라는 역풍에 직면해 있지만, 독일 연방 디지털·교통부는 민간 부문의 철수에 대응하기 위해 2025년에 e스포츠 인프라에 5,000만 유로(5,400만 달러)를 배정했습니다.
아시아태평양은 2025년 시장 가치의 22%를 차지하고 있으며,중국 국가체육총국은 2024년에 e스포츠를 공식 스포츠로 인정했으며, 상하이에서는 2025년 ‘리그 오브 레전드’ 월드 챔피언십이 개최되어 12억 위안(1억 6,800만 달러)의 지역 경제 효과를 창출했습니다. 한국 문화체육관광부는 2025년 한국 e스포츠 협회에 LCK 운영 및 청소년 육성 프로그램 개발을 위해 150억 원(1,100만 달러)을 지원했습니다. 이를 통해 한국은 1인당 e스포츠 지출액 부문에서 1위 자리를 유지하고 있습니다. 2025년 수익의 5%를 차지하는 남미에서는 브라질의 ‘Free Fire Pro League’가 2025년에 1,200만 명의 동시 시청자를 모았으나, 가처분 소득이 낮고 신용카드 보급률도 제한적이어서,시청자 1인당 수익화는 북미 기준보다 70% 낮았습니다. 2025년 시장 가치의 3%를 차지하는 아프리카는 ‘모바일 퍼스트’ 지역으로 부상하고 있으며, 남아프리카공화국의 ‘Mettlestate Esports Championship Series’는 2025년에 상금으로 500만 랜드(27만 달러)를 배분하고, MTN Group으로부터 스폰서십을 확보했습니다.
기타 혜택:
- 엑셀 형식 시장 예측(ME) 시트
- 3개월간의 애널리스트 지원
자주 묻는 질문
목차
제1장 서론
제2장 조사 방법
제3장 주요 요약
제4장 시장 구도
제5장 시장 규모와 성장 예측
제6장 경쟁 구도
제7장 시장 기회와 향후 전망
JHS 26.09.09According to Mordor Intelligence, the esports market size is expected to grow from USD 5.08 billion in 2025 to USD 5.34 billion in 2026 and is forecast to reach USD 6.78 billion by 2031 at 4.89% CAGR over 2026-2031.
This report is Segmented by Revenue Model (Sponsorship, Media Rights, Advertising, Publisher Fees and In-Game Purchases, Tickets and Merchandise, Betting and Fantasy), Streaming Platform (Twitch, Youtube Gaming, Facebook Gaming, Huya, and More), Device Type (PC, Mobile/Handheld, Console), Game Genre (MOBA, FPS, Battle-Royale, and More), and Geography. Market Forecasts are Provided in Terms of Value (USD).
Global Esports Market Trends and Insights
5G & Fiber Roll-outs Enabling Mobile Esports Monetization in Asia
Nationwide 5G penetration reached 68% of South Korean mobile subscriptions by December 2025, while China Mobile covered 95% of prefecture-level cities with standalone 5G, lowering average latency below 20 milliseconds and leveling competitive conditions between smartphone and PC contestants. Tencent leveraged these upgrades by funding a USD 10 million Honor of Kings World Championship in 2025 that attracted 120 million concurrent viewers and generated USD 2.45 billion in annual revenue. Garena's Free Fire retained 150 million daily active users on devices priced below USD 200, demonstrating the addressable audience unlocked by affordable hardware. Government-backed fiber-to-home programs in Indonesia and the Philippines are widening participation further, with the Philippine Department of Information and Communications Technology targeting 50% household coverage by 2027. These connectivity gains amplify mobile streaming hours, fuel in-app purchase conversion, and expand regional prize pools, collectively lifting the esports market growth outlook.
Blockchain-Based Digital Asset Ownership Boosting Publisher Revenues
Non-fungible tokens allow viewers and players to trade verified tournament skins, and publishers capture 5%-10% royalties on each resale, transforming one-time item sales into recurring revenue. Immutable's partnership with GameStop and Ubisoft drove USD 18 million in secondary-market volume within six months of launch. Riot Games secured a U.S. patent in August 2025 covering blockchain-verified item ownership, laying groundwork for cross-game economies. Although the European Securities and Markets Authority now treats certain tokens as financial instruments, compliance registration costs appear manageable relative to lifetime royalty upside.
Sponsorship Spend Compression amid Digital-Ad Slow-down in Europe
European digital-advertising budgets fell 8% year-over-year in 2024, driving endemic sponsors such as Intel and Mastercard to trim esports campaigns by roughly 15%. Intel ended its decade-long Extreme Masters title sponsorship in December 2024, eliminating an annual USD 20 million guarantee and forcing ESL FACEIT Group to convert inventory into at-risk revenue-share deals. The collapse of cryptocurrency exchange FTX left a USD 200 million sponsorship gap that was only 40% filled by 2025. Stricter GDPR enforcement cut precision targeting, evidenced by Meta's EUR 390 million fine in 2024, weakening CPM premiums for esports streams. Brands are reallocating to performance marketing, leaving properties to prove return on engagement with limited standardization.
Other drivers and restraints analyzed in the detailed report include:
- Franchise League Models Attracting Traditional Sports Investors
- Government Recognition and Funding of Esports in Europe and China
- Escalating Player Salary Inflation Outpacing Revenue Growth
For complete list of drivers and restraints, kindly check the Table Of Contents.
Segment Analysis
Sponsorship commanded 39.93% of esports revenue in 2025, yet betting and fantasy platforms are expanding at 5.53% CAGR through 2031, reflecting jurisdictional legalization and the integration of real-money wagering into streaming interfaces. DraftKings launched esports-specific betting markets in 12 US states during 2025, offering moneyline, map-handicap, and in-play wagers on League of Legends Championship Series and Counter-Strike Major tournaments, generating USD 85 million in handle within the first six months. Media rights, which accounted for 18% of 2025 revenue, face compression as YouTube Gaming and Twitch shift from guaranteed minimum payments to revenue-share arrangements; Riot Games renegotiated its LCS broadcast deal in 2024, reducing the fixed annual fee from USD 30 million to USD 18 million plus 25% of advertising inventory. Advertising revenue, representing 15% of 2025 market value, suffers from declining cost-per-mille rates as programmatic exchanges classify esports streams as "brand-unsafe" due to unmoderated chat environments, with average CPMs falling from USD 8 in 2022 to USD 4.50 in 2025.
Publisher fees and in-game purchases contributed 22% of 2025 revenue, with Valve's Dota 2 Battle Pass generating USD 180 million in 2025 by allocating 25% of proceeds to The International prize pool, creating a virtuous cycle where fan contributions directly fund competitive prestige. Tickets and merchandise, the smallest segment at 5% of 2025 revenue, are rebounding post-pandemic as in-person attendance at the 2025 League of Legends World Championship in Shanghai reached 40,000 per day, with premium seating packages priced at USD 500 selling out within 90 minutes. The betting and fantasy surge is concentrated in jurisdictions with mature regulatory frameworks; Ontario's iGaming market, which legalized single-event sports wagering in April 2022, recorded CAD 52 million (USD 38 million) in esports betting handle during 2025, representing 2.1% of total sports wagering.
Twitch retained 47.07% of streaming-platform revenue in 2025, but Facebook Gaming is accelerating at 5.21% CAGR through 2031 as Meta integrates live esports into its core social graph and leverages Instagram Reels for highlight distribution. Amazon-owned Twitch laid off 500 employees in January 2025, representing 35% of its workforce, and exited the South Korean market in February 2025 due to prohibitive network-transit costs imposed by local internet service providers, ceding ground to YouTube Gaming and African streaming platform Bigo Live. YouTube Gaming captured 28% of 2025 platform revenue by offering creators 70% of Super Chat proceeds compared to Twitch's 50% subscription split, attracting high-profile streamers including Valkyrae and Ludwig to exclusive multi-year contracts. Facebook Gaming, despite shuttering its standalone mobile app in October 2022, grew watch-time 18% year-over-year in 2025 by embedding tournament streams directly into Facebook News Feed and offering zero-latency co-streaming for friend groups.
Chinese platforms Huya and DouYu, which collectively held 12% of 2025 global revenue, faced regulatory pressure as China's National Radio and Television Administration imposed stricter content-moderation requirements in March 2025, mandating real-name registration for streamers and prohibiting broadcasts between 10 PM and 8 AM for users under 18. Huya and DouYu announced merger discussions in June 2025 to consolidate infrastructure costs and negotiate unified licensing agreements with publishers, though China's State Administration for Market Regulation has not yet approved the transaction. The remaining platforms, including Kick (backed by Stake.com) and Trovo (owned by Tencent), captured 8% of 2025 revenue by targeting underserved geographies; Kick secured exclusive rights to broadcast Brazil's Free Fire Pro League in 2025, reaching 8 million concurrent viewers during the grand finals.
Complete Report Scope:
- By Revenue Model
- Sponsorship
- Media Rights
- Advertising
- Publisher Fees and In-Game Purchases
- Tickets and Merchandise
- Betting & Fantasy (New)
- By Streaming Platform
- Twitch
- YouTube Gaming
- Facebook Gaming
- Huya
- DouYu
- Rest of Streaming Platforms
- By Device Type
- PC
- Mobile / Handheld
- Console
- By Game Genre
- MOBA
- First-Person Shooter (FPS)
- Battle-Royale
- Sports and Racing
- Fighting
- Strategy and Others Game Genre
- By Geography
- North America
- United States
- Canada
- Mexico
- South America
- Brazil
- Argentina
- Rest of South America
- Europe
- Germany
- United Kingdom
- France
- Italy
- Spain
- Rest of Europe
- Asia Pacific
- China
- Japan
- South Korea
- India
- Rest of Asia Pacific
- Middle East and Africa
- Middle East
- United Arab Emirates
- Saudi Arabia
- Turkey
- Rest of Middle East
- Africa
- South Africa
- Egypt
- Rest of Africa
- Middle East
- North America
Geography Analysis
North America held 42.49% of esports market value in 2025, anchored by franchised leagues and endemic sponsorships, yet the Middle East is expanding at 5.94% CAGR through 2031 as Saudi Arabia's Public Investment Fund channels USD 38 billion through Savvy Games Group to acquire tournament organizers, teams, and publishing stakes. Savvy Games Group acquired ESL FACEIT Group for USD 1.5 billion in January 2024, gaining control of the Intel Extreme Masters, ESL One, and BLAST Premier circuits that collectively hosted 85 tier-one tournaments in 2025. The 2024 Esports World Cup in Riyadh distributed USD 60 million across 21 titles, the largest multi-game prize pool in history, and attracted 15,000 international attendees despite human-rights organizations urging teams to boycott the event. Europe, representing 28% of 2025 revenue, faces headwinds from sponsorship compression and regulatory fragmentation, with Germany's Federal Ministry for Digital and Transport allocating EUR 50 million (USD 54 million) to esports infrastructure in 2025 to counteract private-sector retrenchment.
Asia-Pacific contributed 22% of 2025 market value, with China's General Administration of Sport recognizing esports as an official sport in 2024 and Shanghai hosting the 2025 League of Legends World Championship, which generated CNY 1.2 billion (USD 168 million) in local economic impact. South Korea's Ministry of Culture, Sports and Tourism funded the Korea Esports Association with KRW 15 billion (USD 11 million) in 2025 to operate the LCK and develop youth training programs, maintaining the nation's status as a per-capita esports leader. South America, accounting for 5% of 2025 revenue, saw Brazil's Free Fire Pro League attract 12 million concurrent viewers in 2025, yet monetization per viewer remained 70% below North American benchmarks due to lower disposable incomes and limited credit-card penetration. Africa, representing 3% of 2025 market value, is emerging as a mobile-first region, with South Africa's Mettlestate Esports Championship Series distributing ZAR 5 million (USD 270,000) in prizes during 2025 and securing sponsorship from MTN Group.
- Tencent Holdings Ltd (Riot Games)
- Activision Blizzard Inc
- Electronic Arts Inc
- Epic Games Inc
- Valve Corporation
- Modern Times Group (ESL FACEIT Group)
- Gfinity PLC
- Capcom Co Ltd
- Ubisoft Entertainment SA
- Take-Two Interactive Software Inc
- Krafton Inc
- Garena Online (Sea Ltd)
- Nintendo Co Ltd
- Bandai Namco Holdings Inc
- NetEase Inc
- Sony Interactive Entertainment LLC
- Cloud9 Esports Inc
- Team Liquid Enterprises BV
- 100 Thieves LLC
- Fnatic Ltd
- OG Esports A/S
Additional Benefits:
- The market estimate (ME) sheet in Excel format
- 3 months of analyst support
TABLE OF CONTENTS
1 INTRODUCTION
- 1.1 Study Assumptions and Market Definition
- 1.2 Scope of the Study
2 RESEARCH METHODOLOGY
3 EXECUTIVE SUMMARY
4 MARKET LANDSCAPE
- 4.1 Market Overview
- 4.2 Market Drivers
- 4.2.1 5G and Fiber Roll-outs Enabling Mobile Esports Monetization in Asia
- 4.2.2 Blockchain-based Digital Asset Ownership Boosting Publisher Revenues
- 4.2.3 Franchise League Models Attracting Traditional Sports Investors
- 4.2.4 Government Recognition and Funding of Esports in Europe and China
- 4.2.5 AI-powered Personalised Training Tools Enhancing Player Engagement
- 4.2.6 Saudi-Led Mega Prize Pools Globalising Tournament Calendars
- 4.3 Market Restraints
- 4.3.1 Sponsorship Spend Compression amid Digital-Ad Slow-down in Europe
- 4.3.2 Fragmented IP Ownership Restricting Standardised League Structures
- 4.3.3 Escalating Player Salary Inflation Outpacing Revenue Growth
- 4.3.4 Regulatory Crackdowns on Loot Boxes Limiting In-Game Monetisation
- 4.4 Impact of Macroeconomic Factors on the Market
- 4.5 Industry Value Chain Analysis
- 4.6 Regulatory Outlook
- 4.7 Technological Outlook
- 4.8 Porter's Five Forces Analysis
- 4.8.1 Threat of New Entrants
- 4.8.2 Bargaining Power of Buyers
- 4.8.3 Bargaining Power of Suppliers
- 4.8.4 Threat of Substitutes
- 4.8.5 Intensity of Competitive Rivalry
5 MARKET SIZE & GROWTH FORECASTS (VALUE)
- 5.1 By Revenue Model
- 5.1.1 Sponsorship
- 5.1.2 Media Rights
- 5.1.3 Advertising
- 5.1.4 Publisher Fees and In-Game Purchases
- 5.1.5 Tickets and Merchandise
- 5.1.6 Betting & Fantasy (New)
- 5.2 By Streaming Platform
- 5.2.1 Twitch
- 5.2.2 YouTube Gaming
- 5.2.3 Facebook Gaming
- 5.2.4 Huya
- 5.2.5 DouYu
- 5.2.6 Rest of Streaming Platforms
- 5.3 By Device Type
- 5.3.1 PC
- 5.3.2 Mobile / Handheld
- 5.3.3 Console
- 5.4 By Game Genre
- 5.4.1 MOBA
- 5.4.2 First-Person Shooter (FPS)
- 5.4.3 Battle-Royale
- 5.4.4 Sports and Racing
- 5.4.5 Fighting
- 5.4.6 Strategy and Others Game Genre
- 5.5 By Geography
- 5.5.1 North America
- 5.5.1.1 United States
- 5.5.1.2 Canada
- 5.5.1.3 Mexico
- 5.5.2 South America
- 5.5.2.1 Brazil
- 5.5.2.2 Argentina
- 5.5.2.3 Rest of South America
- 5.5.3 Europe
- 5.5.3.1 Germany
- 5.5.3.2 United Kingdom
- 5.5.3.3 France
- 5.5.3.4 Italy
- 5.5.3.5 Spain
- 5.5.3.6 Rest of Europe
- 5.5.4 Asia Pacific
- 5.5.4.1 China
- 5.5.4.2 Japan
- 5.5.4.3 South Korea
- 5.5.4.4 India
- 5.5.4.5 Rest of Asia Pacific
- 5.5.5 Middle East and Africa
- 5.5.5.1 Middle East
- 5.5.5.1.1 United Arab Emirates
- 5.5.5.1.2 Saudi Arabia
- 5.5.5.1.3 Turkey
- 5.5.5.1.4 Rest of Middle East
- 5.5.5.2 Africa
- 5.5.5.2.1 South Africa
- 5.5.5.2.2 Egypt
- 5.5.5.2.3 Rest of Africa
- 5.5.5.1 Middle East
- 5.5.1 North America
6 COMPETITIVE LANDSCAPE
- 6.1 Market Concentration
- 6.2 Strategic Moves
- 6.3 Market Share Analysis
- 6.4 Company Profiles (includes Global Level Overview, Market Level Overview, Core Segments, Financials as available, Strategic Information, Market Rank/Share for key companies, Products & Services, and Recent Developments)
- 6.4.1 Tencent Holdings Ltd (Riot Games)
- 6.4.2 Activision Blizzard Inc
- 6.4.3 Electronic Arts Inc
- 6.4.4 Epic Games Inc
- 6.4.5 Valve Corporation
- 6.4.6 Modern Times Group (ESL FACEIT Group)
- 6.4.7 Gfinity PLC
- 6.4.8 Capcom Co Ltd
- 6.4.9 Ubisoft Entertainment SA
- 6.4.10 Take-Two Interactive Software Inc
- 6.4.11 Krafton Inc
- 6.4.12 Garena Online (Sea Ltd)
- 6.4.13 Nintendo Co Ltd
- 6.4.14 Bandai Namco Holdings Inc
- 6.4.15 NetEase Inc
- 6.4.16 Sony Interactive Entertainment LLC
- 6.4.17 Cloud9 Esports Inc
- 6.4.18 Team Liquid Enterprises BV
- 6.4.19 100 Thieves LLC
- 6.4.20 Fnatic Ltd
- 6.4.21 OG Esports A/S
7 MARKET OPPORTUNITIES & FUTURE OUTLOOK
- 7.1 White-Space and Unmet-Need Assessment


