|
시장보고서
상품코드
2123394
데이터센터 상호연결 시장 : 점유율 분석, 업계 동향과 통계, 성장 예측(2026-2032년)Data Center Interconnect - Market Share Analysis, Industry Trends & Statistics, Growth Forecasts (2026 - 2032) |
||||||
 Mordor Intelligence
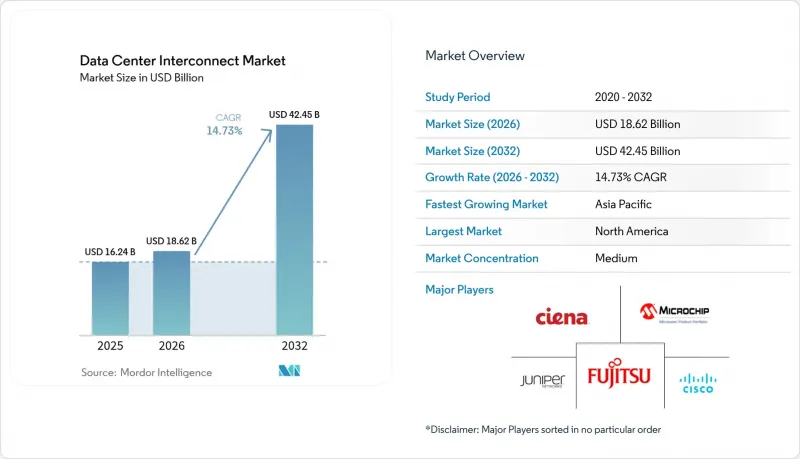
Mordor Intelligence에 의하면, 데이터센터 상호연결 시장 규모는 2025년에 162억 4,000만 달러로 평가되었고 2026년 186억 2,000만 달러에서 성장하여 2032년까지 424억 5,000만 달러에 이를 것으로 추정되고 있습니다.
예측 기간(2026-2032년) 동안 연평균 성장률(CAGR)은 14.73%를 나타낼 것으로 전망됩니다.
본 보고서는 구성 요소(하드웨어 등), 연결 유형(단거리 등), 용도(재해 복구 등), 최종 사용자 산업(통신 서비스 제공업체 등), 지역(북미 등)별로 분류되어 있습니다. 시장 예측은 금액(달러) 기준으로 제시되어 있습니다.
세계 데이터센터 상호연결 시장 동향 및 인사이트
엣지 및 하이퍼스케일 데이터센터 거점 확대
하이퍼스케일 사업자들은 컴퓨팅 리소스를 사용자당에 배치하는 분산형 인프라에 1,800억 달러를 할당하고 있으며, 이로 인해 상호연결 설계는 허브 앤 스포크(hub-and-spoke)형 레이아웃이 아닌 고밀도 메쉬 토폴로지를 지원해야 할 필요성이 대두되고 있습니다. 아마존의 1,000억 달러 확장 계획과 메타의 650억 달러 프로그램은 이러한 변화를 상징합니다. 연평균 성장률(CAGR) 37.9%를 나타낼 것으로 예측되는 엣지 및 마이크로 시설에는 전력 효율이 뛰어난 단거리 광통신 장비와 트래픽을 실시간으로 재분배할 수 있는 프로그래밍 가능한 라우팅이 요구됩니다. 캐리어 호텔은 현재 클라우드, 컨텐츠, 네트워크 사업자가 집결하는 엣지 노드로서의 역할도 수행하고 있으며, 멀티테넌트형 메트로 내 링크에 대한 새로운 수요를 창출하고 있습니다.
400 Gbps를 초과하는 링크가 필요한 AI/HPC 트래픽의 급증
AI 모델 훈련에서는 기존의 100 Gbps 네트워크를 포화시키는 ‘올-투-올(all-to-all)’형 트래픽 패턴이 발생합니다. 2024년에는 400G/800G용 광 모듈 출하 대수가 2,000만 대를 넘어, 급속한 전환이 진행되고 있음이 부각되었습니다. NVIDIA의 800G 포토닉 스위치 로드맵과 IEEE의 800G 이더넷 규격은 1.6 Tbps 레인을 목표로 하는 코히런트 광 기술로의 생태계 전환을 여실히 보여주고 있습니다. 포토닉 스위칭 패브릭은 홉 수와 지연을 줄이고, 전기식 스파인-리프 트리에서 볼 수 있는 오버구독으로 인한 성능 저하를 초래하지 않으면서 AI 클러스터의 확장을 가능하게 합니다.
코히런트 광 기술과 ROADM의 높은 초기 도입 비용
고급 코히런트 엔진과 재구성 가능한 광 애드-드롭 멀티플렉서(ROADM)는 기존 장비에 비해 최대 300%나 비싼 가격으로 책정되어 있어, 중견 통신사의 설비 투자 예산을 압박하고 있습니다. ROADM 시장은 2026년까지 12억 달러에 달할 것으로 예측되며, 이는 막대한 투자 수요를 반영하고 있습니다. 비용에 민감한 지역의 통신 사업자들은 업그레이드를 미루고 있어, 전 세계 도입 현황에서 양극화 경향이 강해지고 있습니다.
부문 분석
2025년 매출 중 하드웨어가 47.35%를 차지했습니다. 이는 사업자들이 데이터센터 상호연결 시장을 뒷받침하는 고밀도 DWDM 셸프와 코히런트 트랜시버를 조달했기 때문입니다. 소프트웨어 분야는 컨트롤러를 통한 대역폭 풀링, 지연 시간 제어, 장애 복구 자동화가 진행됨에 따라 연평균 성장률(CAGR) 16.12%를 기록할 전망입니다. 코패키지드 옵틱스를 추구하는 벤더들은 실리콘 스위칭과 내장형 레이저를 융합하여 비트당 전력 소비를 줄이고 설치 면적을 축소하고 있습니다. 설계, 통합, 라이프사이클 지원에 대한 수요를 반영하여 서비스 매출도 이에 따라 증가하고 있습니다.
데이터센터 상호연결 시장의 하드웨어 규모는 AI 클러스터의 확산에 따라 확대될 것으로 예상되지만, 프로그래밍 가능한 오케스트레이션은 여전히 전략적인 차별화 요소로 남아 있습니다. 통신 사업자들은 오픈 API를 활용하여 멀티 벤더 광 모듈을 단일 인텐트 기반 패브릭으로 통합함으로써 프로비저닝 주기를 몇 주에서 몇 시간으로 단축하고 있습니다.
단거리 링크(80km 미만)는 메트로 캠퍼스, 클라우드 온램프, 캐리어 호텔에서 고밀도의 동서 방향 대역폭이 요구됨에 따라 2025년 매출의 60.25%를 차지했습니다. 하이퍼스케일러가 지역을 초월한 내결함성을 추구하는 가운데, 장거리 시스템은 연평균 성장률(CAGR) 14.88%로 성장을 가속화할 전망입니다. 장거리 데이터센터 상호연결 시장 규모는 기존 광섬유에 더 많은 용량을 집적하는 1.6 Tbps 코히런트 플랫폼의 혜택을 받을 것입니다.
‘메두사(Medusa)’ 해저 케이블과 같은 프로젝트는 유럽과 아프리카를 연결하는 새로운 경로를 제공하며 새로운 수요원을 창출하고 있습니다. 한편, 엣지(Edge)의 성장은 단거리 트래픽 양을 뒷받침하며, 메트로 영역과 백본 영역 간의 균형 잡힌 설비 투자 배분을 보장하고 있습니다.
지역별 분석
북미는 하이퍼스케일 캠퍼스의 집중, 선진적인 광섬유 회랑, 그리고 활발한 오픈소스 생태계 덕분에 데이터센터 상호연결 시장을 주도하고 있습니다. DE-CIX 댈러스의 400 GE로의 업그레이드는 메트로 회선의 고밀도화를 상징합니다. 미국에서는 견실한 벤처 자금과 유리한 세제 혜택에 힘입어, 포토닉 스위치 도입을 선도하는 프로젝트가 진행되고 있습니다.
아시아태평양은 가장 빠르게 성장하는 지역으로, 중국, 일본, 인도 및 아세안 시장의 클라우드 보급을 배경으로 2033년까지 데이터센터용량이 3배로 증가할 것으로 예측됩니다. 각국의 AI에 대한 의지와 5G 구축으로 인해, 단거리 메트로 지역 구축과 국경을 넘는 장거리 회선 구축이 모두 가속화되고 있습니다.
유럽에서는 지속가능성에 관한 규제와 디지털 주권 목표 간의 균형이 유지되고 있습니다. 독일만 해도 2029년까지 데이터센터의 평가액이 253억 달러에 달할 것으로 예측되며, EU의 탄소 중립 공약에 부합하기 위해 고효율 광통신 장비가 도입되고 있습니다. 2Africa와 같은 해저 케이블은 내결함성을 향상시켜 중동 및 아프리카의 허브와의 컨텐츠 교환을 지원하고 있습니다.
라틴아메리카는 투자의 새로운 무대로 부상하고 있으며, 브라질이 지역 전체 투자액의 40%를 차지하고 있습니다. 또한, 브룩필드(Brookfield)사가 Ascenty의 파트너를 모색하고 있다는 사실은 하이퍼스케일 성장에 대한 확신을 뒷받침합니다. 멕시코의 케레타로 클러스터는 미국 시장으로의 지연 시간을 20밀리초 미만으로 요구하는 주요 클라우드 기업들을 유치하고 있습니다.
중동 및 아프리카에서는 독자적인 AI 및 클라우드 이니셔티브가 추진되고 있습니다. 걸프 국가들에서는 태양광 발전소와 연계된 수냉식 데이터센터가 도입되고 있는 한편, 홍해 연안의 육상 경로와 케냐의 새로운 해저 케이블 상륙을 통해 대륙 전체의 커버리지 범위가 확대되고 있습니다.
기타 혜택:
- 엑셀 형식 시장 예측(ME) 시트
- 3개월간의 애널리스트 지원
자주 묻는 질문
목차
제1장 서론
제2장 조사 방법
제3장 주요 요약
제4장 시장 구도
제5장 시장 규모와 성장 예측
제6장 경쟁 구도
제7장 시장 기회와 향후 전망
JHS 26.09.09According to Mordor Intelligence, the data center interconnect market size was valued at USD 16.24 billion in 2025 and estimated to grow from USD 18.62 billion in 2026 to reach USD 42.45 billion by 2032, at a CAGR of 14.73% during the forecast period (2026-2032).
This report is Segmented by Component (Hardware and More), Connectivity Type (Short-Haul and More), Application (Disaster Recovery and More), End-User Industry (Communication Service Providers and More), and Geography (North America and More). Market Forecasts are Provided in Terms of Value (USD).
Global Data Center Interconnect Market Trends and Insights
Expanding Edge and Hyperscale Data-Center Footprints
Hyperscale operators have earmarked USD 180 billion for distributed infrastructure that places compute close to users,forcing interconnect designs to support dense mesh topologies rather than hub-and-spoke layouts. Amazon's USD 100 billion expansion and Meta's USD 65 billion program typify this shift. Edge micro-facilities, projected to grow at a 37.9% CAGR, require power-efficient short-reach optics paired with programmable routing that can rebalance traffic in real time. Carrier hotels now double as edge nodes where cloud, content, and network operators converge, adding fresh demand for multi-tenant intra-metro links.
Surge in AI/HPC Traffic Requiring greater than 400 Gbps Links
AI model training generates all-to-all traffic patterns that saturate legacy 100 Gbps networks. Optical module shipments for 400G/800G exceeded 20 million units in 2024, underscoring aggressive migration timelines. NVIDIA's 800G photonic switch roadmap and IEEE's 800G Ethernet standard illustrate the ecosystem's pivot to coherent optics that push toward 1.6 Tbps lanes. Photonic switching fabrics reduce hop counts and latency, enabling AI clusters to scale without the oversubscription penalties of electrical spine-leaf trees.
High Upfront Cost of Coherent Optics and ROADMs
Advanced coherent engines and reconfigurable optical add-drop multiplexers (ROADMs) command premiums up to 300% over legacy gear, stretching capex budgets for mid-tier carriers. The ROADM market is projected at USD 1.2 billion by 2026, reflecting heavy investment needs. Operators in cost-sensitive regions postpone upgrades, reinforcing a two-tier global adoption pattern.
Other drivers and restraints analyzed in the detailed report include:
- Commercial 5G Roll-outs Accelerating Low-Latency Backhaul Demand
- Campus Liquid-Cooling Retrofits Boosting Short-Reach Optical Spend
- Shortage of Skilled Fiber-Construction Labor
For complete list of drivers and restraints, kindly check the Table Of Contents.
Segment Analysis
Hardware held 47.35% of 2025 revenue as operators procured dense DWDM shelves and coherent transceivers that underpin the data center interconnect market. The software tier will post a 16.12% CAGR as controllers automate bandwidth pooling, latency steering, and failover. Vendors pursuing co-packaged optics blend silicon switching with embedded lasers, lowering power per bit and shrinking footprints. Services revenue grows in tandem, reflecting demand for design, integration, and lifecycle support.
The data center interconnect market size for hardware is forecast to rise alongside AI cluster roll-outs, yet programmable orchestration remains the strategic differentiator. Operators use open APIs to stitch multi-vendor optics into a single intent-based fabric, cutting provisioning cycles from weeks to hours.
Short-haul links (< 80 km) delivered 60.25% of 2025 revenue because metro campuses, cloud on-ramps, and carrier hotels require dense east-west bandwidth. Long-haul systems will outpace with a 14.88% CAGR as hyperscalers pursue resilience across regions. The data center interconnect market size for long-haul will benefit from 1.6 Tbps coherent platforms that squeeze more capacity into existing fiber.
Projects such as the Medusa submarine cable add fresh routes linking Europe and Africa, creating new demand pools. Meanwhile, edge growth sustains short-haul volumes, ensuring balanced capex allocation between metro and backbone domains.
Complete Report Scope:
- by Component
- Hardware (DWDM, OTN, Packets)
- Software-Defined Networking and Control
- Services (Managed, Professional)
- by Connectivity Type
- Short-Haul
- Long-Haul
- by Application
- Disaster Recovery and Business Continuity
- Shared Data and Resource Clustering
- Data (Storage) Mobility
- Other Applications
- by End-user Industry
- Communication Service Providers (CSPs)
- Internet Content / Carrier-Neutral Providers (ICPs/CNPs)
- Government, Research and Education
- Other Verticals
- by Geography
- North America
- United States
- Canada
- Mexico
- South America
- Brazil
- Argentina
- Rest of South America
- Europe
- Germany
- United Kingdom
- France
- Russia
- Spain
- Italy
- Rest of Europe
- Asia-Pacific
- China
- Japan
- India
- South Korea
- Australia and New Zealand
- Rest of Asia-Pacific
- Middle East and Africa
- Middle East
- UAE
- Saudi Arabia
- Turkey
- Rest of Middle East
- Africa
- South Africa
- Nigeria
- Kenya
- Rest of Africa
- Middle East
- North America
Geography Analysis
North America leads the data center interconnect market owing to concentrated hyperscale campuses, advanced fiber corridors, and an active open-source ecosystem. DE-CIX Dallas's 400 GE upgrade highlights metro densification. U.S. projects spearhead photonic-switch adoption, aided by robust venture funding and favorable tax incentives.
Asia-Pacific is the fastest-growing region, with data-center capacity expected to triple by 2033 on the back of cloud adoption in China, Japan, India, and ASEAN markets. Domestic AI ambitions and 5G roll-outs accelerate both short-haul metro builds and cross-border long-haul corridors.
Europe balances sustainability rules and digital sovereignty objectives. Germany alone is projected to reach a USD 25.3 billion data-center valuation by 2029, purchasing high-efficiency optics to align with the EU's carbon-neutral pledge. Submarine cables such as 2Africa improve resilience, supporting content exchange with Middle Eastern and African hubs.
Latin America is a rising investment theater; Brazil accounts for 40% of regional spend, and Brookfield's search for an Ascenty partner underscores confidence in hyperscale growth. Mexico's Queretaro cluster attracts cloud majors seeking sub-20 ms latency to U.S. markets.
The Middle East and Africa pursue sovereign AI and cloud initiatives. Gulf states deploy liquid-cooled campuses tied to solar plants, while terrestrial routes along the Red Sea and new cable landings in Kenya widen continental reach.
- Ciena Corporation
- Cisco Systems Inc.
- Infinera Corporation
- Huawei Technologies Co. Ltd.
- Nokia Corporation (Nokia Networks)
- Juniper Networks Inc.
- ADVA Optical Networking SE
- Fujitsu Ltd.
- ZTE Corporation
- Arista Networks Inc.
- Ribbon Communications Inc.
- Pluribus Networks
- NVIDIA Corp. (Mellanox Networking)
- PacketLight Networks Ltd.
- Sterlite Technologies Ltd. (STL)
- Ekinops SA
- Megaport Ltd.
- Equinix Inc.
- Colt Technology Services Group Ltd.
- Microsemi Corporation
- PCCW Global Ltd.
Additional Benefits:
- The market estimate (ME) sheet in Excel format
- 3 months of analyst support
TABLE OF CONTENTS
1 INTRODUCTION
- 1.1 Study Assumptions and Market Definition
- 1.2 Scope of the Study
2 RESEARCH METHODOLOGY
3 EXECUTIVE SUMMARY
4 MARKET LANDSCAPE
- 4.1 Market Overview
- 4.2 Market Drivers
- 4.2.1 Expanding edge and hyperscale data-centre footprints
- 4.2.2 Surge in AI/HPC traffic requiring greater than 400 Gbps links
- 4.2.3 Commercial 5G roll-outs accelerating low-latency backhaul demand
- 4.2.4 Campus liquid-cooling retrofits boosting short-reach optical spend
- 4.2.5 Satellite ground-station colocation creating novel DCI nodes
- 4.2.6 Net-zero mandates driving adoption of photonic switching fabrics
- 4.3 Market Restraints
- 4.3.1 High upfront cost of coherent optics and ROADMs
- 4.3.2 Multi-vendor interoperability and network-complexity issues
- 4.3.3 Shortage of skilled fibre-construction labour
- 4.3.4 Municipal permitting delays for metro-haul trenching
- 4.4 Value / Supply-Chain Analysis
- 4.5 Regulatory Landscape
- 4.6 Technological Outlook
- 4.7 Porter's Five Forces
- 4.7.1 Bargaining Power of Suppliers
- 4.7.2 Bargaining Power of Consumers
- 4.7.3 Threat of New Entrants
- 4.7.4 Threat of Substitutes
- 4.7.5 Intensity of Competitive Rivalry
5 MARKET SIZE AND GROWTH FORECASTS (VALUE, USD BILLION)
- 5.1 by Component
- 5.1.1 Hardware (DWDM, OTN, Packets)
- 5.1.2 Software-Defined Networking and Control
- 5.1.3 Services (Managed, Professional)
- 5.2 by Connectivity Type
- 5.2.1 Short-Haul
- 5.2.2 Long-Haul
- 5.3 by Application
- 5.3.1 Disaster Recovery and Business Continuity
- 5.3.2 Shared Data and Resource Clustering
- 5.3.3 Data (Storage) Mobility
- 5.3.4 Other Applications
- 5.4 by End-user Industry
- 5.4.1 Communication Service Providers (CSPs)
- 5.4.2 Internet Content / Carrier-Neutral Providers (ICPs/CNPs)
- 5.4.3 Government, Research and Education
- 5.4.4 Other Verticals
- 5.5 by Geography
- 5.5.1 North America
- 5.5.1.1 United States
- 5.5.1.2 Canada
- 5.5.1.3 Mexico
- 5.5.2 South America
- 5.5.2.1 Brazil
- 5.5.2.2 Argentina
- 5.5.2.3 Rest of South America
- 5.5.3 Europe
- 5.5.3.1 Germany
- 5.5.3.2 United Kingdom
- 5.5.3.3 France
- 5.5.3.4 Russia
- 5.5.3.5 Spain
- 5.5.3.6 Italy
- 5.5.3.7 Rest of Europe
- 5.5.4 Asia-Pacific
- 5.5.4.1 China
- 5.5.4.2 Japan
- 5.5.4.3 India
- 5.5.4.4 South Korea
- 5.5.4.5 Australia and New Zealand
- 5.5.4.6 Rest of Asia-Pacific
- 5.5.5 Middle East and Africa
- 5.5.5.1 Middle East
- 5.5.5.1.1 UAE
- 5.5.5.1.2 Saudi Arabia
- 5.5.5.1.3 Turkey
- 5.5.5.1.4 Rest of Middle East
- 5.5.5.2 Africa
- 5.5.5.2.1 South Africa
- 5.5.5.2.2 Nigeria
- 5.5.5.2.3 Kenya
- 5.5.5.2.4 Rest of Africa
- 5.5.5.1 Middle East
- 5.5.1 North America
6 Competitive Landscape
- 6.1 Market Share Analysis
- 6.2 Company Profiles (includes Global-level Overview, Market-level Overview, Core Segments, Financials, Strategic Information, Market Rank/Share, Products and Services, Recent Developments)
- 6.2.1 Ciena Corporation
- 6.2.2 Cisco Systems Inc.
- 6.2.3 Infinera Corporation
- 6.2.4 Huawei Technologies Co. Ltd.
- 6.2.5 Nokia Corporation (Nokia Networks)
- 6.2.6 Juniper Networks Inc.
- 6.2.7 ADVA Optical Networking SE
- 6.2.8 Fujitsu Ltd.
- 6.2.9 ZTE Corporation
- 6.2.10 Arista Networks Inc.
- 6.2.11 Ribbon Communications Inc.
- 6.2.12 Pluribus Networks
- 6.2.13 NVIDIA Corp. (Mellanox Networking)
- 6.2.14 PacketLight Networks Ltd.
- 6.2.15 Sterlite Technologies Ltd. (STL)
- 6.2.16 Ekinops SA
- 6.2.17 Megaport Ltd.
- 6.2.18 Equinix Inc.
- 6.2.19 Colt Technology Services Group Ltd.
- 6.2.20 Microsemi Corporation
- 6.2.21 PCCW Global Ltd.
7 Market Opportunities and Future Outlook
- 7.1 White-space and Unmet-Need Assessment