|
시장보고서
상품코드
2123418
미국의 자동 자재관리 시장 : 점유율 분석, 업계 동향과 통계, 성장 예측(2026-2031년)United States Automated Material Handling - Market Share Analysis, Industry Trends & Statistics, Growth Forecasts (2026 - 2031) |
||||||
 Mordor Intelligence
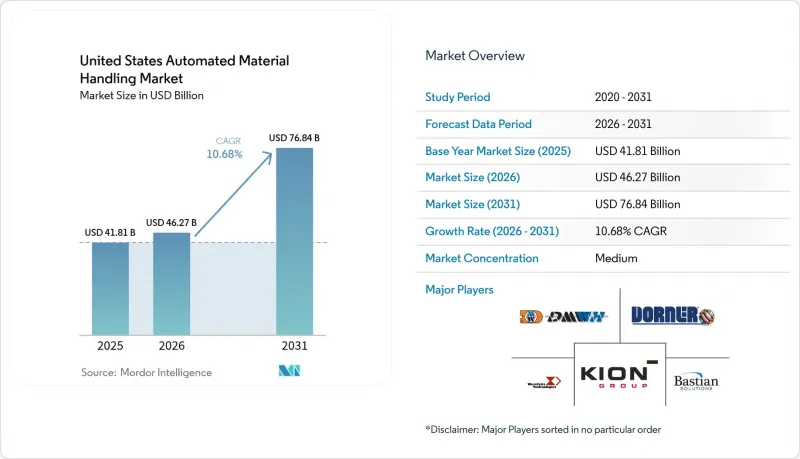
Mordor Intelligence에 의하면, 미국 자동 자재관리 시장 규모는 2025년 418억 1,000만 달러에서 2026년에는 462억 7,000만 달러로 확대되어 2026년부터 2031년까지 CAGR 10.68%로 성장을 지속하여, 2031년에는 768억 4,000만 달러에 이를 것으로 예측됩니다.
본 보고서는 제품 유형(하드웨어, 소프트웨어, 서비스), 장비 유형(AGV, AMR, 레이저 유도 차량, ASRS, 분류 시스템), 시스템 유형(자재 운반, 보관, 포장, 분류·팔레타이징 시스템), 최종 사용자 산업(공항, 자동차, 식품 및 음료 등)별로 분류되어 있습니다. 시장 전망은 금액(달러) 기준으로 제시되어 있습니다.
미국 자동 자재관리 시장 동향 및 인사이트
제조 공정의 복잡화와 기술 보급
자동차, 항공우주 및 전자 제품 공장에서는 현재 수만 개의 활성 SKU를 동시에 처리하고 있어 고정식 컨베이어 레이아웃은 시대에 뒤떨어진 상태입니다. 유연한 자동화 플랫폼은 머신러닝 알고리즘을 통합하고 토트 및 팔레트의 경로를 실시간으로 재설정함으로써 처리량을 유지하면서 피킹 오류를 40% 줄입니다. 디지털 트윈을 활용한 시뮬레이션은 자본 프로젝트의 위험을 완화하고, 엔지니어가 철골과 콘크리트가 결합되기 전에 자재 흐름 시나리오를 모델링할 수 있게 해줍니다. 이 접근 방식을 채택한 시설에서는 가동 개시 후 생산 라인의 생산성이 25-35% 향상되었다고 보고되었습니다. 개방형 소프트웨어 아키텍처는 제품 수명 주기가 단축될 때 신속한 재구성을 촉진하며, 맞춤화가 보편화되는 상황에서도 투자 수익률(ROI)을 보호합니다. 그 결과, 선순환이 만들어집니다. 복잡성이 증가함에 따라 자동화에 대한 수요가 높아지는 한편, 지능형 시스템이 이러한 복잡성을 제어함으로써 제조업체는 노동력을 비례적으로 늘리지 않고도 사업 규모를 확장할 수 있게 됩니다. 부품 가격 하락과 통합업체의 턴키 솔루션 제공으로 인해, 과거에는 1차 OEM 제조업체로만 제한되었던 첨단 로봇 기술도 이제 중규모 공장에서도 도입할 수 있게 되었습니다.
주문 정확도 향상과 SKU 증가에 대한 수요 증가
당일 배송 약속으로 인해 풀필먼트 센터에는 99.9%의 정확도가 요구되지만, 이는 현재의 임금 수준에서는 수작업 피킹으로는 달성할 수 없는 수준입니다. 비전 가이드 방식의 분류기와 AI를 활용한 품질 검사를 결합함으로써, 현재는 시간당 최대 1만 5,000개 단위를 처리하며 99.95%의 정확도를 실현하고 있어, 반품률을 대폭 줄이고 이익률을 높이고 있습니다. 로봇은 초과근무 수당 없이 모든 교대 근무에 투입되므로 인건비 절감률은 60-70%에 달할 전망입니다. 피킹과 포장을 모두 자동화한 소매업체의 경우, 소비자가 올바른 상품을 더 빨리 수령할 수 있게 됨에 따라 순추천지수(NPS)가 두 자릿수 성장세를 보이고 있습니다. 또한, 높은 정확도로 인해 마켓플레이스 파트너로부터의 차지백이 억제되어 판매자의 평판을 지키고 성장을 지속할 수 있습니다. 재무적 이점도 설득력이 있습니다. 투자 회수 기간이 2년 미만이기 때문에 CFO는 여러 거점으로의 확장을 승인하고 자동화를 네트워크 전략에 깊이 통합할 수 있습니다.
공급망의 기술 격차와 인력 부족
딜로이트의 추산에 따르면, 2033년까지 미국에서는 190만 건의 제조업 채용 공고가 채워지지 않은 채 남을 가능성이 있으며, 그중에서도 자동화 기술자는 인력이 가장 부족한 직종 중 하나입니다. 각 통합 업체들은 현지 기술자층의 PLC 프로그래밍 및 로봇 문제 해결 능력이 부족하여 시운전이 6-12개월 지연된다고 자주 지적하고 있습니다. 퇴직으로 인해 조직의 노하우가 소실되는 속도는 커뮤니티 칼리지의 교육 과정으로 이를 보충할 수 있는 속도를 앞지르고 있어, 인력 부족을 더욱 심각하게 만들고 있습니다. 이에 대해 고용주들은 사내 교육 기관 설립이나 직업 훈련 학교와의 제휴를 통해 대응하고 있지만, 이러한 노력이 결실을 맺기까지는 수년이 소요됩니다. 인력 공급 경로가 확대되기 전까지는 프로젝트 소요 기간이 장기화되어 미국 자동 자재관리 시장의 성장 가능성을 제약할 것입니다.
부문 분석
2025년, 크레인, 컨베이어, 로봇이 여전히 모든 자재관리 설비의 기반을 이루고 있기 때문에 하드웨어는 미국 자동 자재관리 시장의 66.35% 점유율을 유지했습니다. 반면, 클라우드 플랫폼, AI 엔진, 예측 유지보수 모듈이 필수 요소로 자리 잡음에 따라 소프트웨어 부문은 연평균 성장률(CAGR) 14.74%로 확대될 것으로 예측됩니다. 사업자들이 여러 거점에 걸친 통합 제어 타워를 요구함에 따라, 소프트웨어를 중심으로 한 거래가 차지하는 미국 자동 자재관리 시장 규모는 확대되고 있습니다.
창고 관리 제품군은 현재 모든 자산에서 수집한 텔레메트리 데이터를 통합하고, 머신러닝 모델을 실행하여 경로를 최적화하며, 몇 초 만에 로봇에 업데이트된 정보를 전송하고 있습니다. 비즈니스 인텔리전스(BI) 대시보드를 통합한 시설에서는 워크플로우 설정을 매일 조정함으로써 처리 능력이 15-25% 향상되고 있습니다. 구독형 라이선스를 통해 설비 투자(Capex)가 운영 비용(OpEx)으로 전환되어 계절적 변동에 따른 비용 조정이 가능해지는 한편, 지속적인 기능 업데이트도 보장됩니다. 서비스는 이 세 가지 핵심 요소를 완성합니다. 전문가에 의한 감사, 연중무휴 24시간 원격 진단, 단계적 개조를 통해 가동 시간을 확보하고 자산의 수명을 연장함으로써, 더 광범위한 미국 자동 자재관리 시장 내 공급업체에 대한 충성도를 높이고 있습니다.
2025년에는 공간이 제한된 물류 센터(DC)에서 부피 극대화와 재고 추적 가능성이 요구됨에 따라 자동 창고 시스템(AS/RS)이 매출의 24.20%를 차지했습니다. 그러나 자율 이동 로봇(AMR)은 연평균 성장률(CAGR) 13.08%로 성장의 주역이 되어, 그린필드 및 브라운필드 사이트 전반에 걸친 내부 물류 흐름을 재정의하고 있습니다. AMR은 고정된 유도 경로 없이 이동하기 때문에 옴니채널 커머스에서 일상적으로 발생하는 상품 구성 변화에 따른 재구성 비용을 대폭 절감합니다.
시험 운영을 위한 차량은 일반적으로 소규모로 시작되지만, API 우선 아키텍처를 통해 운영자는 대규모 재설계 없이도 수백 대 규모까지 확장할 수 있습니다. KION이 Fox Robotics와 제휴하여 자율 주행 트레일러 로더를 개발한 사례는 엔드투엔드 물류 흐름의 마지막 미개척 분야인 야드 작업의 자동화를 추진하는 움직임을 상징합니다. 기존의 AGV(자동 유도 차량), 레이저 유도 차량, 팔레타이저는 중량물이나 예측 가능한 경로에서 여전히 유용하며, 한편 고속 분류 시스템은 유연성보다 처리 능력을 중시하는 소포 허브에서 확고한 입지를 유지하고 있습니다. 전반적으로 미국의 자동 자재관리 시장에서는 고정된 정밀도와 기동성을 겸비한 장비 포트폴리오가 계속해서 지지를 받고 있습니다.
기타 혜택:
- 엑셀 형식 시장 예측(ME) 시트
- 3개월간의 애널리스트 지원
자주 묻는 질문
목차
제1장 서론
제2장 조사 방법
제3장 주요 요약
제4장 시장 구도
제5장 시장 규모와 성장 예측
제6장 경쟁 구도
제7장 시장 기회와 향후 전망
JHS 26.09.09According to Mordor Intelligence, the United States automated material handling market size is expected to grow from USD 41.81 billion in 2025 to USD 46.27 billion in 2026 and is forecast to reach USD 76.84 billion by 2031 at 10.68% CAGR over 2026-2031.
This report is Segmented by Product Type (Hardware, Software, and Services), Equipment Type (AGV, AMR, Laser Guided Vehicle, ASRS, and Sortation System), System Type (Material Transport, Storage, Packaging, and Sorting and Palletizing Systems), End-User Vertical (Airport, Automotive, Food and Beverage, and More). The Market Forecasts are Provided in Terms of Value (USD).
United States Automated Material Handling Market Trends and Insights
Increasing Manufacturing Complexity and Technology Availability
Automotive, aerospace, and electronics plants now juggle tens of thousands of active SKUs, making fixed conveyor layouts obsolete. Flexible automation platforms integrate machine-learning algorithms that re-route totes or pallets in real time, trimming picking errors by 40% while preserving throughput. Digital-twin simulations de-risk capital projects, letting engineers model material-flow scenarios before steel meets concrete; facilities that embrace this approach report 25-35% higher line productivity after go-live. Open software architectures encourage rapid reconfiguration when product lifecycles shrink, safeguarding return on investment as customization proliferates. The result is a virtuous cycle: heightened complexity sparks automation demand, while intelligent systems tame that complexity, allowing manufacturers to scale without proportional labour growth. As component prices fall and integrators package turnkey solutions, even mid-sized plants can deploy advanced robotics once reserved for tier-one OEMs.
Increasing Demand for Improving Order Accuracy and SKU Proliferation
Same-day delivery promises drive fulfilment centers toward 99.9% accuracy, a bar unattainable with manual picking at current wage levels. Vision-guided sorters paired with AI quality checks now process up to 15,000 units per hour and deliver 99.95% precision, slashing returns and boosting margin. Labor savings range from 60-70% because robots operate every shift without overtime premiums. Retailers that automate both picking and pack-out note double-digit jumps in Net Promoter Scores as consumers receive the right goods faster. Furthermore, high accuracy curtails chargebacks from marketplace partners, preserving seller reputations and sustaining growth. The financial logic is compelling: payback periods under two years allow CFOs to green-light multi-site rollouts, embedding automation deep into network strategy.
Gap in Supply-Chain Skills and Workforce Shortage
Deloitte estimates 1.9 million U.S. manufacturing jobs could remain unfilled by 2033, with automation technicians among the scarcest roles. Integrators routinely cite commissioning delays of six to twelve months because local talent pools lack PLC programming and robotics troubleshooting capability. Retirements drain institutional knowledge faster than community-college curricula can replenish it, magnifying the shortfall. Employers respond by launching internal academies and partnering with vocational schools, but these efforts take years to bear fruit. Until the pipeline widens, project timelines will extend, constraining the growth potential of the United States automated material handling market.
Other drivers and restraints analyzed in the detailed report include:
- Emergence of Smart City Logistics and Wide Adoption of Robotics in Warehouse Applications
- Tax Incentives Under Section 179 Accelerated Depreciation for Automation Equipment
- Semiconductor Supply-Chain Volatility Limiting Sensor Availability
For complete list of drivers and restraints, kindly check the Table Of Contents.
Segment Analysis
Hardware maintained 66.35% of the United States automated material handling market share in 2025 because cranes, conveyors, and robots remain the backbone of any automated installation. Software, however, is projected to expand at a 14.74% CAGR as cloud platforms, AI engines, and predictive-maintenance modules become indispensable. The United States automated material handling market size captured by software-centric deals is rising as operators seek unified control towers that telescope across multiple sites.
Warehouse management suites now ingest telemetry from every asset, run machine-learning models to optimize routings, and push updates back to robots in seconds. Facilities that integrate business-intelligence dashboards see 15-25% throughput gains by dialling workflow settings daily. Subscription licenses convert capex to opex, aligning costs with seasonality while ensuring continuous feature updates. Services complete the triad: expert audits, 24-7 remote diagnostics, and phased retrofits preserve uptime and stretch asset lives, reinforcing vendor stickiness in the broader United States automated material handling market.
Automated storage and retrieval systems held a 24.20% revenue share in 2025 because space-constrained DCs require cubic maximization and inventory traceability. Yet autonomous mobile robots headline growth with a 13.08% CAGR, redefining intralogistics flow across greenfield and brownfield sites. AMRs navigate without fixed guide paths, slashing reconfiguration cost when product mixes shift an everyday reality in omnichannel commerce.
Pilot fleets typically start small, but API-first architectures let operators scale to hundreds of units without forklift-heavy redesigns. KION's partnership with Fox Robotics to build autonomous trailer loaders exemplifies a push to automate yard operations, the final frontier in end-to-end flow. Traditional AGVs, laser-guided vehicles, and palletizers remain relevant in heavy or predictable routes, while high-speed sortation maintains a foothold in parcel hubs that prize throughput over flexibility. Overall, the United States automated material handling market continues to favour equipment portfolios that combine fixed precision with mobile agility.
Complete Report Scope:
- By Equipment Type
- Forklifts
- Automated Guided Vehicles (AGVs)
- Conveyor Systems
- Storage and Retrieval Systems
- Cranes and Hoists
- By End-User Industry
- E-commerce and 3PL
- Food and Beverage
- Manufacturing
- Retail (non-e-commerce)
- Pharmaceuticals
- By Capacity Range
- Below 5,000 lbs
- 5,000 - 10,000 lbs
- 10,001 - 20,000 lbs
- Above 20,000 lbs
- By Financing Type
- Operating Lease
- Capital Lease
- Loan / Hire-Purchase
- Sale and Lease-Back
List of Companies Covered in this Report:
- CIT Group Inc.
- Crest Capital LLC
- Element Fleet Management Corp.
- Trust Capital LLC
- DLL Finance LLC
- Pacific Rim Capital Inc.
- CLARK Material Handling Company
- Taylor Leasing and Rental Inc.
- Evolve Bank and Trust
- Toyota Material Handling USA Inc.
- Bank of the West
- HomeTrust Bank
- TCF Bank
- Hanmi Bank
- Bank of America Corp.
- Wells Fargo and Company
Additional Benefits:
- The market estimate (ME) sheet in Excel format
- 3 months of analyst support
TABLE OF CONTENTS
1 INTRODUCTION
- 1.1 Study Assumptions and Market Definition
- 1.2 Scope of the Study
2 RESEARCH METHODOLOGY
3 EXECUTIVE SUMMARY
4 MARKET LANDSCAPE
- 4.1 Market Overview
- 4.2 Market Drivers
- 4.2.1 Rising e-commerce warehouse expansion
- 4.2.2 Growing preference for "as-a-service" models among SMEs
- 4.2.3 Accelerated automation mandates due to labor constraints
- 4.2.4 ESG-linked financing incentives from U.S. banks
- 4.2.5 Secondary market liquidity for used equipment
- 4.2.6 Federal tax advantages under Section 179 deduction
- 4.3 Market Restraints
- 4.3.1 High residual-value uncertainty for AGVs
- 4.3.2 Bank tightening on credit scores post-2024
- 4.3.3 Volatility in benchmark interest rates
- 4.3.4 Cyber-risk premiums embedded in lease contracts
- 4.4 Industry Value-Chain Analysis
- 4.5 Regulatory Landscape
- 4.6 Technological Outlook
- 4.7 Porter's Five Forces Analysis
- 4.7.1 Threat of New Entrants
- 4.7.2 Bargaining Power of Suppliers
- 4.7.3 Bargaining Power of Buyers
- 4.7.4 Threat of Substitutes
- 4.7.5 Competitive Rivalry
5 MARKET SIZE AND GROWTH FORECASTS (VALUE)
- 5.1 By Equipment Type
- 5.1.1 Forklifts
- 5.1.2 Automated Guided Vehicles (AGVs)
- 5.1.3 Conveyor Systems
- 5.1.4 Storage and Retrieval Systems
- 5.1.5 Cranes and Hoists
- 5.2 By End-User Industry
- 5.2.1 E-commerce and 3PL
- 5.2.2 Food and Beverage
- 5.2.3 Manufacturing
- 5.2.4 Retail (non-e-commerce)
- 5.2.5 Pharmaceuticals
- 5.3 By Capacity Range
- 5.3.1 Below 5,000 lbs
- 5.3.2 5,000 - 10,000 lbs
- 5.3.3 10,001 - 20,000 lbs
- 5.3.4 Above 20,000 lbs
- 5.4 By Financing Type
- 5.4.1 Operating Lease
- 5.4.2 Capital Lease
- 5.4.3 Loan / Hire-Purchase
- 5.4.4 Sale and Lease-Back
6 COMPETITIVE LANDSCAPE
- 6.1 Market Concentration
- 6.2 Strategic Moves
- 6.3 Market Share Analysis
- 6.4 Company Profiles (includes Global level Overview, Market level overview, Core Segments, Financials as available, Strategic Information, Market Rank/Share for key companies, Products and Services, and Recent Developments)
- 6.4.1 CIT Group Inc.
- 6.4.2 Crest Capital LLC
- 6.4.3 Element Fleet Management Corp.
- 6.4.4 Trust Capital LLC
- 6.4.5 DLL Finance LLC
- 6.4.6 Pacific Rim Capital Inc.
- 6.4.7 CLARK Material Handling Company
- 6.4.8 Taylor Leasing and Rental Inc.
- 6.4.9 Evolve Bank and Trust
- 6.4.10 Toyota Material Handling USA Inc.
- 6.4.11 Bank of the West
- 6.4.12 HomeTrust Bank
- 6.4.13 TCF Bank
- 6.4.14 Hanmi Bank
- 6.4.15 Bank of America Corp.
- 6.4.16 Wells Fargo and Company
7 MARKET OPPORTUNITIES AND FUTURE OUTLOOK
- 7.1 White-Space and Unmet-Need Assessment