
|
시장보고서
상품코드
2123596
지속가능한 포장 시장 : 시장 점유율 분석, 업계 동향 및 통계, 성장 예측(2026-2031년)Sustainable Packaging - Market Share Analysis, Industry Trends & Statistics, Growth Forecasts (2026 - 2031) |
||||||
 Mordor Intelligence
Mordor Intelligence에 의하면, 지속가능한 포장 시장 규모는 2025년에 3,038억 달러로 평가되었고, 2026년 3,259억 4,000만 달러에서 2031년까지 4,634억 1,000만 달러에 이를 것으로 예측되며, 예측 기간(2026-2031년) CAGR은 7.29%를 나타낼 전망입니다.
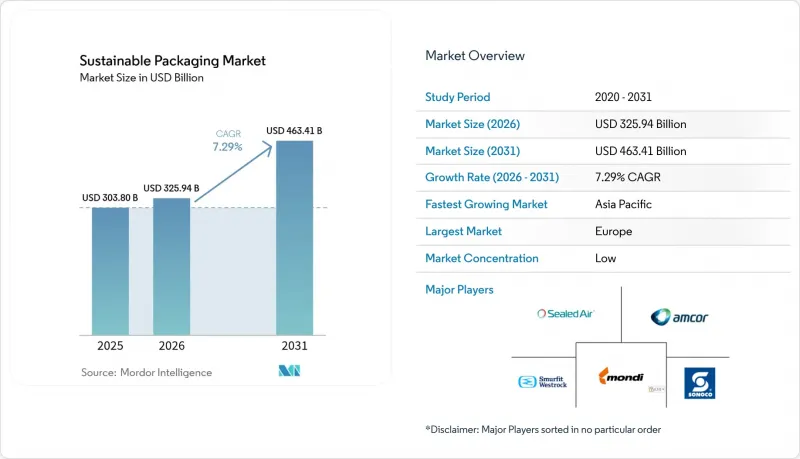
본 보고서는 공정별(재사용 가능, 재활용 가능, 기타), 소재 유형별(종이 및 판지, 플라스틱, 기타), 포장 형태별(경질, 연질), 기능별(1차 포장, 2차 포장, 3차 포장·운송용 포장), 최종 사용자별(식품 및 음료, 의약품 및 의료, 화장품 및 퍼스널케어, 기타), 지역별로 분류되어 있습니다. 시장 예측은 금액(달러) 기준으로 제시되어 있습니다.
세계의 지속가능한 포장 시장 동향 및 인사이트
확대 생산자 책임(EPR) 법이 규정 준수의 통합을 촉진
63개 관할 구역의 EPR(확대 생산자 책임) 규제가 조화됨에 따라, 규제의 세분화가 해소되고 있습니다. 2025년 2월에 발효되는 유럽연합(EU)의 ‘포장 및 포장 폐기물 규정’은 PET 식품 포장에 대해 30%의 재활용 재료 함유율 목표를 설정하고 PFAS를 금지하고 있으며, 이에 따라 OECD 및 BRICS 국가들에서도 유사한 프레임워크가 도입되고 있습니다. 케냐의 새로운 법규는 EU의 요금 체계를 반영하고 있으며, 오리건주와 콜로라도주에서는 2025년 7월부터 브랜드가 자금을 지원하는 생산자 책임 조직(PRO)의 설립이 의무화되었습니다. 일정이 통일됨에 따라 세계 브랜드는 단일 설계의 솔루션을 대규모로 전개할 수 있게 되었으며, 이는 규정 준수 비용 절감과 지속 가능한 포장 시장 전반에서의 도입 가속화로 이어지고 있습니다.
브랜드의 노력이 규제 최저 기준을 뛰어넘는 PCR 함유율 표준화를 추진
대형 소비재 기업들은 현재 2030년까지 전체 제품 포트폴리오에서 25-50%의 소비 후 재활용(PCR) 소재 함량을 달성하겠다고 공약하며, 법적 규제를 뛰어넘는 노력을 기울이고 있습니다. 유니레버(Unilever)가 내세운 “2025년까지 모든 포장재를 재활용 가능, 재사용 가능 또는 퇴비화 가능하게 만들겠다”는 목표와, 암코어(Amcor)가 캐드버리(Cadbury)의 포장재용으로 1,000톤의 재활용 플라스틱을 공급하는 노력은 사실상 산업 표준이 되는 자발적 목표의 좋은 사례입니다. 미국 플라스틱 협약(U.S. Plastics Pact)이 제시한 표준화된 PCR 측정 툴킷은 검증 과정을 효율화하고 조달의 투명성을 높이며, 지속 가능한 포장 시장의 성장을 뒷받침하고 있습니다.
PCR 수지공급 제약이 전략적 병목 현상을 야기하고 있습니다.
현재 각 브랜드의 공약은 투명하고 식품 등급의 PCR 공급량을 초과하고 있습니다. 우유 생산량 감소로 인해 천연 유래 HDPE 공급원이 축소되고 프리미엄 가격이 상승하고 있을 뿐만 아니라, 수입에 의존할 수밖에 없는 상황이 되어 국내 재활용 업체에 압박을 가하고 있습니다. 이러한 불균형은 규제상 할당량 기한 내 달성을 위협하고 있으며, 지속 가능한 포장 시장의 대중 시장으로의 확장을 둔화시키고 있습니다.
부문 분석
2025년에도 재활용 가능한 형태의 점유율은 44.88%를 유지했으나, 퇴비화 가능 및 생분해성 제품은 연평균 성장률(CAGR) 12.32%로 성장하고 있으며, 이는 B&Zeos의 해조류 필름과 같은 바이오 소재에 대한 투자자들의 신뢰를 반영하고 있습니다. 퇴비화 가능한 지속가능한 포장 시장 규모는 미세 플라스틱의 미세화를 수반하지 않는 솔루션을 추구하는 푸드서비스 산업 및 퍼스널케어 브랜드 수요에 힘입어 성장하고 있습니다. 그러나 미국 지자체 중 산업용 퇴비화 시설을 이용할 수 있는 곳은 불과 30%에 그치고 있어, 이는 단기적인 시장 침투를 저해하고 있습니다. 이에 대응하기 위해 미국의 ‘COMPOST 법’은 처리 능력을 확대하기 위해 20억 달러의 보조금을 제안하고 있으며, 이것이 실현된다면 폐기물 재활용률과 장기적인 성장 전망을 직접적으로 향상시킬 것입니다.
폐기 시 처리 방법에 대한 소비자의 혼란은 여전히 유기성 폐기물 흐름에 이물질을 혼입시키는 원인이 되고 있어, 보다 명확한 표시와 일반 시민을 대상으로 한 인식 제고 캠페인이 요구되고 있습니다. 혐기성 소화는 대안으로 부상하고 있으며, 바이오가스를 통해 수익을 창출함으로써 프로젝트의 경제성을 높이고 인프라 부족을 부분적으로 보완하고 있습니다. 정책 및 처리 체계의 격차가 점차 해소됨에 따라 생분해성 포장은 지속 가능한 포장 시장에서 점유율을 확대해 나갈 전망입니다.
종이 및 판지는 성숙한 재활용 시스템과 소비자의 신뢰 덕분에 2025년 매출의 39.96%를 차지했습니다. 한편, 식물 유래 기판은 물 사용량을 75%, 에너지 사용량을 30% 절감하고 순환형 경제에 대한 적합성을 높이는 스트라 엔소(Stora Enso)사의 건식 성형 섬유 라인에 힘입어 연평균 성장률(CAGR) 11.21%로 확대되고 있습니다. PFAS 금지 및 재생 재료 함유율에 관한 규제가 강화됨에 따라, 폴리올레핀의 지속가능한 포장 시장 점유율은 점차 축소될 것으로 예측됩니다.
버클리 대학의 260°C 기화 공정을 비롯한 첨단 재활용 기술 혁신은 폴리에틸렌을 98%의 회수율로 원료로 전환하여 식품 등급의 재활용 루프를 실현함과 동시에 다운사이클링을 완화합니다. 균사체 폼이나 목재 유래 PET 대체재는 틈새 시장을 넘어 적용 가능한 이용 사례를 확대하고 있으며, 이는 지속가능한 포장 시장에서 더 광범위한 소재 전환을 시사합니다.
지역별 분석
2025년에 유럽이 34.18%의 매출 점유율을 차지하게 된 배경에는 선구적인 규제 태도가 있으며, 이는 성숙한 재활용 인프라와 친환경 설계 기준을 만들어내고 있습니다. 순환성 성과에 따른 EPR(생산자 책임 회수) 요금 조정은 재활용 재료 함유율이 높은 포장을 장려하고, 공급업체의 혁신 주기를 강화하고 있습니다. 통합된 보증금 반환 제도가 회수 과정을 효율화하고 있으며, 유럽은 첨단 재활용 시범 사업과 바이오 소재의 상용화 모두에서 기준이 되는 시장이 되고 있습니다. 이 지역에 거점을 둔 다국적 브랜드의 본사는 수요 밀도를 더욱 높여, 지속 가능한 포장 시장이 현지에서 혁신 기술을 지속적으로 검증하고 확대할 수 있도록 보장하고 있습니다.
아시아태평양은 일본, 한국, 호주의 규제 강화와 중국 및 인도의 EPR(확대 생산자 책임) 체계 도입에 힘입어 연평균 성장률(CAGR) 11.05%라는 가장 높은 성장률을 기록할 전망입니다. 2024년에 시행될 일본의 재활용 플라스틱 사용 의무화와 2025년 6월에 발효될 식품 접촉용 재생 수지 포지티브 리스트는 고수익성 용도를 개발하고, 국내 수지 재처리 투자를 촉진할 것입니다. 중국의 재활용 플라스틱 감독 시책 진전과 전자상거래의 강력한 성장이 맞물려 사용량 확대가 가속화되고 있습니다. 2026년까지 35억 달러에 달할 것으로 예상되는 베트남의 종이 포장 부문은 수출 지향형 제조업을 기반으로 한 지역적 확장을 상징하고 있습니다.
북미에서는 주 차원의 확대된 생산자 책임(EPR) 도입과 소비재 대기업들의 적극적인 자발적 노력이 호재로 작용하고 있습니다. 오리건주, 콜로라도주, 캘리포니아주의 각 프로그램은 가정 쓰레기 수거 시스템 구축에 자금을 지원하고 있으며, 이를 통해 PCR(소비 후 재활용 플라스틱) 원료공급이 확대되고 비용 격차가 줄어들고 있습니다. 호주에서 최근 발생한 클로록스(Clorox)사를 상대로 한 소송으로 대표되는 ‘그린워싱’ 관련 소송은 정보 공개의 엄격화를 촉진하고, 소비자의 신뢰를 높이는 동시에 투명성이 높은 공급망 구축을 추진하고 있습니다. 중동 및 아프리카와 남미는 여전히 발전 단계에 있지만, 정책의 급속한 수렴이 관찰되고 있으며, 인프라가 확대됨에 따라 조기에 진출한 기술 기업들에게 미개척 시장 기회가 열리고 있습니다.
기타 혜택
- 엑셀 형식 시장 전망(ME) 시트
- 3개월간의 애널리스트 지원
자주 묻는 질문
목차
제1장 서론
제2장 조사 방법
제3장 주요 요약
제4장 시장 구도
제5장 시장 규모 및 성장 예측
제6장 경쟁 구도
제7장 시장 기회 및 향후 전망
AJYAccording to Mordor Intelligence, the sustainable packaging market size was valued at USD 303.80 billion in 2025 and estimated to grow from USD 325.94 billion in 2026 to reach USD 463.41 billion by 2031, at a CAGR of 7.29% during the forecast period (2026-2031).
This report is Segmented by Process (Reusable, Recyclable, and More), Material Type (Paper and Paperboard, Plastics, and More), Packaging Format (Rigid, Flexible), Function (Primary, Secondary, Tertiary/Transport), End User (Food and Beverage, Pharmaceutical and Healthcare, Cosmetics and Personal Care, and More), and Geography. The Market Forecasts are Provided in Terms of Value (USD).
Global Sustainable Packaging Market Trends and Insights
Extended Producer-Responsibility Laws Create Compliance Convergence
Converging EPR mandates in 63 jurisdictions are dismantling regulatory fragmentation. The European Union's Packaging and Packaging Waste Regulation, effective February 2025, sets 30% recycled-content targets for PET food packaging and bans PFAS, prompting similar frameworks across OECD and BRICS economies. New Kenyan statutes mirror EU fee structures, while Oregon and Colorado require brand-funded Producer Responsibility Organizations from July 2025. Harmonized timelines let global brands deploy single-design solutions at scale, lowering compliance costs and accelerating adoption across the sustainable packaging market.
Brand Commitments Drive PCR Content Standardization Beyond Regulatory Minimums
Major consumer-goods firms now exceed legislation by pledging 25-50% post-consumer recycled (PCR) content portfolio-wide by 2030. Unilever's 2025 goal for all packaging to be recyclable, reusable, or compostable and Amcor's supply of 1,000 tons of recycled plastic for Cadbury wrappers exemplify voluntary targets setting de facto industry baselines. Standardized PCR measurement toolkits from the U.S. Plastics Pact streamline verification, catalyzing procurement clarity and fueling growth in the sustainable packaging market.
PCR Resin Supply Constraints Create Strategic Bottlenecks
Brand pledges now outstrip supply of clear, food-grade PCR. Declining milk volumes shrink the natural HDPE stream, inflating premiums and forcing import reliance that undercuts domestic reclaimers. This imbalance threatens timely fulfillment of regulatory quotas, slowing mass-market expansion of the sustainable packaging market.
Other drivers and restraints analyzed in the detailed report include:
- E-commerce Logistics Pilots Scale Reusable Packaging Systems
- AI-Enhanced Sortation Technologies Improve Recycling Economics
- Cost Premium Persistence Challenges Mass-Market Adoption
For complete list of drivers and restraints, kindly check the Table Of Contents.
Segment Analysis
Recyclable formats retained a 44.88% share in 2025, yet compostable and biodegradable offerings are growing at a 12.32% CAGR, reflecting investor faith in biomaterials such as B'Zeos' seaweed films. The sustainable packaging market size for compostables is riding demand from food-service and personal-care brands seeking solutions free from microplastic fragmentation. However, only 30% of U.S. municipalities have access to industrial composting sites, curbing near-term penetration. In response, the U.S. COMPOST Act proposes USD 2 billion in grants to expand capacity, which would directly lift diversion rates and long-run growth prospects.
Consumer confusion over end-of-life handling still triggers contamination in organic-waste streams, calling for clearer labeling and public-education campaigns. Anaerobic digestion has emerged as an alternate pathway, generating biogas revenue that improves project economics and partially offsets infrastructure shortfalls. With policy and processing gaps gradually closing, compostable formats are set to capture an expanding slice of the sustainable packaging market.
Paper and paperboard represented 39.96% of 2025 revenue owing to mature recycling systems and consumer trust. Plant-based substrates, however, are advancing at 11.21% CAGR, propelled by Stora Enso's dry-forming fiber lines that cut water use by 75% and energy by 30%, boosting circularity credentials. The sustainable packaging market share of polyolefins is expected to contract gradually as PFAS bans and recycled-content rules intensify.
Advanced recycling breakthroughs, including Berkeley's 260 °C vaporization process that converts polyethylene into feedstock with 98% recovery, enable food-grade loops and mitigate downcycling. Mycelium foams and wood-based PET replacements are expanding addressable use cases beyond niche segments, signaling a broader materials transition within the sustainable packaging market.
Complete Report Scope:
- By Process
- Reusable Packaging
- Recyclable Packaging
- Compostable / Biodegradable Packaging
- Edible Packaging
- By Material Type
- Paper and Paperboard
- Plastics
- Glass
- Metal (Aluminum, Steel)
- Plant-based Materials (Bagasse, Mushroom, etc.)
- By Packaging Format
- Rigid
- Flexible
- By Function
- Primary Packaging
- Secondary Packaging
- Tertiary / Transport Packaging
- By End User
- Food and Beverage
- Pharmaceutical and Healthcare
- Cosmetics and Personal Care
- E-commerce and Retail
- Consumer Electronics
- Other End User
- By Geography
- North America
- United States
- Canada
- Mexico
- Europe
- Germany
- United Kingdom
- France
- Italy
- Spain
- Russia
- Rest of Europe
- Asia-Pacific
- China
- India
- Japan
- South Korea
- Australia and New Zealand
- Rest of Asia-Pacific
- Middle East and Africa
- Middle East
- United Arab Emirates
- Saudi Arabia
- Turkey
- Rest of Middle East
- Africa
- South Africa
- Nigeria
- Egypt
- Rest of Africa
- Middle East
- South America
- Brazil
- Argentina
- Rest of South America
- North America
Geography Analysis
Europe's 34.18% revenue share in 2025 reflects its first-mover regulatory stance that has birthed mature recycling infrastructure and eco-design norms. EPR fee modulation by circularity performance incentivizes high-recycled-content packaging, reinforcing supplier innovation cycles. Harmonized deposit-return schemes streamline collection, making Europe the reference market for both advanced recycling pilots and bio-based material commercialization. Multinational brand headquarters located in the region further amplify demand density, ensuring the sustainable packaging market continues to test and scale breakthroughs locally.
Asia-Pacific is on track for the fastest 11.05% CAGR thanks to tightening rules in Japan, South Korea, Australia, and pilot EPR frameworks in China and India. Japan's recycled-plastic mandate effective 2024 and its positive list for food-contact recycled resins entering force in June 2025 unlock high-margin applications and spur domestic resin reprocessing investments. China's evolving supervision policy for recycled plastics coupled with strong e-commerce growth accelerates volume uptake. Vietnam's paper-packaging sector, projected at USD 3.5 billion by 2026, exemplifies regional expansion anchored in export-oriented manufacturing.
North America benefits from state-level EPR adoption and aggressive voluntary commitments by consumer-goods leaders. Oregon, Colorado, and California programs fund curbside upgrades, boosting PCR feedstock availability and narrowing cost spreads. Greenwashing litigation-exemplified by Australia's recent Clorox action-raises disclosure rigor, bolstering consumer trust and driving transparent supply chains. Middle East & Africa and South America remain nascent but show rapid policy convergence, opening white-space opportunities for early technology entrants as infrastructure scales.
- Amcor plc
- Smurfit WestRock Company
- Tetra Pak International SA
- Sonoco Products Company
- Sealed Air Corporation
- Mondi plc
- Huhtamaki Oyj
- BASF SE
- Ardagh Group SA
- Ball Corporation
- Crown Holdings Inc.
- Genpak LLC
- International Paper Company
- Stora Enso Oyj
- Graphic Packaging Holding Co.
- Uflex Ltd.
- Novolex Holdings Inc.
- Ecovative LLC
Additional Benefits:
- The market estimate (ME) sheet in Excel format
- 3 months of analyst support
TABLE OF CONTENTS
1 INTRODUCTION
- 1.1 Study Assumptions and Market Definition
- 1.2 Scope of the Study
2 RESEARCH METHODOLOGY
3 EXECUTIVE SUMMARY
4 MARKET LANDSCAPE
- 4.1 Market Overview
- 4.2 Market Drivers
- 4.2.1 Extended producer-responsibility (EPR) laws surge in OECD and BRICS markets
- 4.2.2 Brand-owner pledges driving >25 % PCR content across portfolios
- 4.2.3 Retailer take-back and reuse pilots scaling in e-commerce logistics
- 4.2.4 AI-enabled sortation raising post-consumer recycling yields
- 4.2.5 Food-grade chemical recycling breakthroughs for polyolefins
- 4.2.6 Emerging mycelium and seaweed packaging securing venture capital
- 4.3 Market Restraints
- 4.3.1 Supply-demand gap in high-quality PCR resins
- 4.3.2 Inflation-driven cost premium vs. virgin substrates
- 4.3.3 Fragmented composting infrastructure in North America and APAC
- 4.3.4 "Greenwashing" litigation risk altering marketing claims
- 4.4 Supply-Chain Analysis
- 4.5 Regulatory Landscape
- 4.6 Technological Outlook
- 4.7 Porter's Five Forces Analysis
- 4.7.1 Bargaining Power of Suppliers
- 4.7.2 Bargaining Power of Buyers
- 4.7.3 Threat of New Entrants
- 4.7.4 Intensity of Competitive Rivalry
- 4.7.5 Threat of Substitutes
- 4.8 Assessment of Impact of Microeconomic Factors
5 MARKET SIZE AND GROWTH FORECASTS (VALUE)
- 5.1 By Process
- 5.1.1 Reusable Packaging
- 5.1.2 Recyclable Packaging
- 5.1.3 Compostable / Biodegradable Packaging
- 5.1.4 Edible Packaging
- 5.2 By Material Type
- 5.2.1 Paper and Paperboard
- 5.2.2 Plastics
- 5.2.3 Glass
- 5.2.4 Metal (Aluminum, Steel)
- 5.2.5 Plant-based Materials (Bagasse, Mushroom, etc.)
- 5.3 By Packaging Format
- 5.3.1 Rigid
- 5.3.2 Flexible
- 5.4 By Function
- 5.4.1 Primary Packaging
- 5.4.2 Secondary Packaging
- 5.4.3 Tertiary / Transport Packaging
- 5.5 By End User
- 5.5.1 Food and Beverage
- 5.5.2 Pharmaceutical and Healthcare
- 5.5.3 Cosmetics and Personal Care
- 5.5.4 E-commerce and Retail
- 5.5.5 Consumer Electronics
- 5.5.6 Other End User
- 5.6 By Geography
- 5.6.1 North America
- 5.6.1.1 United States
- 5.6.1.2 Canada
- 5.6.1.3 Mexico
- 5.6.2 Europe
- 5.6.2.1 Germany
- 5.6.2.2 United Kingdom
- 5.6.2.3 France
- 5.6.2.4 Italy
- 5.6.2.5 Spain
- 5.6.2.6 Russia
- 5.6.2.7 Rest of Europe
- 5.6.3 Asia-Pacific
- 5.6.3.1 China
- 5.6.3.2 India
- 5.6.3.3 Japan
- 5.6.3.4 South Korea
- 5.6.3.5 Australia and New Zealand
- 5.6.3.6 Rest of Asia-Pacific
- 5.6.4 Middle East and Africa
- 5.6.4.1 Middle East
- 5.6.4.1.1 United Arab Emirates
- 5.6.4.1.2 Saudi Arabia
- 5.6.4.1.3 Turkey
- 5.6.4.1.4 Rest of Middle East
- 5.6.4.2 Africa
- 5.6.4.2.1 South Africa
- 5.6.4.2.2 Nigeria
- 5.6.4.2.3 Egypt
- 5.6.4.2.4 Rest of Africa
- 5.6.4.1 Middle East
- 5.6.5 South America
- 5.6.5.1 Brazil
- 5.6.5.2 Argentina
- 5.6.5.3 Rest of South America
- 5.6.1 North America
6 COMPETITIVE LANDSCAPE
- 6.1 Market Concentration
- 6.2 Strategic Moves
- 6.3 Market Share Analysis
- 6.4 Company Profiles (includes Global level Overview, Market level overview, Core Segments, Financials as available, Strategic Information, Market Rank/Share for key companies, Products and Services, and Recent Developments)
- 6.4.1 Amcor plc
- 6.4.2 Smurfit WestRock Company
- 6.4.3 Tetra Pak International SA
- 6.4.4 Sonoco Products Company
- 6.4.5 Sealed Air Corporation
- 6.4.6 Mondi plc
- 6.4.7 Huhtamaki Oyj
- 6.4.8 BASF SE
- 6.4.9 Ardagh Group SA
- 6.4.10 Ball Corporation
- 6.4.11 Crown Holdings Inc.
- 6.4.12 Genpak LLC
- 6.4.13 International Paper Company
- 6.4.14 Stora Enso Oyj
- 6.4.15 Graphic Packaging Holding Co.
- 6.4.16 Uflex Ltd.
- 6.4.17 Novolex Holdings Inc.
- 6.4.18 Ecovative LLC
7 MARKET OPPORTUNITIES AND FUTURE OUTLOOK
- 7.1 White-space and Unmet-Need Assessment