

|
시장보고서
상품코드
2123663
미국의 디지털 사이니지 시장 : 점유율 분석, 업계 동향과 통계, 성장 예측(2026-2031년)United States Digital Signage - Market Share Analysis, Industry Trends & Statistics, Growth Forecasts (2026 - 2031) |
||||||
 Mordor Intelligence
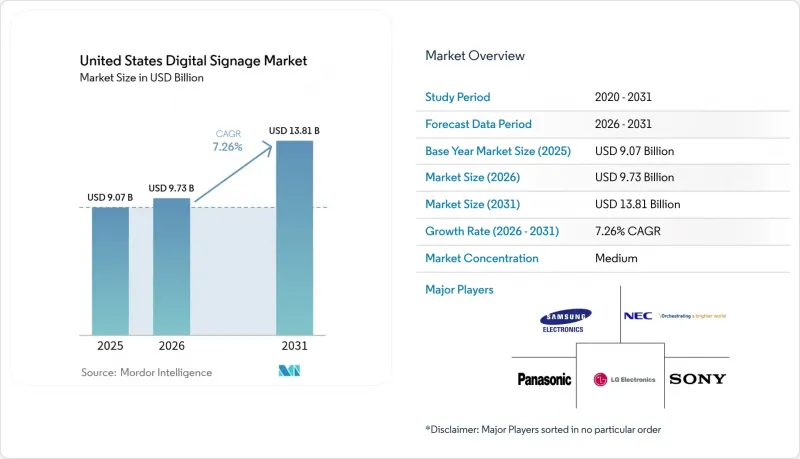
Mordor Intelligence에 의하면, 미국 디지털 사이니지 시장 규모는 2025년에 90억 7,000만 달러로 평가되었고 2026년 97억 3,000만 달러에서 2031년까지 138억 1,000만 달러에 이를 것으로 예측되며, 예측 기간(2026-2031년) CAGR은 7.26%를 나타낼 전망입니다.
본 보고서는 구성 요소(하드웨어, 소프트웨어, 서비스), 디스플레이 기술(LCD/LED, OLED, 프로젝션 등), 화면 크기(32인치 미만, 32인치-52인치, 기타),설치 장소(실내, 실외), 최종 사용자(소매, 교통, 호스피탈리티 및 QSR, 은행, 금융서비스 및 보험(BFSI), 교육, 의료, 기타), 지역(북동부, 중서부, 남부, 서부)별로 분류되어 있습니다.
미국 디지털 사이니지 시장 동향 및 인사이트
미국 내 DOOH 광고비의 급증
DOOH 프로그래매틱 익스체인지 덕분에 광고주는 거의 실시간으로 노출을 거래할 수 있게 되었으며, 기존의 정적인 옥외 미디어에서는 달성할 수 없었던 수준의 측정 가능성과 기여도 분석이 향상되고 있습니다. 조사 대상 소비자의 4분의 3 이상이 DOOH 메시지를 본 후 어떤 행동을 취했다고 응답하여, 이 형식에 대한 광고주의 신뢰를 강화하고 있습니다. 통신 사업자들은 주목을 끄는 인수를 통해 이 분야에 진출하고 있으며, 이는 전국 규모의 광섬유 및 5G 네트워크가 연결 서비스뿐만 아니라 광고를 통해서도 수익을 창출할 수 있음을 시사합니다. AI를 통해 생성된 크리에이티브의 반복을 통해 캠페인 설정 시간이 단축되고, 현지 날씨, 교통 상황 또는 대상 고객의 인구 통계에 맞추어 컨텐츠를 조정할 수 있게 되어 광고 비용 대비 효과(ROAS)가 더욱 향상됩니다. 커넥티드 TV의 광고 구매 역시 유사한 데이터 레이어를 기반으로 하고 있어, 크로스 스크린 노출 빈도 및 도달 범위 관리가 일상화되고 있으며, DOOH는 옴니채널 마케팅의 핵심 축으로서의 입지를 공고히 하고 있습니다.
소매 업계의 디지털 전환 요구
오프라인 매장은 여전히 미국 쇼핑 활동의 대부분을 차지하고 있으며, 체인점들은 추가 구매를 유도하고 전자상거래 프로모션과 연계하기 위해 통로, 진열대, 계산대 주변에 디스플레이를 설치하고 있습니다. 소매업체들은 재고, 고객 관계 관리 도구, 시각적 메시징이 모두 공유된 실시간 데이터 레이크에서 정보를 추출할 수 있도록 매장을 재구축하고 있습니다. 패스트푸드점의 디지털 메뉴판, 대형 할인점의 ‘엔드리스 아일(Endless Aisle)’ 키오스크, 식료품점의 전자 가격표는 모두 ‘맥락에 맞추어 상품을 엄선하고, 정보를 제공하며, 거래를 진행한다’는 동일한 요구를 구체화한 것입니다. 남부 및 서부 지역의 초기 도입 사례에서는 프로모션 대상 SKU의 매출 증가가 입증되었으며, 이를 통해 다른 지역으로의 확장을 위한 예산 승인이 가속화되고 있습니다.
데이터 개인정보 보호 및 옵트인에 관한 규정 준수 과제
여러 주에서 캘리포니아주 소비자 개인정보 보호법(CCPA)에 준하는 법령을 제정하고 있으며, 시설 운영자는 생체 인식 데이터나 행동 데이터를 수집·처리하기 전에 명시적인 동의를 얻어야 할 의무가 있습니다. 현재, 지자체 조례에 따라 디스플레이 밝기가 규제되고 있습니다. 예를 들어, 필라델피아에서는 주간 최대 밝기를 6,500니트, 야간에는 450니트로 제한하고 있으며, 자동 밝기 조절 기능을 의무화하고 있습니다. 이러한 요건으로 인해 통합업체는 안전한 데이터 파이프라인, 감사 로그 및 ‘프라이버시 바이 디자인(Privacy by Design)’ 원칙을 도입해야만 하며, 이로 인해 기술적 및 법적 비용이 증가하고 있습니다. 그 결과, 전국 규모의 광고주는 지역별로 서로 다른 기준의 패치워크에 맞추어 캠페인을 조정해야 하므로 규모의 경제 효과가 저하되고 있습니다.
부문 분석
하드웨어 부문은 매출 시장 점유율의 64.15%를 차지하고 있습니다. 서비스 매출은 연평균 성장률(CAGR) 8.12%를 나타낼 것으로 예측되며, 이는 미국 디지털 사이니지 시장의 가치 창출 구조를 재편하고 있습니다. 2025년 매출의 3분의 2 가까이를 하드웨어가 차지하고 있지만, 구매자들은 일시적인 자본 지출을 예측 가능한 운영 비용으로 전환해 주는 클라우드 기반 컨텐츠 관리, 네트워크 모니터링 및 분석 기능을 점점 더 선호하고 있습니다. 이에 따라 많은 제조업체들이 디스플레이, 미디어 플레이어, 현장 유지보수를 다년 계약의 구독 서비스에 묶어 제공합니다. 전국 체인점의 도입 사례에서 알 수 있듯이, 서비스를 이용하면 긴급 출장 대응이 불필요해지고 수천 대의 스크린에 걸친 컨텐츠 업데이트가 자동화되어 총 소유 비용(TCO)이 절감됩니다.
관리형 서비스에는 크리에이티브 개발, 데이터 통합, 캠페인 최적화도 포함됩니다. 이러한 기능은 사내에 디자인이나 IT 자원을 보유하지 않은 기업, 고객 참여 극대화를 목표로 하는 소매업체, 의료 제공업체, 지자체에게 매력적입니다. AI 도구를 활용해 교통 패턴과 인구 통계를 분석함으로써, 서비스 파트너는 상황에 맞는 재생 목록을 제공하여 캠페인의 관련성을 높일 수 있습니다. 서비스로의 전환이 지속됨에 따라, 미국의 디지털 사이니지 시장은 높은 매출 총이익률을 기록하는 구조로 전환될 것이며, 전국 규모의 지원 네트워크에 자금을 투입할 수 있는 기업 간 통합이 더욱 진행될 것으로 예측됩니다.
LCD 및 직접 뷰형 LED가 여전히 매출의 70.96%를 차지하고 있지만, OLED의 연평균 성장률(CAGR) 9.74%는 프리미엄 영상 성능으로의 명확한 전환을 뒷받침하고 있습니다. 소매 업계의 플래그십 매장, 기업 로비, 고급 호텔 시설에서는 OLED의 거의 무한한 명암비와 초광시야각을 브랜드 차별화의 수단으로 꼽고 있습니다. 서부 지역의 포춘 500대 기업 몇 곳의 캠퍼스에서는 입구 로비의 비디오월을 LED에서 타일 형태로 배치된 OLED 패널로 전환하고 있어, 시장 점유율 확대를 엿볼 수 있습니다.
또한, OLED의 에너지 효율은 기업의 지속가능성 프로그램과도 부합하며, 이는 배출량 보고 제도를 채택하고 있는 관할 구역에서 중요한 요소로 작용하고 있습니다. 플렉서블 기판을 통해 건축가는 디스플레이를 기둥 주위로 휘거나 천장에 부착하는 리본 형태의 디스플레이를 제작할 수 있어, 경질 LCD로는 실현할 수 없었던 디자인의 가능성이 넓어지고 있습니다. 프로젝션은 여전히 강당용 틈새 시장에 머물러 있지만, 전자 종이는 햇빛이 잘 드는 장소나 배터리 구동 설비에 적합합니다. OLED 제조 비용의 지속적인 하락으로 적용 가능한 용도가 확대될 것으로 예상되며, 이 기술은 미국 디지털 사이니지 시장에서 입지를 강화해 나갈 것으로 전망됩니다.
기타 혜택:
- 엑셀 형식 시장 예측(ME) 시트
- 3개월간의 애널리스트 지원
자주 묻는 질문
목차
제1장 서론
제2장 조사 방법
제3장 주요 요약
제4장 시장 구도
제5장 시장 규모와 성장 예측
제6장 경쟁 구도
제7장 시장 기회와 향후 전망
JHS 26.09.07According to Mordor Intelligence, the United States digital signage market size was valued at USD 9.07 billion in 2025 and estimated to grow from USD 9.73 billion in 2026 to reach USD 13.81 billion by 2031, at a CAGR of 7.26% during the forecast period (2026-2031).
This report is Segmented by Component (Hardware, Software and Services), Display Technology (LCD/LED, OLED, Projections, and More), Screen Size (Less Than 32-Inch, 32-Inch - 52-Inch, and More), Installation Location (Indoor, and Outdoor), End User (Retail, Transportation, Hospitality and QSR, BFSI, Education, Healthcare, and More) and Geography (Northeast, Midwest, South, and West).
United States Digital Signage Market Trends and Insights
Surge in United States DOOH Ad-Spend
DOOH programmatic exchanges now allow advertisers to trade impressions almost in real time, elevating measurability and attribution in ways previously unattainable in static outdoor media. More than three-quarters of surveyed consumers reported taking action after seeing a DOOH message, reinforcing advertiser confidence in the format. Telecommunications operators have entered the space through high-profile acquisitions, a signal that nationwide fiber and 5G networks can be monetized through advertising as well as connectivity. AI-generated creative iterations cut campaign setup times and allow content to adjust to local weather, traffic, or audience demographics, which further boosts return on ad spend. Because the same data layers power connected-TV buying, cross-screen frequency and reach management are becoming routine, solidifying DOOH as a critical pillar in omnichannel marketing.
Retail Digital-Transformation Mandates
Brick-and-mortar still captures the majority of U.S. shopping activity, prompting chains to embed displays into aisles, shelves, and checkout zones to encourage incremental purchases and to synchronize with e-commerce promotions. Retailers are re-architecting stores so that inventory, customer-relationship tools, and visual messaging all draw from a shared real-time data lake. Digital menu boards in quick-service restaurants, endless-aisle kiosks in big-box stores, and electronic shelf labels in grocery stores are visible manifestations of the same imperative: curate, inform, and transact in context. Early deployments in the South and West demonstrate revenue uplifts on promoted SKUs, which are accelerating budget approvals for rollouts across other regions.
Data-Privacy and Opt-In Compliance Hurdles
Multiple states have enacted statutes that parallel the California Consumer Privacy Act, compelling venue operators to obtain explicit consent before capturing or processing biometric and behavioral data. Municipal codes now regulate display luminance - for instance, Philadelphia limits maximum brightness to 6,500 nits by day and 450 nits at night while mandating automated dimming controls. Such requirements force integrators to embed secure data pipelines, audit logs, and privacy-by-design principles, adding both engineering and legal costs. National advertisers must subsequently tailor campaigns for a patchwork of local standards, dampening scale economies.
Other drivers and restraints analyzed in the detailed report include:
- Turnkey Signage-as-a-Service Offerings
- Context-Aware and Programmatic Advertising Growth
- High Capex for Large-Format/Interactive Displays
For complete list of drivers and restraints, kindly check the Table Of Contents.
Segment Analysis
The hardware segment accounts for 64.15% of the revenue market share. Services revenue is forecast to grow at an 8.12% CAGR, reshaping value capture inside the United States digital signage market. Although hardware generated almost two-thirds of 2025 revenue, buyers increasingly favor cloud-based content management, network monitoring, and analytics that convert one-time capital expense into predictable operating expense. Many manufacturers, therefore, bundle displays, media players, and field maintenance under multi-year subscriptions. National chain rollouts illustrate that services lower the total cost of ownership by eliminating ad-hoc truck rolls and by automating content updates across thousands of screens.
Managed services also encompass creative development, data integration, and campaign optimization. These capabilities appeal to retailers, healthcare providers, and municipalities lacking in-house design or IT resources yet seeking to maximize engagement. With AI tools detecting traffic patterns and demographics, service partners can deploy context-specific playlists that improve campaign relevance. Continued migration toward services is expected to nudge the United States digital signage market toward higher gross margin profiles, reinforcing consolidation among firms able to fund nationwide support networks.
LCD and direct-view LED continue to account for 70.96% of revenue, yet OLED's 9.74% CAGR underscores a discernible shift toward premium visual performance. Retail flagships, corporate lobbies, and high-end hospitality venues cite OLED's near-infinite contrast and ultra-wide viewing angles as brand differentiation levers. Several Fortune 500 campuses in the West region have migrated entrance lobby video walls from LED to tiled OLED canvases, evidencing wallet share gains.
OLED's energy efficiency also dovetails with corporate sustainability programs, a factor that carries weight in jurisdictions employing emissions reporting. Flexible substrates allow architects to curve displays around pillars or create ceiling-mounted ribbons, unlocking design possibilities unattainable with rigid LCD. Projection remains a niche for auditoriums, while e-paper addresses sun-facing or battery-powered assets. Continued cost declines in OLED manufacturing are anticipated to expand addressable applications, giving the technology a growing footprint within the United States digital signage market.
Complete Report Scope:
- By Component
- Hardware
- LCD/LED Displays
- OLED Displays
- Media Players
- Projection Screens and Projectors
- Other Hardware
- Software
- Services
- Hardware
- By Display Technology
- LCD/LED
- OLED
- Projection
- e-Paper and Reflective
- By Screen Size
- Less than 32-inch
- 32-inch to 52-inch
- Greater than 52-inch
- By Installation Location
- Indoor
- Outdoor
- By End User
- Retail
- Transportation
- Hospitality and QSR
- BFSI
- Education
- Government and Public Institutions
- Healthcare
- Corporate and Commercial Offices
- Entertainment and Sports Venues
- By Geography
- Northeast
- Midwest
- South
- West
List of Companies Covered in this Report:
- Samsung Electronics Co., Ltd.
- LG Display Co., Ltd.
- NEC Corporation
- Stratacache, Inc.
- Daktronics, Inc.
- Sony Group Corporation
- Panasonic Holdings Corporation
- Sharp NEC Display Solutions of America, Inc.
- Christie Digital Systems USA, Inc.
- Barco NV
- Planar Systems, Inc.
- BrightSign LLC
- Four Winds Interactive LLC
- Broadsign International, LLC
- Navori Labs SA
- Cisco Systems, Inc.
- Goodview Electronics Co., Ltd.
- Toshiba America Business Solutions, Inc.
- Peerless-AV (Peerless Industries, Inc.)
- Watchfire Signs, LLC
- Rise Vision, Inc.
Additional Benefits:
- The market estimate (ME) sheet in Excel format
- 3 months of analyst support
TABLE OF CONTENTS
1 INTRODUCTION
- 1.1 Study Assumptions and Market Definition
- 1.2 Scope of the Study
2 RESEARCH METHODOLOGY
3 EXECUTIVE SUMMARY
4 MARKET LANDSCAPE
- 4.1 Market Overview
- 4.2 Market Drivers
- 4.2.1 Surge in United States DOOH ad-spend
- 4.2.2 Retail digital-transformation mandates
- 4.2.3 Turnkey signage-as-a-service offerings
- 4.2.4 Context-aware and programmatic advertising growth
- 4.2.5 Smart-building integration with signage networks
- 4.2.6 Low-power e-paper and reflective displays adoption
- 4.3 Market Restraints
- 4.3.1 Data-privacy and opt-in compliance hurdles
- 4.3.2 High capex for large-format/interactive displays
- 4.3.3 Operational complexity for SME content management
- 4.3.4 Stricter city ordinances on outdoor brightness/curfews
- 4.4 Industry Ecosystem Analysis
- 4.5 Technological Outlook
- 4.6 Porter's Five Forces Analysis
- 4.6.1 Bargaining Power of Suppliers
- 4.6.2 Bargaining Power of Buyers
- 4.6.3 Threat of New Entrants
- 4.6.4 Threat of Substitutes
- 4.6.5 Intensity of Competitive Rivalry
5 MARKET SIZE AND GROWTH FORECASTS (VALUES)
- 5.1 By Component
- 5.1.1 Hardware
- 5.1.1.1 LCD/LED Displays
- 5.1.1.2 OLED Displays
- 5.1.1.3 Media Players
- 5.1.1.4 Projection Screens and Projectors
- 5.1.1.5 Other Hardware
- 5.1.2 Software
- 5.1.3 Services
- 5.1.1 Hardware
- 5.2 By Display Technology
- 5.2.1 LCD/LED
- 5.2.2 OLED
- 5.2.3 Projection
- 5.2.4 e-Paper and Reflective
- 5.3 By Screen Size
- 5.3.1 Less than 32-inch
- 5.3.2 32-inch to 52-inch
- 5.3.3 Greater than 52-inch
- 5.4 By Installation Location
- 5.4.1 Indoor
- 5.4.2 Outdoor
- 5.5 By End User
- 5.5.1 Retail
- 5.5.2 Transportation
- 5.5.3 Hospitality and QSR
- 5.5.4 BFSI
- 5.5.5 Education
- 5.5.6 Government and Public Institutions
- 5.5.7 Healthcare
- 5.5.8 Corporate and Commercial Offices
- 5.5.9 Entertainment and Sports Venues
- 5.6 By Geography
- 5.6.1 Northeast
- 5.6.2 Midwest
- 5.6.3 South
- 5.6.4 West
6 COMPETITIVE LANDSCAPE
- 6.1 Market Concentration
- 6.2 Strategic Moves
- 6.3 Market Share Analysis
- 6.4 Company Profiles (includes Global level Overview, Market level overview, Core Segments, Financials as available, Strategic Information, Market Rank/Share, Products and Services, Recent Developments)
- 6.4.1 Samsung Electronics Co., Ltd.
- 6.4.2 LG Display Co., Ltd.
- 6.4.3 NEC Corporation
- 6.4.4 Stratacache, Inc.
- 6.4.5 Daktronics, Inc.
- 6.4.6 Sony Group Corporation
- 6.4.7 Panasonic Holdings Corporation
- 6.4.8 Sharp NEC Display Solutions of America, Inc.
- 6.4.9 Christie Digital Systems USA, Inc.
- 6.4.10 Barco NV
- 6.4.11 Planar Systems, Inc.
- 6.4.12 BrightSign LLC
- 6.4.13 Four Winds Interactive LLC
- 6.4.14 Broadsign International, LLC
- 6.4.15 Navori Labs SA
- 6.4.16 Cisco Systems, Inc.
- 6.4.17 Goodview Electronics Co., Ltd.
- 6.4.18 Toshiba America Business Solutions, Inc.
- 6.4.19 Peerless-AV (Peerless Industries, Inc.)
- 6.4.20 Watchfire Signs, LLC
- 6.4.21 Rise Vision, Inc.
7 MARKET OPPORTUNITIES AND FUTURE OUTLOOK
- 7.1 White-space and Unmet-need Assessment


