

|
시장보고서
상품코드
2097192
디지털 사이니지 서비스 : 시장 점유율 분석, 업계 동향 및 통계, 성장 예측(2026-2031년)Digital Signage Services - Market Share Analysis, Industry Trends & Statistics, Growth Forecasts (2026 - 2031) |
||||||
 Mordor Intelligence
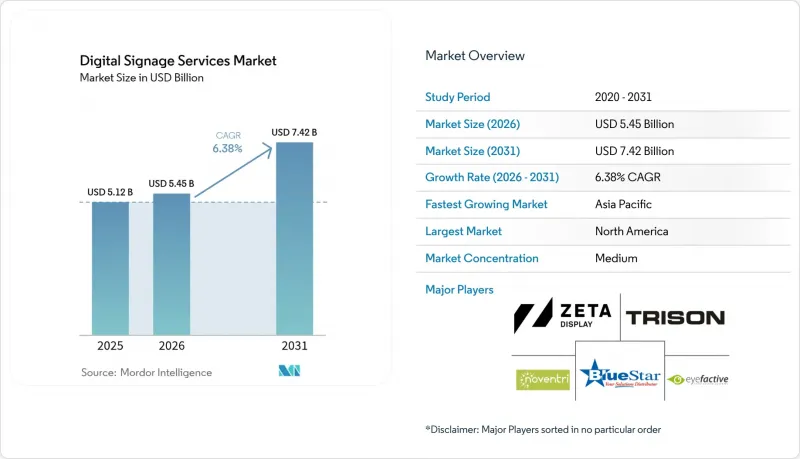
Mordor Intelligence에 의하면, 2026년 디지털 사이니지 서비스 시장 규모는 54억 5,000만 달러에 달할 것으로 추정되고 2025년 51억 2,000만 달러에서 확대해, 2031년에는 74억 2,000만 달러에 이를 것으로 예측됩니다.
2026년부터 2031년까지 연평균 성장률(CAGR) 6.38%로 성장할 것으로 전망됩니다.
본 보고서는 서비스 유형(네트워크 설계·설치, 유지보수·지원, 기타), 도입 형태(On-Premise형 관리, 클라우드/호스팅형 관리), 설치 장소(실내, 실외, 반실외), 최종 사용자 업종(소매·도매, 운송 및 물류, 호스피탈리티 및 레저, 기타) 및 지역별로 분류되어 있습니다. 시장 예측은 금액(달러) 기준으로 제시되어 있습니다.
세계의 디지털 사이니지 서비스 시장 동향 및 인사이트
매장 내 동적 메시징에 대한 소매 업계 수요
소매업체들은 실시간 데이터 피드를 바탕으로 매장 내 커뮤니케이션 체계를 재설계했습니다. 월마트가 2,300개 매장에 디지털 가격 표시 스크린을 도입한 프로젝트는 2억 달러의 자본 투자가 필요한 것으로, 지속적인 컨텐츠 관리와 기기 모니터링이 필요합니다. 세븐일레븐과 같은 편의점 체인은 재고 수준에 맞추어 프로모션을 동기화하는 8,400대 이상의 클라우드 관리형 디스플레이를 운영하고 있습니다. 전문 시스템 통합사업자들은 데이터 아키텍처 및 워크플로우 자동화와 관련된 컨설팅 수익의 혜택을 누리고 있습니다. Kwik Trip과 같은 지역 밀착형 식료품점은 하드웨어 연결 지점을 줄이는 시스템 온 칩(SoC) 디스플레이로 전환함으로써 연간 190만 달러의 비용 절감을 달성했다고 보고했습니다.
교통 허브에서의 승객 정보 제공 현대화
버스, 철도, 공항 운영 사업자들은 고립된 디스플레이를 각 거점에 실시간 운행 데이터를 전송하는 클라우드 호스팅형 통합 네트워크로 대체하고 있습니다. 그레이하운드(Greyhound)는 단일 컨텐츠 플랫폼을 통해 관리되는 Philips(Philips)의 D-Line 및 P-Line 스크린을 활용하여 50개 이상의 도시를 네트워크로 연결했습니다. 일원화된 관리를 통해 템플릿 표준화, 브랜딩, 긴급 경보 전달이 간소화되는 동시에, 설계, 통합, 연중무휴 24시간 지원을 포괄하는 다년 계약이 체결되었습니다. 다국어 컨텐츠, 접근성 준수, 모바일 핸드오프 기능을 통해 서비스 제공업체의 프로젝트 범위가 확대되고 있습니다.
신흥국 내 멀티사이트 네트워크의 높은 TCO
여러 거점에 디지털 사이니지를 도입하려면 막대한 초기 투자 및 지속적인 투자가 필요할 수 있습니다. 비용에는 일반적으로 디스플레이, 미디어 플레이어, 설치, 네트워크 구축, 소프트웨어 라이선스, 유지보수 및 정기적인 하드웨어 교체가 포함됩니다. 신흥 경제국에서는 예산이 빠듯하고 자금 조달 수단도 제한적이기 때문에 이러한 비용을 감당하기가 더 어려울 수 있습니다. 또한, 연결성이나 전원 공급의 신뢰성과 관련된 문제도 운영 비용 증가나 서비스 중단을 초래할 가능성이 있습니다. 대규모 네트워크를 관리하는 기업의 경우, 총 소유 비용(TCO)이 시간이 지남에 따라 급격히 증가할 가능성이 있습니다. 이로 인해 일부 조직에서는 디지털 사이니지를 시범 도입 단계를 넘어 확대하는 데 어려움을 겪게 됩니다. 그 결과, 비용에 민감한 시장에서는 높은 TCO가 여전히 큰 제약 요인으로 작용하고 있습니다.
부문 분석
2025년, 디지털 사이니지 서비스 시장 점유율의 44.10%를 ‘유지보수 및 지원’이 차지했으며, 24시간 진단, 펌웨어 업데이트 및 현장 수리의 중요성이 부각되었습니다. '관리형/클라우드 네트워크 서비스'는 기업들이 원격 모니터링, 컨텐츠 자동 배포 및 분석 대시보드를 선호하는 경향이 있어 연평균 성장률(CAGR) 7.95%로 확대되고 있습니다. 이에 따라 고장 대응형 계약에 기반한 디지털 사이니지 서비스 시장 규모는 예비 부품 풀 및 기기 상태 알림을 결합한 예측형 모델로 전환되고 있습니다.
진행 중인 클라우드 전환으로 인해 수익 구조가 재편되고 있습니다. 제공업체들은 호스팅, API 통합, 성능 보고서에 구독 요금제를 결합함으로써 안정적이고 지속적인 현금 흐름을 창출하고 있습니다. 컨설팅, 컨텐츠 제작, 분석 서비스는 고객이 재고 피드, 로열티 데이터, 시청자 지표를 동적인 재생 목록에 연동할 수 있도록 지원함으로써 이러한 변화에 발맞추고 있습니다. 소매업체들이 위생적인 경험을 추구하는 가운데, 전문적인 비접촉형 상호작용 프로젝트가 추가 서비스로 포함되고 있습니다.
2025년, 의료, 금융, 정부 기관 사용자들이 로컬 서버와 데이터 상주지를 강력히 요구함에 따라 On-Premise형 매니지드 솔루션은 디지털 사이니지 서비스 시장 규모의 58.90%를 차지했습니다. 클라우드/호스팅형 관리형 플랫폼은 사내 IT 지원 체제가 갖춰지지 않은 중소기업, 일원화된 관리를 원하는 다중 거점 브랜드에 힘입어 연평균 성장률(CAGR) 7.52%로 성장하고 있습니다.
컨텐츠를 로컬에 저장하면서 스케줄링 로직을 클라우드에서 가져오는 하이브리드형 토폴로지가 등장하여 가동 시간과 확장성 간의 균형을 맞추고 있습니다. 각 벤더사는 암호화된 미디어 파이프라인, 역할 기반 접근 제어, 자동 패치 적용 프레임워크 등을 통해 차별화를 꾀하고 있습니다. 대역폭 비용이 낮아짐에 따라 데이터 보안에 민감한 업계조차 비개인용 컨텐츠에 대해 클라우드 샌드박스의 시범 운영을 진행하고 있으며, 이는 호스팅 서비스의 향후 시장 점유율 확대를 시사합니다.
지역별 분석
북미는 대규모 소매점 리뉴얼, 전국적인 운송 네트워크, 그리고 클라우드의 조기 도입을 배경으로 2025년 매출의 37.40%를 차지했습니다. 월마트의 2,300개 매장에 걸친 가격 표시 라벨 프로젝트와 세븐일레븐의 8,400개소 디스플레이 시설은 수년에 걸친 매니지드 서비스 계약이 필요한 프로젝트 규모를 여실히 보여줍니다. 인프라 구축을 위한 정부의 경기 부양책에 따라 버스 및 철도 승객 정보 시스템이 갱신되면서 수요를 더욱 견인했습니다.
아시아태평양은 2031년까지 연평균 성장률(CAGR)이 6.95%로 가장 빠르게 성장하고 있는 지역입니다. 도시 지역의 높은 성장률, 경쟁이 치열한 소매 시장, 그리고 중소기업의 디지털화를 지원하는 보조금이 도입을 뒷받침하고 있습니다. 구독형 CMS 솔루션은 자본 지출(CAPEX)을 절감하여 지역 소매업체와 QSR 체인 시장 진입을 촉진하고 있습니다. 중국과 한국의 강력한 패널 제조 생태계 덕분에 공급 주기가 단축되고 하드웨어 가격도 하락하고 있습니다.
유럽은 꾸준히 발전하고 있지만, 규정 준수 관련 부담도 안고 있습니다. 각 기업은 NIS 2 지침을 충족하기 위해 보안 예산을 증액했습니다. 에너지 효율 관련 지침과 도시 차원의 탄소 배출 목표로 인해 LED로의 교체 및 라이프사이클 서비스 계약이 촉진되고 있습니다. 디지털 사이니지 서비스 업계가 복잡한 개인정보 보호 규제를 준수하는 가운데, EU의 회복 기금이 중소기업의 도입 비용을 완화하고 있습니다.
기타 혜택 :
- 엑셀 형식 시장 예측(ME) 시트
- 3개월간의 애널리스트 지원
자주 묻는 질문
목차
제1장 서론
제2장 조사 방법
제3장 주요 요약
제4장 시장 구도
제5장 시장 규모 및 성장 예측
제6장 경쟁 구도
제7장 시장 기회 및 향후 전망
KTH 26.08.05According to Mordor Intelligence, digital signage services market size in 2026 is estimated at USD 5.45 billion, growing from 2025 value of USD 5.12 billion with 2031 projections showing USD 7.42 billion, growing at 6.38% CAGR over 2026-2031.
This report is Segmented by Service Type (Network Design and Installation, Maintenance and Support, and More), Deployment Mode (On-Premise Managed, and Cloud/Hosted Managed), Location (Indoor, Outdoor, and Semi-Outdoor), End-User Vertical (Retail and Wholesale, Transportation and Logistics, Hospitality and Leisure, and More), and Geography. The Market Forecasts are Provided in Terms of Value (USD).
Global Digital Signage Services Market Trends and Insights
Retail demand for dynamic in-store messaging
Retailers redesigned store communication around real-time data feeds. Walmart's roll-out of digital price screens across 2,300 stores represented a USD 200 million capital program that needs ongoing content orchestration and device monitoring. Convenience chains such as 7-Eleven run more than 8,400 cloud-managed displays that synchronize promotions with inventory levels. Specialist integrators benefit from consulting revenues tied to data architecture and workflow automation. Regional grocers like Kwik Trip reported USD 1.9 million in annual savings after shifting to system-on-chip displays that reduce hardware points.
Transportation hubs modernize passenger communication
Bus, rail and airport operators are replacing isolated displays with unified, cloud-hosted networks that push live travel data across sites. Greyhound connected over 50 cities using Philips D-Line and P-Line screens managed through a single content platform. Centralized control simplifies template standards, branding and emergency alerts while creating multi-year service contracts covering design, integration and 24 X 7 support. Multilingual content, accessibility compliance and mobile hand-off features widen project scope for service providers.
High TCO for Multi-Site Networks in Emerging Economies
Deploying digital signage across multiple locations can require substantial upfront and ongoing investment. Costs typically include displays, media players, installation, networking, software licenses, maintenance, and periodic hardware replacement. In emerging economies, these expenses can be harder to absorb because budgets are tighter and access to financing may be limited. Connectivity and power reliability issues can also increase operating costs and service interruptions. For businesses managing large networks, the total cost of ownership can rise quickly over time. This makes it harder for some organizations to scale digital signage beyond pilot deployments. As a result, high TCO remains a major restraint in cost-sensitive markets.
Other drivers and restraints analyzed in the detailed report include:
- Rapid deployment of 4K/8K LED walls
- Subscription-based CMS adoption by SMBs
- Content Refresh Fatigue Causing ROI Concerns for Small Retailers
For complete list of drivers and restraints, kindly check the Table Of Contents.
Segment Analysis
Maintenance and Support accounted for 44.10% of the Digital Signage Services market share in 2025, underscoring the importance of round-the-clock diagnostics, firmware updates and field repairs. Managed / Cloud Network Services is expanding at an 7.95% CAGR as enterprises favor remote monitoring, automated content distribution and analytics dashboards. The Digital Signage Services market size tied to break-fix contracts is therefore evolving toward predictive models that bundle spare-part pools and device health alerts.
Ongoing cloud migration is reshaping revenue mixes. Providers wrap subscription billing around hosting, API integrations and performance reporting, creating stable recurring cash flows. Consulting, content creation and analytics services ride this shift by helping clients connect inventory feeds, loyalty data and audience metrics to dynamic playlists. Specialist touchless-interaction projects add incremental services as retailers aim for hygienic experiences.
On-premise Managed solutions held 58.90% of the Digital Signage Services market size in 2025 as healthcare, finance and government users insisted on local servers and data residency. Cloud / Hosted Managed platforms are growing at 7.52% CAGR, propelled by SMBs that lack in-house IT support and by multi-site brands seeking centralized control.
Hybrid topologies are emerging that store content locally yet draw scheduling logic from the cloud, balancing uptime with scalability. Vendors differentiate through encrypted media pipelines, role-based access and automated patching frameworks. As bandwidth costs fall, even data-sensitive sectors pilot cloud sandboxes for non-personal content, signaling future share gains for hosted services.
Complete Report Scope:
- By Service Type
- Network Design and Installation
- Maintenance and Support
- Content Creation and Consulting
- Managed/Cloud Network Services
- Analytics and Reporting Services
- Other Specialized Services (Interactive and Touchless Integration)
- By Deployment Mode
- On-premise Managed
- Cloud/Hosted Managed
- By Location
- Indoor
- Outdoor
- Semi-Outdoor
- By End-User Vertical
- Retail and Wholesale
- Transportation and Logistics
- Hospitality and Leisure
- Healthcare
- Education
- Corporate and BFSI
- Government and Public Institutions
- Sports and Entertainment Venues
- Others
- By Display Format
- Video Walls
- Kiosks and Self-Service Terminals
- Menu Boards
- Digital Posters and Billboards
- Interactive Touch Screens
- Transparent and Holographic Displays
- By Geography
- North America
- United States
- Canada
- Mexico
- Europe
- Germany
- United Kingdom
- France
- Spain
- Rest of Europe
- South America
- Brazil
- Rest of South America
- Asia-Pacific
- China
- Japan
- India
- South-East Asia
- Rest of Asia-Pacific
- Middle East and Africa
- Middle East
- Gulf Cooperation Council Countries
- Turkey
- Rest of Middle East
- Africa
- South Africa
- Rest of Africa
- Middle East
- North America
Geography Analysis
North America kept 37.40% of 2025 revenue based on large-scale retail make-overs, nationwide transportation networks and early cloud adoption. Walmart's 2,300-store price label project and 7-Eleven's 8,400-display estate underline deal sizes that require multi-year managed-service contracts. Government stimulus for infrastructure upgraded bus and rail passenger information, further fuelling demand.
Asia-Pacific is the fastest-growing region at 6.95% CAGR to 2031. High urban growth, competitive retail markets and supportive SME digitalisation grants drive uptake. Subscription CMS solutions trim capex, fostering entry for local retailers and QSR chains. Strong panel manufacturing ecosystems in China and South Korea shorten supply cycles and lower hardware prices.
Europe advances steadily yet absorbs compliance overheads. Firms increased security budgets to satisfy the NIS 2 Directive. Energy-efficiency directives and city-level carbon targets encourage LED retrofits and life-cycle service agreements. EU recovery funds cushion SME adoption costs even as the Digital Signage Services industry navigates complex privacy regulations.
- STRATACACHE Inc.
- Samsung SDS Co., Ltd.
- LG Electronics Inc.
- Sharp NEC Display Solutions Ltd.
- Scala Enterprise (STRATACACHE)
- Four Winds Interactive LLC
- Mood Media Corp.
- Mvix Digital Signage
- Spectrio LLC
- BrightSign LLC
- Broadsign International Inc.
- Signagelive Ltd.
- Visix Inc.
- NoviSign Digital Signage
- Yodeck (Flipnode LLC)
- Enplug, Inc. (Spectrio)
- Nanonation Inc.
- Trison World
- ZetaDisplay AB
- Panasonic Connect Co., Ltd.
- eyefactive GmbH
Additional Benefits:
- The market estimate (ME) sheet in Excel format
- 3 months of analyst support
TABLE OF CONTENTS
1 INTRODUCTION
- 1.1 Study Assumptions and Market Definition
- 1.2 Scope of the Study
2 RESEARCH METHODOLOGY
3 EXECUTIVE SUMMARY
4 MARKET LANDSCAPE
- 4.1 Market Overview
- 4.2 Market Drivers
- 4.2.1 Retail Demand for Dynamic In-Store Messaging Accelerated by Real-Time Data Integration in North America
- 4.2.2 Transportation Hubs Modernize Passenger Communication Through Centralized Cloud-Managed Networks
- 4.2.3 Rapid Deployment of 4K/8K LED Walls Fueling Long-Term Maintenance Contracts
- 4.2.4 Subscription-Based CMS Adoption by SMBs in Asia-Pacific Reducing Up-Front Capex
- 4.2.5 Healthcare Way-Finding and Patient Engagement Screens Boost Service Outsourcing
- 4.2.6 Energy-Efficiency Mandates Driving LED Retrofits and Lifecycle Service Agreements
- 4.3 Market Restraints
- 4.3.1 High TCO for Multi-Site Networks in Emerging Economies
- 4.3.2 Content Refresh Fatigue Causing ROI Concerns for Small Retailers
- 4.3.3 Cyber-Security and Data-Privacy Compliance Costs in Europe
- 4.3.4 Margin Pressure from Low-Service System Integrator Price-Cutting
- 4.4 Industry Ecosystem Analysis
- 4.5 Porter's Five Forces Analysis
- 4.5.1 Threat of New Entrants
- 4.5.2 Bargaining Power of Buyers/Consumers
- 4.5.3 Bargaining Power of Suppliers
- 4.5.4 Threat of Substitute Products
- 4.5.5 Intensity of Competitive Rivalry
5 MARKET SIZE AND GROWTH FORECASTS (VALUES)
- 5.1 By Service Type
- 5.1.1 Network Design and Installation
- 5.1.2 Maintenance and Support
- 5.1.3 Content Creation and Consulting
- 5.1.4 Managed/Cloud Network Services
- 5.1.5 Analytics and Reporting Services
- 5.1.6 Other Specialized Services (Interactive and Touchless Integration)
- 5.2 By Deployment Mode
- 5.2.1 On-premise Managed
- 5.2.2 Cloud/Hosted Managed
- 5.3 By Location
- 5.3.1 Indoor
- 5.3.2 Outdoor
- 5.3.3 Semi-Outdoor
- 5.4 By End-User Vertical
- 5.4.1 Retail and Wholesale
- 5.4.2 Transportation and Logistics
- 5.4.3 Hospitality and Leisure
- 5.4.4 Healthcare
- 5.4.5 Education
- 5.4.6 Corporate and BFSI
- 5.4.7 Government and Public Institutions
- 5.4.8 Sports and Entertainment Venues
- 5.4.9 Others
- 5.5 By Display Format
- 5.5.1 Video Walls
- 5.5.2 Kiosks and Self-Service Terminals
- 5.5.3 Menu Boards
- 5.5.4 Digital Posters and Billboards
- 5.5.5 Interactive Touch Screens
- 5.5.6 Transparent and Holographic Displays
- 5.6 By Geography
- 5.6.1 North America
- 5.6.1.1 United States
- 5.6.1.2 Canada
- 5.6.1.3 Mexico
- 5.6.2 Europe
- 5.6.2.1 Germany
- 5.6.2.2 United Kingdom
- 5.6.2.3 France
- 5.6.2.4 Spain
- 5.6.2.5 Rest of Europe
- 5.6.3 South America
- 5.6.3.1 Brazil
- 5.6.3.2 Rest of South America
- 5.6.4 Asia-Pacific
- 5.6.4.1 China
- 5.6.4.2 Japan
- 5.6.4.3 India
- 5.6.4.4 South-East Asia
- 5.6.4.5 Rest of Asia-Pacific
- 5.6.5 Middle East and Africa
- 5.6.5.1 Middle East
- 5.6.5.1.1 Gulf Cooperation Council Countries
- 5.6.5.1.2 Turkey
- 5.6.5.1.3 Rest of Middle East
- 5.6.5.2 Africa
- 5.6.5.2.1 South Africa
- 5.6.5.2.2 Rest of Africa
- 5.6.5.1 Middle East
- 5.6.1 North America
6 COMPETITIVE LANDSCAPE
- 6.1 Market Concentration
- 6.2 Strategic Moves
- 6.3 Market Share Analysis
- 6.4 Company Profiles {(includes Global level Overview, Market level overview, Core Segments, Financials as available, Strategic Information, Market Rank/Share for key companies, Products and Services, and Recent Developments)}
- 6.4.1 STRATACACHE Inc.
- 6.4.2 Samsung SDS Co., Ltd.
- 6.4.3 LG Electronics Inc.
- 6.4.4 Sharp NEC Display Solutions Ltd.
- 6.4.5 Scala Enterprise (STRATACACHE)
- 6.4.6 Four Winds Interactive LLC
- 6.4.7 Mood Media Corp.
- 6.4.8 Mvix Digital Signage
- 6.4.9 Spectrio LLC
- 6.4.10 BrightSign LLC
- 6.4.11 Broadsign International Inc.
- 6.4.12 Signagelive Ltd.
- 6.4.13 Visix Inc.
- 6.4.14 NoviSign Digital Signage
- 6.4.15 Yodeck (Flipnode LLC)
- 6.4.16 Enplug, Inc. (Spectrio)
- 6.4.17 Nanonation Inc.
- 6.4.18 Trison World
- 6.4.19 ZetaDisplay AB
- 6.4.20 Panasonic Connect Co., Ltd.
- 6.4.21 eyefactive GmbH
7 MARKET OPPORTUNITIES AND FUTURE OUTLOOK
- 7.1 White-Space and Unmet-Need Assessment


