|
시장보고서
상품코드
2123979
특수 PACS 시장 : 시장 점유율 분석, 업계 동향 및 통계, 성장 예측(2026-2031년)Specialty PACS - Market Share Analysis, Industry Trends & Statistics, Growth Forecasts (2026 - 2031) |
||||||
 Mordor Intelligence
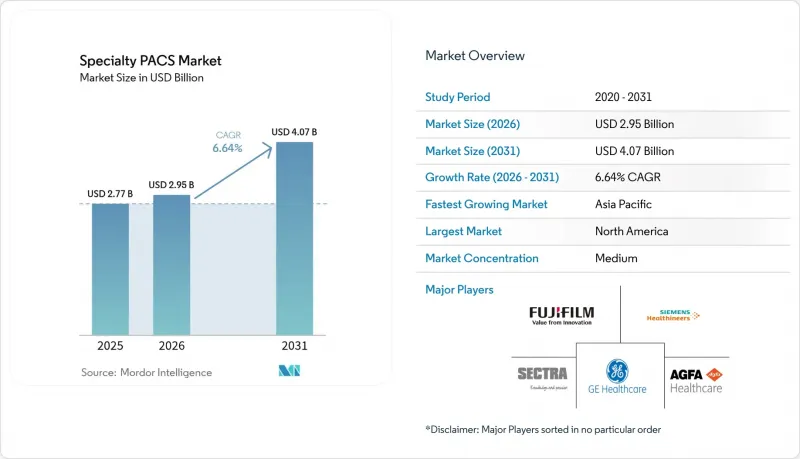
Mordor Intelligence에 의하면, 특수 PACS(의료영상저장전송시스템) 시장 규모는 2025년에 27억 7,000만 달러로 평가되었고, 2026년 29억 5,000만 달러에서 2031년까지 40억 7,000만 달러에 이를 것으로 예측되며, 예측 기간(2026-2031년) CAGR은 6.64%를 나타낼 전망입니다.
본 보고서는 전문 분야별(방사선과용 PACS, 순환기과용 PACS, 병리과용 PACS, 안과용 PACS 등), 구성 요소별(소프트웨어, 서비스, 하드웨어), 배포 모델별(온프레미스형 PACS, 웹/클라우드 기반 특수 PACS, 하이브리드 PACS), 최종 사용자별(병원, 영상진단센터 등), 지역별(북미, 유럽, 아시아태평양 등)로 분류되어 있습니다.
세계의 특수 PACS 시장 동향 및 인사이트
영상진단 장비의 이용 확대
2025년에는 첨단 광자 계수 CT 및 디지털 SPECT가 상용화되기 시작하면서, 영상 처리 능력이 향상됨과 동시에 모달리티의 다양성이 확대되었습니다. 팬데믹 이후의 환경에서도 진료 현장에서의 초음파 검사 도입률은 여전히 높으며, 의료 기관은 방사선과 검사실과 마찬가지로 모바일 기기에서 전송된 데이터를 손쉽게 관리할 수 있는 특수 PACS 플랫폼을 선정해야 하는 상황에 직면해 있습니다. 관상동맥 CT 혈관조영술의 보험 환급액이 두 자릿수 증가세를 보임에 따라 스캔 건수가 더욱 증가하고 있으며, 벤더 중립 아카이브(NVA)에 대한 수요가 높아지고 있습니다. 이러한 동향에 따라, 모달리티를 넘나들며 분류 및 보고서 작성을 자동화하는 AI 기반 워크플로우 도구의 중요성이 커지고 있으며, 의료기관이 기존 계약을 연장하는 대신 특수 PACS 시장의 인프라를 현대화하고 있는 이유가 부각되고 있습니다.
만성 질환 부담 증가
세계 당뇨병 유병률의 상승과 고령화는 안과 및 순환기과 영상 진단 워크플로우를 변화시키고 있습니다. AI 모델은 현재 당뇨병성 망막병증 선별 검사에서 100%의 민감도를 달성하고 있으며, 이에 따라 안과 클리닉은 특수 PACS 시장 환경 내에 경과 추적 기능을 통합하고 있습니다. 또한, 심초음파 검사에서도 정확한 추세 분석을 수행하기 위해 통합된 순환기 정보 시스템이 필요한 반면, 종양학 진료에서는 정밀 의학(Precision Medicine) 프로토콜을 준수하기 위해 전문 분야를 아우르는 영상 통합이 요구되고 있습니다.
데이터 보안 및 개인정보 보호에 대한 우려
Rhysida와 같은 랜섬웨어 그룹은 영상 아카이브를 표적으로 삼고 있으며, 펜실베이니아주에서 발생한 한 침해 사건에서는 합의금으로 6,500만 달러가 지급되는 등 PACS의 취약성에 대한 관심이 집중되고 있습니다. 향후 시행될 미국의 사이버 보안 의무 요건으로 인해 특수 PACS 시장의 긴급 업그레이드가 촉진될 전망이지만, 지루하게 이어지는 보안 평가로 인해 가동 시작이 지연되고 있습니다. 각 벤더사는 현재 제로 트러스트 아키텍처와 종단 간암호화를 내세우고 있지만, 이를 익히기 어렵다는 점이 임상의들의 도입을 지연시킬 가능성이 있습니다.
부문 분석
2025년 기준, 특수 PACS 시장 점유율의 45.20%를 방사선과가 차지했으며, 이는 급성기 의료 및 외래 진료에서 영상 진단의 핵심적인 위치를 뒷받침하는 것입니다. 기업의 영상 진단 예산에서는 대량의 영상을 다루는 방사선과 워크플로우가 우선시되고 있기 때문에 도입은 견조한 추세를 보이고 있습니다. 대조적으로, 안과 분야의 2031년까지 연평균 성장률(CAGR)은 8.55%로 예측되며, 당뇨성 황반부종을 97%의 정확도로 검출하는 AI를 활용한 망막 선별 검사 프로그램이 주도적인 역할을 하고 있습니다. 공공 보건 기관이 대규모 선별 검사를 뒷받침하고, 기존 부서별 시스템에는 부족했던 경과 비교 기능이 요구됨에 따라 안과용 전문 PACS 시장 규모는 확대될 것으로 예측됩니다. 순환기과용 PACS는 심초음파 검사 보고서 작성 시스템과의 긴밀한 연계를 통해 성장을 이어가고 있는 반면, 디지털 병리학은 유럽에서 원격 병리 진단이 의무화됨에 따라 탄력을 받고 있습니다.
신경학 및 여성 의학과 같은 2차 전문 분야에서는 뇌졸중 감지 및 유방 밀도 평가를 위한 AI 모듈이 통합되어 3차 의료기관 이외의 곳에서도 도입이 촉진되고 있습니다. 정형외과 및 피부과 분야는 스포츠 의학 수요와 AI를 활용한 병변 분석의 혜택을 받고 있지만, 상호 운용성 격차로 인해 조달 주기가 장기화되는 과제에 직면해 있습니다. 특수 PACS 시장에서는 공통된 엔터프라이즈 기반을 공유하면서도 각 전문 분야의 미세한 차이에 대응할 수 있는 구성 가능한 워크플로우를 제공하는 벤더가 궁극적으로 우위를 점할 것입니다.
2025년 특수 PACS 시장 규모에서 소프트웨어는 58.70%의 점유율을 유지했으며, 이는 병원 네트워크 전체에 라이선스가 정착되어 있음을 반영합니다. 그러나 서비스(호스팅,마이그레이션, 사이버 보안, AI 모델 관리) 부문은 병원이 성과 기반 계약으로 전환하고 있는 만큼, 소프트웨어를 상회하는 8.18%의 연평균 성장률(CAGR)이 예상됩니다. CIO(최고정보책임자)들은 인력 부족을 보완하고 새로운 기능을 신속하게 도입하기 위해 매니지드 클라우드 PACS를 선택하는 경향이 강해지고 있습니다. 현재 특수 PACS 시장에서는 정기적인 버전 업그레이드에 의존하기보다는 24시간 365일 모니터링과 지속적인 성능 튜닝을 결합한 솔루션을 제공하는 벤더가 높은 평가를 받고 있습니다.
데이터센터 통합 및 가상화로 인해 워크스테이션 교체 대수가 감소하고 있어, 하드웨어 매출은 정체 상태에 있습니다. 하지만 지연 시간에 민감한 이용 사례에서는 고해상도 진단용 디스플레이와 로컬 캐시 어플라이언스가 여전히 필수적입니다. 영상 진단의 처리량에 연동된 구독 모델은 예산의 예측 가능성을 높이고, 벤더의 인센티브와 의료기관의 업무 효율화 목표를 일치시키는 역할을 하고 있습니다.
지역별 분석
북미는 성숙한 환급 제도와 최첨단 클라우드 전략에 힘입어 2025년 특수 PACS 시장 점유율의 43.85%를 차지했습니다. CMS(미국 의료보험서비스센터)에 의한 원격의료의 확대와 FDA(미국 식품의약국)의 AI 프레임워크는 제품의 신속한 개선을 가능하게 하는 유리한 환경을 조성하고 있습니다. 캐논 메디컬이 3,400만 달러를 투자해 클리블랜드에 건설한 시설은 이 지역이 연구개발 투자를 강력하게 유치하고 있음을 뒷받침합니다. 그러나 사이버 보안 규제가 강화됨에 따라 규정 준수 관련 비용이 증가하고, 도입 시 테스트 주기가 장기화되고 있습니다.
아시아태평양은 모든 지역 중 가장 높은 연평균 성장률(CAGR) 9.15%를 나타낼 것으로 예측됩니다. 싱가포르는 AI 혁신에 2억 달러를 배정하고 있는 반면, 한국의 1조 2,000억 원(8억 3,000만 달러) 규모의 스마트 병원 프로그램은 특수 PACS 시장의 확산을 가속화하고 있습니다. 클라우드 PACS 도입으로 IT 인력 부족이 완화됨에 따라, 사모펀드는 롤업 전략의 일환으로 지역 영상진단 체인을 표적으로 삼고 있습니다. 의료 기술 분야의 AI 시장은 2028년까지 2억 5,000만 달러에 달할 것으로 예측되며, 이에 따라 영상진단 IT에 대한 수요가 더욱 높아질 것으로 전망됩니다.
유럽에서는 GDPR(EU 개인정보보호규정)을 준수하는 클라우드 서비스와 국경을 초월한 디지털 헬스 프로젝트에 힘입어 꾸준한 보급이 진행되고 있습니다. Philips는 EU 의료 서비스 제공업체에 서비스를 제공하기 위해 AWS 기반의 엔터프라이즈 이미징 사업을 확대하고, 데이터 프라이버시를 보호하면서 자동화된 AI 보고 기능을 통합했습니다. 그러나 국가마다 다른 조달 규제로 인해 판매 주기가 길어지고 있어, 벤더들은 여러 관할 구역에 걸친 규제 대응 팀을 유지해야 하는 상황에 처해 있습니다.
기타 혜택 :
- 엑셀 형식 시장 예측(ME) 시트
- 3개월간의 애널리스트 지원
자주 묻는 질문
목차
제1장 서론
제2장 조사 방법
제3장 주요 요약
제4장 시장 구도
제5장 시장 규모 및 성장 예측
제6장 경쟁 구도
제7장 시장 기회 및 향후 전망
AJY 26.09.11According to Mordor Intelligence, the specialty PACS market size was valued at USD 2.77 billion in 2025 and estimated to grow from USD 2.95 billion in 2026 to reach USD 4.07 billion by 2031, at a CAGR of 6.64% during the forecast period (2026-2031).

This report is Segmented by Specialty (Radiology PACS, Cardiology PACS, Pathology PACS, Ophthalmology PACS, and More), by Component (Software, Services, Hardware), by Deployment Model (On-Premise PACS, Web/Cloud-based Specialty PACS, Hybrid PACS), by End User (Hospitals, Diagnostic Imaging Centers, and More), by Geography (North America, Europe, Asia-Pacific, and More).
Global Specialty PACS Market Trends and Insights
Growing Use of Imaging Devices
Advanced photon-counting CT and digital SPECT entered commercial deployment in 2025, intensifying imaging throughput and expanding modality diversity. Point-of-care ultrasound adoption remains high in post-pandemic environments, compelling providers to select Specialty PACS market platforms that manage data from mobile devices as effortlessly as radiology suites. Double-digit reimbursement growth for coronary CT angiography further increases scan volumes, magnifying the need for vendor-neutral archives. These dynamics elevate AI-driven workflow tools that automate triage and reporting across modalities, underscoring why health systems are modernizing Specialty PACS market infrastructure rather than extending legacy contracts.
Increasing Burden of Chronic Diseases
Global diabetes prevalence and aging populations are reshaping ophthalmology and cardiology imaging workflows. AI models now deliver 100% sensitivity in diabetic retinopathy screening, prompting eye clinics to embed longitudinal comparison features within Specialty PACS market environments. Echocardiography studies also require integrated cardiovascular information systems for precise trend analysis, while oncology practices demand cross-specialty image aggregation to align with precision medicine protocols.
Data Security & Privacy Concerns
Ransomware groups such as Rhysida are targeting imaging archives, with one Pennsylvania breach costing USD 65 million in settlements and drawing attention to PACS vulnerabilities. Upcoming mandatory U.S. cybersecurity requirements will likely drive urgent Specialty PACS market upgrades, yet lengthy security assessments delay go-lives. Vendors now tout zero-trust architectures and end-to-end encryption, but steep learning curves can slow clinician adoption.
Other drivers and restraints analyzed in the detailed report include:
- Enterprise-wide Imaging Adoption
- AI-ready Architecture Demand
- High Capex & Migration Costs
For complete list of drivers and restraints, kindly check the Table Of Contents.
Segment Analysis
Radiology accounted for 45.20% of Specialty PACS market share in 2025, a testament to its status as the imaging backbone for acute and outpatient care. Adoption remains steady as enterprise imaging budgets prioritize large-volume radiology workflows. In contrast, Ophthalmology posted an 8.55% CAGR outlook to 2031, spurred by AI-enabled retinal screening programs that flag diabetic macular edema with 97% accuracy. The Specialty PACS market size for ophthalmology is projected to widen as public health agencies sponsor mass screening, demanding longitudinal comparison features absent from older departmental systems. Cardiology PACS growth continues via tight integration with echocardiography reporting suites, whereas digital pathology gains momentum through telepathology mandates in Europe.
Second-tier specialties such as neurology and women's health are integrating AI modules for stroke detection and breast density assessment, catalyzing adoption beyond tertiary centers. Orthopedic and dermatology segments benefit from sports medicine demand and AI lesion analysis but contend with interoperability gaps that lengthen procurement cycles. The Specialty PACS market ultimately favors vendors offering configurable workflows that honor specialty nuances while sharing a common enterprise backbone.
Software retained 58.70% share of the Specialty PACS market size in 2025, reflecting entrenched license footprints across hospital networks. However, services-hosting, migration, cybersecurity, and AI model management-are forecast for an 8.18% CAGR, outpacing software due to hospitals' shift toward outcome-based contracts. Increasingly, CIOs choose managed cloud PACS to offset talent shortages and rapidly deploy new features. The Specialty PACS market now rewards vendors that bundle 24/7 monitoring and continuous performance tuning rather than relying on periodic version upgrades.
Hardware revenues plateau as data center consolidation and virtualization reduce workstation refresh volumes. Nevertheless, high-resolution diagnostic displays and local caching appliances remain essential for latency-sensitive use cases. Subscription models linked to imaging volume provide budget predictability, aligning vendor incentives with provider operational efficiency goals.
Complete Report Scope:
- By Specialty
- Radiology PACS
- Cardiology PACS
- Pathology PACS
- Ophthalmology PACS
- Orthopedic PACS
- Oncology PACS
- Dermatology PACS
- Neurology PACS
- Women's Health PACS
- Other Specialty PACS
- By Component
- Software
- Services
- Hardware
- By Deployment Model
- On-premise PACS
- Web/Cloud-based Specialty PACS
- Hybrid PACS
- By End User
- Hospitals
- Diagnostic Imaging Centers
- Ambulatory Surgical Centers & Clinics
- Research & Academic Institutes
- Others
- By Geography
- North America
- United States
- Canada
- Mexico
- Europe
- Germany
- United Kingdom
- France
- Italy
- Spain
- Rest of Europe
- Asia-Pacific
- China
- Japan
- India
- Australia
- South Korea
- Rest of Asia-Pacific
- Middle East and Africa
- GCC
- South Africa
- Rest of Middle East and Africa
- South America
- Brazil
- Argentina
- Rest of South America
- North America
Geography Analysis
North America held 43.85% of Specialty PACS market share in 2025, supported by mature reimbursement schemes and leading-edge cloud strategies. CMS telehealth expansions and an FDA AI framework foster a permissive environment for rapid product iteration. Canon Medical's USD 34 million Cleveland facility underscores the region's pull for R&D investment. Heightened cybersecurity mandates, however, raise compliance expenses and lengthen implementation testing cycles.
Asia-Pacific is forecast to post a 9.15% CAGR, the fastest among all regions. Singapore earmarked USD 200 million for AI innovation, while South Korea's 1.2 trillion won (USD 830 million) smart-hospital program accelerates Specialty PACS market penetration.Cloud PACS adoption mitigates IT staffing gaps, and private equity funds target regional imaging chains for roll-up strategies. The AI in medtech segment is projected to reach USD 250 million by 2028, further bolstering imaging IT demand.
Europe enjoys steady uptake driven by GDPR-aligned cloud services and cross-border digital-health projects. Philips expanded enterprise imaging on AWS to service EU providers, integrating automated AI reporting while safeguarding data privacy. Nevertheless, divergent national procurement rules lengthen sales cycles, compelling vendors to maintain multi-jurisdiction regulatory teams.
- Agfa HealthCare
- Canon
- FUJIFILM
- Merative L.P.
- Mckesson
- Novarad
- Koninklijke Philips
- Sectra
- Siemens Healthineers
- Topcon
- GE Healthcare
- Carestream Health
- Change Healthcare (Optum, Inc.)
- Intelerad Medical Systems
- RamSoft
- Visage Imaging
- Infinitt Healthcare
- Konica Minolta Healthcare
- Cerner Corporation (Orcale Health)
- Hyland Healthcare
- Mach7 Technologies
Additional Benefits:
- The market estimate (ME) sheet in Excel format
- 3 months of analyst support
TABLE OF CONTENTS
1 Introduction
- 1.1 Study Assumptions & Market Definition
- 1.2 Scope of the Study
2 Research Methodology
3 Executive Summary
4 Market Landscape
- 4.1 Market Overview
- 4.2 Market Drivers
- 4.2.1 Growing use of imaging devices
- 4.2.2 Increasing burden of chronic diseases
- 4.2.3 Enterprise-wide imaging adoption
- 4.2.4 AI-ready architecture demand
- 4.2.5 Reimbursement-linked image analytics
- 4.2.6 Decentralized trials & tele-imaging
- 4.3 Market Restraints
- 4.3.1 Data security & privacy concerns
- 4.3.2 High capex & migration costs
- 4.3.3 Vendor lock-in risk
- 4.3.4 Cloud/AI skills gap
- 4.4 Value / Supply-Chain Analysis
- 4.5 Regulatory Landscape
- 4.6 Technological Outlook
- 4.7 Porter's Five Forces Analysis
- 4.7.1 Threat of New Entrants
- 4.7.2 Bargaining Power of Buyers
- 4.7.3 Bargaining Power of Suppliers
- 4.7.4 Threat of Substitutes
- 4.7.5 Intensity of Competitive Rivalry
5 Market Size & Growth Forecasts (Value)
- 5.1 By Specialty
- 5.1.1 Radiology PACS
- 5.1.2 Cardiology PACS
- 5.1.3 Pathology PACS
- 5.1.4 Ophthalmology PACS
- 5.1.5 Orthopedic PACS
- 5.1.6 Oncology PACS
- 5.1.7 Dermatology PACS
- 5.1.8 Neurology PACS
- 5.1.9 Women's Health PACS
- 5.1.10 Other Specialty PACS
- 5.2 By Component
- 5.2.1 Software
- 5.2.2 Services
- 5.2.3 Hardware
- 5.3 By Deployment Model
- 5.3.1 On-premise PACS
- 5.3.2 Web/Cloud-based Specialty PACS
- 5.3.3 Hybrid PACS
- 5.4 By End User
- 5.4.1 Hospitals
- 5.4.2 Diagnostic Imaging Centers
- 5.4.3 Ambulatory Surgical Centers & Clinics
- 5.4.4 Research & Academic Institutes
- 5.4.5 Others
- 5.5 By Geography
- 5.5.1 North America
- 5.5.1.1 United States
- 5.5.1.2 Canada
- 5.5.1.3 Mexico
- 5.5.2 Europe
- 5.5.2.1 Germany
- 5.5.2.2 United Kingdom
- 5.5.2.3 France
- 5.5.2.4 Italy
- 5.5.2.5 Spain
- 5.5.2.6 Rest of Europe
- 5.5.3 Asia-Pacific
- 5.5.3.1 China
- 5.5.3.2 Japan
- 5.5.3.3 India
- 5.5.3.4 Australia
- 5.5.3.5 South Korea
- 5.5.3.6 Rest of Asia-Pacific
- 5.5.4 Middle East and Africa
- 5.5.4.1 GCC
- 5.5.4.2 South Africa
- 5.5.4.3 Rest of Middle East and Africa
- 5.5.5 South America
- 5.5.5.1 Brazil
- 5.5.5.2 Argentina
- 5.5.5.3 Rest of South America
- 5.5.1 North America
6 Competitive Landscape
- 6.1 Market Concentration
- 6.2 Market Share Analysis
- 6.3 Company Profiles (includes Global level Overview, Market level overview, Core Segments, Financials as available, Strategic Information, Market Rank/Share for key companies, Products & Services, and Recent Developments)
- 6.3.1 Agfa HealthCare
- 6.3.2 Canon Medical Systems
- 6.3.3 Fujifilm Holdings Corporation
- 6.3.4 Merative L.P.
- 6.3.5 McKesson Corporation
- 6.3.6 Novarad
- 6.3.7 Philips Healthcare
- 6.3.8 Sectra AB
- 6.3.9 Siemens Healthineers
- 6.3.10 Topcon Corporation
- 6.3.11 GE Healthcare
- 6.3.12 Carestream Health
- 6.3.13 Change Healthcare (Optum, Inc.)
- 6.3.14 Intelerad Medical Systems
- 6.3.15 RamSoft
- 6.3.16 Visage Imaging
- 6.3.17 Infinitt Healthcare
- 6.3.18 Konica Minolta Healthcare
- 6.3.19 Cerner Corporation (Orcale Health)
- 6.3.20 Hyland Healthcare
- 6.3.21 Mach7 Technologies
7 Market Opportunities & Future Outlook
- 7.1 White-space & Unmet-Need Assessment