
|
시장보고서
상품코드
2124147
HR 애널리틱스 시장 : 시장 점유율 분석, 업계 동향 및 통계, 성장 예측(2026-2031년)HR Analytics - Market Share Analysis, Industry Trends & Statistics, Growth Forecasts (2026 - 2031) |
||||||
 Mordor Intelligence
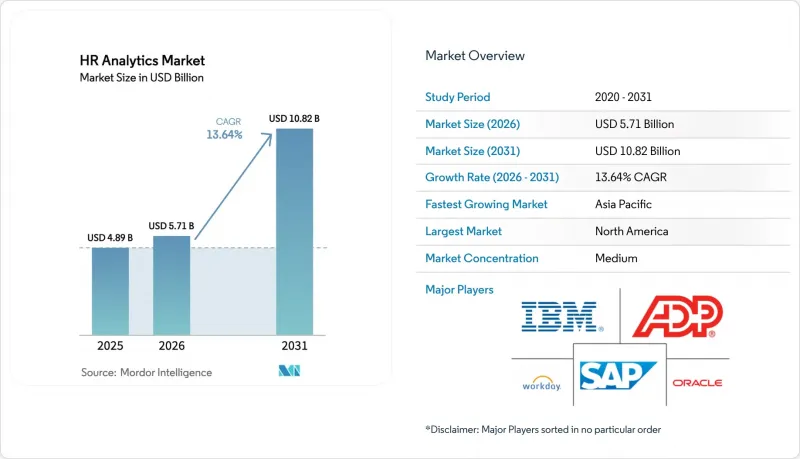
Mordor Intelligence에 의하면, HR 애널리틱스 시장 규모는 2025년에 48억 9,000만 달러로 평가되었고, 2026년에 57억 1,000만 달러로 추정되고, 2031년까지 108억 2,000만 달러에 이를 것으로 예측되며, 2026-2031년 CAGR 13.64%를 기록할 전망입니다.
본 보고서는 구성 요소별(솔루션 및 서비스), 도입 형태별(온프레미스 및 클라우드), 조직 규모별(대기업 및 중소기업), 용도별(인재 채용·온보딩, 인력 계획·최적화 등), 최종 사용자 산업별(IT 및 통신, 소매 및 소비재, 제조 등), 지역별로 분류되어 있습니다. 시장 전망은 금액(달러) 단위로 표시되어 있습니다.
세계의 HR 애널리틱스 시장 동향 및 인사이트
클라우드 기반 HR 애널리틱스 도입 급증
HR 애널리틱스를 클라우드로 전환함으로써, 과거에는 초대형 기업으로 도입이 제한되었던 초기 하드웨어 및 라이선스 비용이 해소되었습니다. ISG가 1,200개 조직을 대상으로 실시한 조사에 따르면, 2025년 말까지 69%의 조직이 적어도 하나의 HR 모듈을 SaaS(Software-as-a-Service) 방식으로 운영할 것으로 나타났으며, 이는 2023년의 52%에서 크게 증가한 수치입니다. Oracle은 예산에 민감한 구매자들 사이에서 모듈식이며 직원 1인당 과금 체계가 호응을 얻음에 따라, 2025 회계연도 동안 Fusion Cloud HCM 고객을 1,400개사 늘렸습니다. 워크데이는 2025년에 3차례의 주요 릴리스를 제공했는데, 이는 기존의 온프레미스형 도입에서 연 1회 업데이트가 일반적이었던 것과는 대조적이며, 멀티테넌트 설계가 가져다주는 기능 제공 속도의 이점을 부각시켰습니다. 그러나 이 같은 아키텍처에서는 데이터가 하이퍼스케일 데이터센터를 경유하기 때문에 EU의 국경 간 규제와 충돌할 가능성이 있습니다. 이러한 모순은 직원 데이터 처리와 관련하여 아마존이 GDPR(EU 개인정보보호규정)에 따라 7억 4,600만 유로(8억 4,300만 달러)의 벌금을 부과받은 사례에서 뚜렷이 드러났습니다.
이직률 감소와 인건비 최적화가 필요
2025년, 미국의 고용주들은 자발적 이직으로 인해 1조 달러의 비용을 부담했으며, 각 기업은 퇴사 몇 달 전에 이직 위험을 경고하는 예측 모델에 의존하게 되었습니다. IBM의 ‘왓슨 애널리틱스(Watson Analytics)’는 근속 연수, 승진 이력, 그리고 외부 노동 시장의 신호를 종합적으로 분석함으로써 1년 이내에 퇴사할 직원을 95%의 정확도로 예측하는 데 성공했습니다. 이러한 분석 결과를 바탕으로, 대상자를 선별해 근속 보너스를 지급하거나 근무 패턴을 조정한 병원에서는 정규 간호사의 이직률을 22% 감소시켰으며, 이직 1건을 방지할 때마다 평균 5만 2,100달러의 비용을 절감했습니다. 또한, 급여 압축 대시보드를 통해 신입 사원이 오랫동안 근무해 온 동료보다 더 높은 급여를 받고 있는 사례도 밝혀졌습니다. 이는 ‘사일런트 퀴팅’의 원인이 되므로, 기업들은 임기 도중 급여 재검토를 통해 대응하고 있습니다. CHRO(최고인사책임자)가 이러한 비용 절감 효과를 정량화함에 따라, 재무 부서는 인재 분석을 재량적인 도구가 아닌 비용 절감 수단으로 인식하기 시작했습니다.
HR 데이터 사이언스 인재 부족
피플 애널리틱스 직무에는 SQL, Python, 통계학, 그리고 인사 정책에 대한 지식이 융합되어 있으며, 이러한 기술 세트를 모두 갖춘 인재는 전 세계 노동 시장에서 여전히 희소합니다. LinkedIn의 ‘2025년 신흥 직무 보고서’에 따르면, 피플 애널리틱스 전문가가 성장률 기준 7위를 기록했으나, 해당 직위의 중앙값은 90일 이상 공석으로 남아 있었으며, 일반적인 인사 분석가 직책에 비해 25-35% 높은 급여가 제시되었습니다. 딜로이트의 조사에 따르면, 많은 중견 기업들은 예측 모델을 구축할 인력이 부족하여 기술적 대시보드 단계에서 제자리걸음을 하고 있는 것으로 나타났습니다. Visier와 같은 벤더가 제공하는 드래그 앤 드롭 방식의 도구는 진입 장벽을 낮추고 있지만, 모델의 결과를 해석하고 적절한 개입 조치를 취하기 위해서는 여전히 경험이 풍부한 분석가가 필요합니다. 대학이나 사내 교육 기관이 인재 공급원을 확대하기 전까지는 인재 부족이 중소기업의 분석 투자 수익률(ROI)을 계속해서 제한할 것입니다.
부문 분석
솔루션 부문은 2025년 매출의 69.73%를 차지한 것으로 평가되었으며, 기업들이 최소한의 설정만으로 가동 가능한 패키지형 대시보드, 미리 구축된 커넥터 및 내장형 예측 모델을 선호한다는 사실이 부각되었습니다. 구축 컨설팅, 맞춤형 모델 개발, 관리형 애널리틱스 등의 서비스는 연평균 성장률(CAGR) 13.89%로 확대되고 있습니다. 이는 사내에 데이터 인력이 없는 기업들이 데이터 마이그레이션, 변경 관리, 편향성 검사를 파트너에 의존하고 있기 때문입니다. 설명 가능성 및 개인정보 보호에 관한 규제 요건이 전문적인 자문 프로젝트에 대한 수요를 견인하고 있기 때문에 소프트웨어 벤더가 누리고 있는 HR 애널리틱스 시장 점유율 우위는 축소될 전망입니다.
구독형 가격 책정 방식 덕분에 구매자는 시간이 지남에 따라 모듈을 추가할 수 있어 도입 주기를 몇 개월에서 몇 주로 단축할 수 있습니다. Oracle은 2025 회계연도에 클라우드 서비스 요금이 23% 증가했습니다. 이는 고객이 복잡한 조직 구조를 표준화된 지표 라이브러리에 매핑해야 했기 때문입니다. 액센츄어와 IBM은 데이터 사이언스자와 산업·조직 심리학자를 결합하여, 원시 인사이트를 인재 유지 및 재교육 프로그램으로 전환함으로써 인재 분석 사업을 두 자릿수 성장률로 확대했습니다. 이러한 자문 사업의 성장은 소프트웨어가 여전히 HR 애널리틱스 시장의 핵심임에도 불구하고, 서비스 분야가 계속해서 입지를 다져가고 있음을 시사합니다.
2025년 지출 중 클라우드 도입이 75.67%를 차지했으며, 연평균 성장률(CAGR) 13.96%로 성장하고 있어, 다른 모든 도입 옵션을 앞지르고 있습니다. 멀티테넌트 설계는 기능 출시 가속화에 기여하고 있으며, 그 증거로 레거시 스택의 연간 패치 적용에 비해 Workday는 2025년에 3회의 주요 업데이트를 실시했습니다. 또한, 종량제 요금 체계로 인해 벤더의 수익이 고객의 직원 수와 연동되므로, 채용 동결 기간 중 ‘보류된 소프트웨어’에 대한 CFO의 우려를 완화하고 있습니다.
온프레미스형 플랫폼은 여전히 정부 기관이나 규제가 엄격한 은행 업계에서 사용되고 있습니다. 이러한 분야에서는 데이터 상주 요건이나 메인프레임과의 복잡한 연관성으로 인해 전환이 지연되고 있습니다. SAP의 보고서에 따르면, SuccessFactors는 2025년에 2,100개의 클라우드 고객을 확보한 반면, 온프레미스형 ECC 라이선스는 9% 감소했습니다. 하이브리드 아키텍처, 즉 기밀 기록을 위한 국내 미러와 결합된 클라우드 분석 계층은 러시아, 인도네시아, 베트남에서 임시적인 해결책이 되고 있지만, 간접비 증가로 인해 결국 SaaS로의 완전한 전환이 불가피할 수 있습니다.
지역별 분석
북미는 2025년 매출의 39.48%를 차지했습니다. 이는 상장 기업에 인적 자본 공시를 의무화하는 SEC 규정과 HR 테크 스타트업에 대한 견조한 벤처 투자가 뒷받침한 결과입니다. 2025년, 미국 기업들은 AI 기반 HR 도구에 기업당 평균 160만 달러를 지출했습니다. 캐나다의 ‘임금 평등법’은 보상 분석에 대한 수요를 더욱 부추기고 있는 반면, 멕시코 제조업의 니어쇼어링 붐은 공장 확장에 발맞춘 인력 계획 대시보드의 필요성을 높이고 있습니다.
아시아태평양은 연평균 성장률(CAGR) 14.69%를 기록하며 가장 빠르게 성장하고 있는 지역입니다. 인도의 주요 IT 기업들은 생성형 AI를 통한 자동화가 서비스 제공 모델을 재구축하는 가운데, 직원 재배치를 위해 스킬 그래프를 도입했습니다. 중국의 국영 기업들은 정부의 현대화 방침에 따라 인사 프로세스의 디지털화를 추진하고 있으며, 일본에서는 노동 인구 감소로 인해 제조업체들이 직원 1인당 생산성을 극대화해야 하는 상황에 직면해 있습니다. 호주의 2024년 ‘공정근로법(Fair Work Act)’ 개정에 따라 긱 경제 근로자에게도 휴가 권리가 확대되면서, 비정규 노동력 관리 분야에서 새로운 분석 활용 사례가 등장하고 있습니다.
유럽의 ‘기업 지속가능성 보고 지침’에 따라 다양성 및 교육과 관련된 지표가 감사된 재무제표에 포함되면서, 인사 분석의 범위가 CFO의 관할 영역으로 확대되고 있습니다. 독일 노동평의회의 공동결정 규정에 따라 직원 모니터링에 대한 동의 절차가 의무화되었으며, 이는 제품 로드맵에 영향을 미치고 있습니다. 중동에서는 사우디아라비아의 ‘사우디화’ 할당제로 인해 시민과 외국인 근로자의 비율을 추적하는 대시보드에 대한 규정 준수 주도적 수요가 발생하고 있습니다. 남미에서는 투자가 아직 뒤처져 있지만, 브라질의 노동법 개정에 따라 하이브리드 근무 일정의 규정 준수를 보장하기 위해 고용주들은 클라우드 분석 도입을 추진하고 있습니다.
기타 혜택 :
- 엑셀 형식 시장 예측(ME) 시트
- 3개월간의 애널리스트 지원
자주 묻는 질문
목차
제1장 서론
제2장 조사 방법
제3장 주요 요약
제4장 시장 구도
제5장 시장 규모 및 성장 예측
제6장 경쟁 구도
제7장 시장 기회 및 향후 전망
AJY 26.09.09According to Mordor Intelligence, the HR analytics market size is projected to be USD 4.89 billion in 2025, USD 5.71 billion in 2026, and reach USD 10.82 billion by 2031, growing at a CAGR of 13.64% from 2026 to 2031.
This report is Segmented by Component (Solutions, and Services), Deployment Mode (On-Premise, and Cloud), Organization Size (Large Enterprises, and Small and Medium Enterprises), Application (Talent Acquisition and Onboarding, Workforce Planning and Optimization, and More), End-User Industry (IT and Telecom, Retail and Consumer Goods, Manufacturing, and More), and Geography. Market Forecasts are in Value (USD).
Global HR Analytics Market Trends and Insights
Cloud-Based HR Analytics Adoption Surge
Moving HR analytics to the cloud has eliminated the upfront hardware and licensing costs that once limited adoption to very large companies. An ISG poll of 1,200 organizations showed that 69% were already running at least one HR module in software-as-a-service form by the close of 2025, a steep jump from 52% in 2023. Oracle added 1,400 Fusion Cloud HCM clients during fiscal 2025 as modular, per-employee pricing appealed to budget-sensitive buyers. Workday shipped three major releases in 2025, versus the single annual update common in legacy on-premises deployments, underscoring the feature-velocity advantage of a multi-tenant design. The same architecture, however, channels data through hyperscale centers that can clash with EU cross-border rules, a tension highlighted by Amazon's EUR 746 million (USD 843 million) GDPR fine for employee data processing.
Need to Cut Attrition and Optimize Workforce Cost
Voluntary turnover costs U.S. employers USD 1 trillion in 2025, prompting firms to lean on predictive models that flag flight risk months before a resignation. IBM's Watson Analytics reached 95% accuracy in predicting which workers would exit within a year by blending tenure, promotion history, and external labor-market signals. Hospitals that paired these insights with targeted retention bonuses and shift-pattern tweaks trimmed registered-nurse attrition by 22%, saving an average of USD 52,100 per avoided departure. Pay-compression dashboards also reveal cases where new hires out-earn long-serving colleagues, a trigger for "quiet quitting" that companies address through mid-cycle salary corrections. As CHROs quantify such savings, finance teams increasingly treat people analytics as a cost-containment lever rather than a discretionary tool.
Shortage of HR Data-Science Talent
People analytics roles blend SQL, Python, statistics, and HR policy knowledge, a skill cocktail still rare in labor markets worldwide. LinkedIn's 2025 Emerging Jobs Report ranked people analytics specialist seventh by growth rate, yet the median position sat unfilled for more than 90 days and carried salary premiums of 25-35% over standard HR analyst positions. Deloitte observes that many mid-market firms stall at descriptive dashboards because they lack the staff to build predictive models. Drag-and-drop tools from vendors such as Visier reduce entry barriers, but interpreting model output and steering interventions still call for seasoned analysts. Until universities and in-house academies expand pipelines, talent scarcity will cap analytics ROI for small to midsize employers.
Other drivers and restraints analyzed in the detailed report include:
- Hybrid and Remote Work Accelerating Data-Driven HR
- Generative-AI Copilots Embedded in HR Suites
- Data-Privacy and Compliance Complexity
For complete list of drivers and restraints, kindly check the Table Of Contents.
Segment Analysis
Solutions captured 69.73% of 2025 revenue, underscoring enterprises' preference for packaged dashboards, prebuilt connectors, and embedded predictive models that can be activated with minimal configuration. Services such as implementation consulting, custom model development, and managed analytics are advancing at a 13.89% CAGR, as firms without in-house data talent rely on partners for data migration, change management, and bias-testing. The HR analytics market share advantage enjoyed by software vendors is likely to narrow as regulatory requirements for explainability and privacy drive demand for specialized advisory projects.
Subscription pricing lets buyers add modules over time, compressing deployment cycles from months to weeks. Oracle recorded a 23% jump in cloud-services fees in fiscal-2025 because clients needed mapping of complex org structures to standardized metric libraries. Accenture and IBM both expanded workforce analytics practices by double digits, pairing data scientists with industrial-organizational psychologists to turn raw insights into retention or reskilling programs. This advisory uptick signals that services will continue to gain ground, even though software remains the spine of the HR analytics market.
Cloud installations accounted for 75.67% of 2025 spending and are growing at a 13.96% CAGR, outpacing all other deployment options. Multi-tenant design accelerates feature releases, evidenced by Workday's three major updates in 2025 versus annual patches on legacy stacks. Consumption-based pricing also aligns vendor revenue with customer headcount, easing CFO concerns about shelf-ware during hiring freezes.
On-premises platforms persist in government and highly regulated banking, where data residency or mainframe entanglements slow migration. SAP reported that SuccessFactors added 2,100 cloud customers in 2025, while on-premises ECC licenses fell 9%. Hybrid architectures, a cloud analytics layer combined with in-country mirrors for sensitive records, are an interim fix in Russia, Indonesia, and Vietnam, but overhead costs may eventually push holdouts toward full SaaS adoption.
Complete Report Scope:
- By Component
- Solutions
- Services
- By Deployment Mode
- On-Premise
- Cloud
- By Organization Size
- Large Enterprises
- Small and Medium Enterprises
- By Application
- Talent Acquisition and Onboarding
- Workforce Planning and Optimization
- Compensation and Payroll Analytics
- Learning and Development Analytics
- Employee Engagement and Wellbeing Analytics
- Diversity, Equity and Inclusion Analytics
- By End-User Industry
- IT and Telecom
- Banking, financial services and insurance (BFSI)
- Retail and Consumer Goods
- Healthcare and Life Sciences
- Manufacturing
- Government and Public Sector
- Other End-User Industries
- By Geography
- North America
- United States
- Canada
- Mexico
- Europe
- Germany
- United Kingdom
- France
- Russia
- Rest of Europe
- Asia-Pacific
- China
- Japan
- India
- South Korea
- Australia
- Rest of Asia-Pacific
- Middle East and Africa
- Middle East
- Saudi Arabia
- United Arab Emirates
- Rest of Middle East
- Africa
- South Africa
- Egypt
- Rest of Africa
- Middle East
- South America
- Brazil
- Argentina
- Rest of South America
- North America
Geography Analysis
North America accounted for 39.48% of 2025 revenue, supported by SEC rules mandating human-capital disclosures for listed companies and robust venture investment in HR tech startups. U.S. enterprises spent an average of USD 1.6 million each on AI-powered HR tooling during 2025. Canada's Pay Equity Act further boosts demand for compensation analytics, while Mexico's manufacturing nearshoring boom drives the need for headcount-planning dashboards that keep pace with plant expansions.
Asia-Pacific is the fastest-growing region, with a 14.69% CAGR. India's IT majors adopted skills graphs to redeploy staff as generative-AI automation reshapes delivery models. China's state-owned enterprises digitize HR processes under government modernization mandates, and Japan's shrinking labor pool forces manufacturers to maximize productivity per worker. Australia's 2024 Fair Work amendments extend leave entitlements to gig-economy workers, opening new analytics use cases in contingent labor management.
Europe's Corporate Sustainability Reporting Directive embeds diversity and training metrics into audited statements, pushing HR analytics into CFO territory. Germany's works council co-determination rules require consent layers for employee monitoring, thereby influencing product roadmaps. In the Middle East, Saudi Arabia's Saudization quotas create a compliance-driven need for dashboards that track citizen-to-expat ratios. South America lags in spending, yet Brazil's labor-law modernization is nudging employers toward cloud analytics for hybrid scheduling compliance.
- SAP SE
- Oracle Corporation
- Workday Inc.
- IBM Corporation
- ADP Inc.
- UKG Inc.
- Tableau Software, LLC
- Visier Inc.
- Crunchr BV
- Culture Amp Pty Ltd
- ChartHop Inc.
- PeopleInsight Analytics Corp.
- Lattice HQ Inc.
- Gloat Ltd.
- Eightfold AI Inc.
- HiBob Ltd.
- Syndio Solutions Inc.
- Nakisa Inc.
- Zoho Corporation Pvt Ltd.
- GainInsights Solutions Pvt Ltd.
- Cornerstone OnDemand Inc.
- Ceridian HCM Holding Inc.
- BambooHR LLC
- Paycor Inc.
- Personio GmbH
Additional Benefits:
- The market estimate (ME) sheet in Excel format
- 3 months of analyst support
TABLE OF CONTENTS
1 INTRODUCTION
- 1.1 Study Assumptions and Market Definition
- 1.2 Scope of the Study
2 RESEARCH METHODOLOGY
3 EXECUTIVE SUMMARY
4 MARKET LANDSCAPE
- 4.1 Market Overview
- 4.2 Market Drivers
- 4.2.1 Cloud-Based HR Analytics Adoption Surge
- 4.2.2 Need to Cut Attrition and Optimise Workforce Cost
- 4.2.3 Hybrid and Remote Work Accelerating Data-Driven HR
- 4.2.4 Generative-AI Copilots Embedded in HR Suites
- 4.2.5 ESG-Linked Human-Capital Disclosure Mandates
- 4.2.6 Wearable and Biometric Data for Wellbeing Analytics
- 4.3 Market Restraints
- 4.3.1 Shortage of HR Data-Science Talent
- 4.3.2 Data-Privacy and Compliance Complexity
- 4.3.3 Algorithmic-Bias Litigation Risk
- 4.3.4 Legacy Siloed HR Data Architectures
- 4.4 Industry Value Chain Analysis
- 4.5 Regulatory Landscape
- 4.6 Technological Outlook
- 4.7 Porter's Five Forces Analysis
- 4.7.1 Bargaining Power of Suppliers
- 4.7.2 Bargaining Power of Buyers
- 4.7.3 Threat of New Entrants
- 4.7.4 Threat of Substitutes
- 4.7.5 Intensity of Competitive Rivalry
- 4.8 Impact of Macroeconomic Factors on the Market
5 MARKET SIZE AND GROWTH FORECASTS (VALUE)
- 5.1 By Component
- 5.1.1 Solutions
- 5.1.2 Services
- 5.2 By Deployment Mode
- 5.2.1 On-Premise
- 5.2.2 Cloud
- 5.3 By Organization Size
- 5.3.1 Large Enterprises
- 5.3.2 Small and Medium Enterprises
- 5.4 By Application
- 5.4.1 Talent Acquisition and Onboarding
- 5.4.2 Workforce Planning and Optimization
- 5.4.3 Compensation and Payroll Analytics
- 5.4.4 Learning and Development Analytics
- 5.4.5 Employee Engagement and Wellbeing Analytics
- 5.4.6 Diversity, Equity and Inclusion Analytics
- 5.5 By End-User Industry
- 5.5.1 IT and Telecom
- 5.5.2 Banking, financial services and insurance (BFSI)
- 5.5.3 Retail and Consumer Goods
- 5.5.4 Healthcare and Life Sciences
- 5.5.5 Manufacturing
- 5.5.6 Government and Public Sector
- 5.5.7 Other End-User Industries
- 5.6 By Geography
- 5.6.1 North America
- 5.6.1.1 United States
- 5.6.1.2 Canada
- 5.6.1.3 Mexico
- 5.6.2 Europe
- 5.6.2.1 Germany
- 5.6.2.2 United Kingdom
- 5.6.2.3 France
- 5.6.2.4 Russia
- 5.6.2.5 Rest of Europe
- 5.6.3 Asia-Pacific
- 5.6.3.1 China
- 5.6.3.2 Japan
- 5.6.3.3 India
- 5.6.3.4 South Korea
- 5.6.3.5 Australia
- 5.6.3.6 Rest of Asia-Pacific
- 5.6.4 Middle East and Africa
- 5.6.4.1 Middle East
- 5.6.4.1.1 Saudi Arabia
- 5.6.4.1.2 United Arab Emirates
- 5.6.4.1.3 Rest of Middle East
- 5.6.4.2 Africa
- 5.6.4.2.1 South Africa
- 5.6.4.2.2 Egypt
- 5.6.4.2.3 Rest of Africa
- 5.6.4.1 Middle East
- 5.6.5 South America
- 5.6.5.1 Brazil
- 5.6.5.2 Argentina
- 5.6.5.3 Rest of South America
- 5.6.1 North America
6 COMPETITIVE LANDSCAPE
- 6.1 Market Concentration
- 6.2 Strategic Moves
- 6.3 Market Share Analysis
- 6.4 Company Profiles (includes Global Level Overview, Market Level Overview, Core Segments, Financials as Available, Strategic Information, Market Rank/Share for Key Companies, Products and Services, and Recent Developments)
- 6.4.1 SAP SE
- 6.4.2 Oracle Corporation
- 6.4.3 Workday Inc.
- 6.4.4 IBM Corporation
- 6.4.5 ADP Inc.
- 6.4.6 UKG Inc.
- 6.4.7 Tableau Software, LLC
- 6.4.8 Visier Inc.
- 6.4.9 Crunchr BV
- 6.4.10 Culture Amp Pty Ltd
- 6.4.11 ChartHop Inc.
- 6.4.12 PeopleInsight Analytics Corp.
- 6.4.13 Lattice HQ Inc.
- 6.4.14 Gloat Ltd.
- 6.4.15 Eightfold AI Inc.
- 6.4.16 HiBob Ltd.
- 6.4.17 Syndio Solutions Inc.
- 6.4.18 Nakisa Inc.
- 6.4.19 Zoho Corporation Pvt Ltd.
- 6.4.20 GainInsights Solutions Pvt Ltd.
- 6.4.21 Cornerstone OnDemand Inc.
- 6.4.22 Ceridian HCM Holding Inc.
- 6.4.23 BambooHR LLC
- 6.4.24 Paycor Inc.
- 6.4.25 Personio GmbH
7 MARKET OPPORTUNITIES AND FUTURE OUTLOOK
- 7.1 White-Space and Unmet-Need Assessment