

|
시장보고서
상품코드
2124285
로보 어드바이저리 서비스 시장 : 시장 점유율 분석, 업계 동향 및 통계, 성장 예측(2026-2031년)Robo-advisory Services - Market Share Analysis, Industry Trends & Statistics, Growth Forecasts (2026 - 2031) |
||||||
 Mordor Intelligence
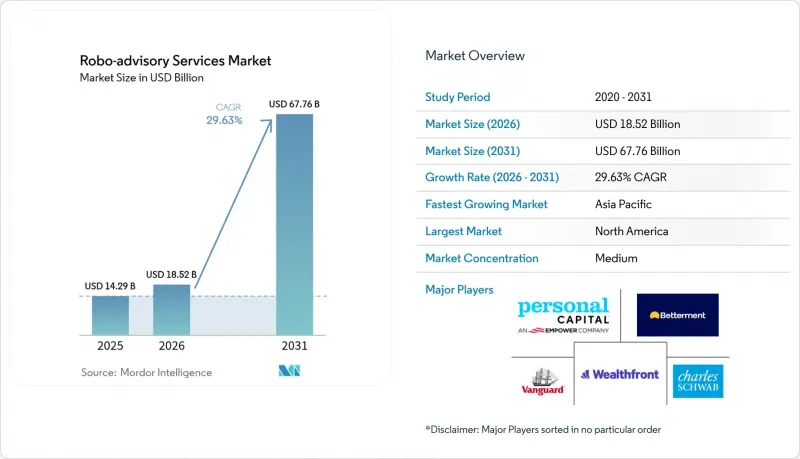
Mordor Intelligence에 의하면, 2026년 로보 어드바이저리 서비스 시장 규모는 185억 2,000만 달러로 추정되고, 2025년 142억 9,000만 달러에서 확대해, 2031년에는 677억 6,000만 달러에 이를 것으로 예측됩니다.
2026-2031년 연평균 성장률(CAGR) 29.63%로 성장할 것으로 전망됩니다.
본 보고서는 비즈니스 모델별(순수 로보 어드바이저리·하이브리드형 로보 어드바이저리), 서비스 유형별(투자 자문, 자산 관리, 기타), 제공업체 유형별(핀테크 기업, 은행·신용조합, 기존 자산운용사·증권사), 최종 사용자별(개인 투자자, 고액 자산가, 중소기업·기업의 재무 부서), 그리고 지역별로 분류되어 있습니다.
세계의 로보 어드바이저리 서비스 시장 동향 및 인사이트
BFSI 산업의 디지털화
클라우드 네이티브 인프라와 API 기반 아키텍처 덕분에 은행은 레거시 시스템을 대대적으로 개편하지 않고도 기존 핵심 시스템에 로보 어드바이저리 모듈을 통합할 수 있게 되었습니다. JP모건의 AI 기반 현금 관리 도구는 2,500개 고객사에서 수작업 처리를 90% 줄여, 알고리즘 기반 조언의 확장성을 입증했습니다. 지멘스(Siemens) 트레저리의 디지털 전환을 통해 연간 비용을 2,000만 달러 절감했으며, 프로그래밍 가능한 결제 및 블록체인 기반이 실시간 재조정을 어떻게 지원하는지 명확히 보여주었습니다. 유럽의 ESMA는 규정 준수 안전 조치를 명확히 하는 AI 지침을 발표하여 기관 투자자의 AI 도입을 촉진하고 있습니다.
개인 재무 관리의 비용 효율성
자동 운용 포트폴리오의 수수료는 일반적으로 0.25-0.50%인 반면, 기존 금융 기관에서는 1-2%에 달하며, 이러한 차이로 인해 2025년에는 전 세계 로보 어드바이저리 자산이 1조 달러 이상 증가했습니다. 베터먼트(Betterment)의 단계별 요금 모델은 마진의 레버리지 효과를 여실히 보여주고 있습니다. 이 회사는 500억 달러를 운용하면서 효율화를 통해 얻은 이익을 사용자에게 환원하고 있습니다. 블랙록의 ‘Aperio’ 플랫폼은 130만 건의 거래를 실행하고 1억 6,400만 달러의 세무상 손실을 계상함으로써, 알고리즘의 속도를 세후 알파로 전환했습니다.
부문 분석
하이브리드형 자문사는 2025년 매출의 60.10%를 차지했으며, 로보 어드바이저리 서비스 시장 점유율에서 가장 큰 단일 부문이 되었습니다. 한편, 순수 로보 어드바이저리는 연평균 성장률(CAGR) 34.35%로 성장하고 있습니다. 투자자들은 저비용의 효율성과 시장 변동 시 인적 안전망이라는 하이브리드형의 매력에 이끌리고 있습니다.
플랫폼은 자산 규모가 아닌 라이프 스테이지에 따라 세분화되는 경향이 강해지고 있습니다. 로빈후드가 곧 도입할 ‘플레인 바닐라’형 로보 어드바이저리는 자산 배분에는 알고리즘을 채택하면서도 종목 선정은 사람이 수행한다는 점에서 SEC의 기대와 사용자의 안심감을 모두 충족시키는 섬세한 융합을 보여주고 있습니다.
웰스 매니지먼트 서비스는 2025년 지출의 38.15%를 차지했으며, 54억 5,000만 달러에 달하는 로보 어드바이저리 서비스 시장 규모에서 가장 큰 점유율을 차지하고 있습니다. 대조적으로, 세무 손익 통산(택스 로스 하베스팅)은 세후 알파를 추구하는 투자자들 수요를 배경으로 연평균 성장률(CAGR) 33.20%로 가속화되고 있습니다.
직접 인덱스와 자동 세금 손익 통산을 결합함으로써 순수익률을 1-2% 끌어올릴 수 있습니다. 블랙록의 ‘아페리오(Aperio)’의 성공은 기관 투자자 수준의 알고리즘이 현재 고액 자산가 개인 고객에게도 제공 가능하며, 2026년 세법 개정에 앞서 고객의 충성도를 공고히 할 수 있음을 보여줍니다.
지역별 분석
북미는 규제 명확화와 Betterment, Wealthfront와 같은 선구적인 플랫폼을 배경으로 2025년 전 세계 지출의 37.75%를 계속 차지했습니다. 이 지역의 주주 중심 세제와 높은 디지털 뱅킹 보급률은 치열한 수수료 압박에도 불구하고 프리미엄 가격 책정 모델을 뒷받침하고 있습니다.
유럽의 MiFID II 생태계는 투자자 보호와 투명성을 촉진하며, 디지털 자문사의 국경 간 사업 확장을 뒷받침하고 있습니다. ESMA(유럽증권시장감독청)의 AI 지침에 따라 알고리즘 공개의 표준화가 더욱 진행되고 있지만, 각 기업은 여전히 국가별로 데이터 개인정보 보호 의무를 조정해야 합니다. Scalable Capital과 같은 범유럽 플랫폼은 언어, 리스크 설문조사, 연금 제도와의 연동을 현지화함으로써 잠재적 수요를 발굴하고 있습니다.
아시아태평양은 32.90%라는 가장 높은 연평균 성장률(CAGR)을 기록하고 있습니다. 싱가포르, 일본, 인도의 규제 샌드박스를 통해 스타트업은 신속하게 서비스를 개선할 수 있으며, 한편 중산층의 저축 잔고 증가는 운용 자산(AUM) 유입을 견인하고 있습니다. Revolut의 싱가포르용 로보 어드바이저리는 최소 100달러부터 이용 가능하도록 서비스를 시작했으며, Syfe의 홍콩 사업 확장은 대중 부유층(Mass Affluent) 확보 경쟁의 시작을 시사하고 있습니다. 미쓰비시 UFJ 파이낸셜 그룹(MUFG)의 WealthNavi 인수는 현지 유력 기업의 확장 가능성을 뒷받침하는 것이며, 도쿄증권거래소에서의 로보 ETF 교차 상장을 위한 길을 열어주는 것입니다.
기타 혜택
- 엑셀 형식 시장 예측(ME) 시트
- 3개월간의 애널리스트 지원
자주 묻는 질문
목차
제1장 서론
제2장 조사 방법
제3장 주요 요약
제4장 시장 구도
제5장 시장 규모 및 성장 예측
제6장 경쟁 구도
제7장 시장 기회 및 향후 전망
AJY 26.09.11According to Mordor Intelligence, robo advisory services market size in 2026 is estimated at USD 18.52 billion, growing from 2025 value of USD 14.29 billion with 2031 projections showing USD 67.76 billion, growing at 29.63% CAGR over 2026-2031.
This report is Segmented by Business Model (Pure Robo-Advisor and Hybrid Robo-Advisor), Service Type (Investment Advisory, Wealth Management, and More), Provider Type (FinTech Firms, Banks and Credit Unions, and Traditional Wealth Managers/Broker-Dealers), End-User (Retail Investors, High-Net-Worth Individuals, and SMEs and Corporate Treasuries), and Geography.
Global Robo-advisory Services Market Trends and Insights
Digitisation of the BFSI industry
Cloud-native infrastructure and API-driven architectures are enabling banks to plug robo modules into legacy cores without wholesale rewrites. JPMorgan's AI-based cash-management tool cut manual processing by 90% for 2,500 clients, proving scalability for algorithmic advice. Siemens Treasury's digital migration shaved USD 20 million in yearly costs, underscoring how programmable payments and blockchain rails support real-time rebalancing. Europe's ESMA has issued AI guidance that clarifies compliance guardrails, fostering institutional uptake.
Cost-efficiency in personal finance management
Automated portfolios typically charge 0.25-0.50% versus 1-2% at traditional firms, a spread that unlocked more than USD 1 trillion in global robo assets in 2025. Betterment's tiered model illustrates margin leverage: the firm manages USD 50 billion while passing efficiency gains to users. BlackRock's Aperio platform executed 1.3 million trades and harvested USD 164 million in tax losses, turning algorithmic speed into after-tax alpha.
Other drivers and restraints analyzed in the detailed report include:
- Growing millennial and Gen-Z preference for DIY investing
- AI-powered hyper-personalised nudges boost engagement
- Lack of human touch and empathy
- Regulatory and fiduciary uncertainty across regions
For complete list of drivers and restraints, kindly check the Table Of Contents.
Segment Analysis
Hybrid advisers captured 60.10% of 2025 revenue, equal to the largest single slice of robo-advisory services market share, while pure robos are expanding at a 34.35% CAGR. Investors gravitate to the hybrid promise of low-cost efficiency with a human backstop during volatility.
Platforms increasingly segment by life stage rather than wealth tier. Robinhood's upcoming plain-vanilla robo uses algorithms for allocation but retains human security selection, illustrating a nuanced blend that meets SEC expectations and user comfort levels.
Wealth management services retained 38.15% of 2025 spending, representing the largest slice of the robo-advisory services market size at USD 5.45 billion. By contrast, tax-loss harvesting is accelerating at 33.20% CAGR, riding investor demand for after-tax alpha.
Direct indexing coupled with automated harvesting can add 1-2 percentage points of net returns. BlackRock's Aperio success shows that institutional-grade algorithms can now be delivered to affluent retail accounts, locking in loyalty ahead of the 2026 tax-code revisions.
Complete Report Scope:
- By Business Model
- Pure Robo-advisor
- Hybrid Robo-advisor
- By Service Type
- Investment Advisory
- Wealth Management
- Retirement Planning
- Tax-loss Harvesting
- Goal-based Planning
- By Provider Type
- FinTech Firms
- Banks and Credit Unions
- Traditional Wealth Managers/Broker-Dealers
- By End-user
- Retail Investors
- High-Net-Worth Individuals (HNWI)
- SMEs and Corporate Treasuries
- By Geography
- North America
- United States
- Canada
- Mexico
- South America
- Brazil
- Argentina
- Chile
- Rest of South America
- Europe
- Germany
- United Kingdom
- France
- Italy
- Spain
- Russia
- Rest of Europe
- Asia-Pacific
- China
- India
- Japan
- South Korea
- Singapore
- Malaysia
- Australia
- Rest of Asia-Pacific
- Middle East and Africa
- Middle East
- Saudi Arabia
- Turkey
- Israel
- Rest of Middle East
- Africa
- South Africa
- Nigeria
- Rest of Africa
- Middle East
- North America
Geography Analysis
North America retained 37.75% of global spending in 2025 on the back of regulatory clarity and early-mover platforms such as Betterment and Wealthfront. The region's shareholder-friendly tax frameworks and high digital-banking penetration sustain premium pricing models despite fierce fee compression.
Europe's MiFID II ecosystem promotes investor protection and transparency, encouraging cross-border expansion for digital advisers. ESMA's AI guidelines further standardize algorithmic disclosures, though firms must still reconcile data-privacy obligations country by country. Pan-European platforms like Scalable Capital are localizing language, risk questionnaires, and pension integrations to unlock addressable demand.
Asia-Pacific posts the highest 32.90% CAGR. Regulatory sandboxes in Singapore, Japan, and India let start-ups iterate rapidly, while rising middle-class savings pools drive AUM inflows. Revolut's Singapore robo launched with only USD 100 minimums, and Syfe's Hong Kong build-out signals a mass-affluent land grab. MUFG's WealthNavi acquisition validates the scalability of local champions and paves a path for cross-listing of robo ETFs on the Tokyo Stock Exchange.
- Vanguard Group Inc.
- Charles Schwab & Co. Inc. (Intelligent Portfolios)
- Empower Advisory Group Inc. (Personal Capital)
- Betterment LLC
- Wealthfront Corporation
- BlackRock Inc. (FutureAdvisor)
- FMR LLC (Fidelity Go)
- M1 Holdings Inc. (M1 Finance)
- Acorns Grow Inc.
- Stash Financial Inc.
- Robinhood Advisory LLC (Robinhood Portfolio)
- Ellevest Inc.
- SigFig Wealth Management LLC
- SoFi Technologies Inc. (SoFi Invest)
- Nutmeg Saving & Investment Ltd.
- Scalable Capital GmbH
- Raisin DS GmbH (WeltSparen Invest)
- Bambu Global Pte Ltd.
- Wahed Invest LLC
- Syfe Pte Ltd.
- Stockspot Pty Ltd.
- Groww (Nextbillion Technology Pvt Ltd.)
- Freetrade Ltd.
- SmartWealth (Emirates NBD)
- Revolut Ltd (Wealth & Trading)
Additional Benefits:
- The market estimate (ME) sheet in Excel format
- 3 months of analyst support
TABLE OF CONTENTS
1 INTRODUCTION
- 1.1 Study Assumptions and Market Definition
- 1.2 Scope of the Study
2 RESEARCH METHODOLOGY
3 EXECUTIVE SUMMARY
4 MARKET LANDSCAPE
- 4.1 Market Overview
- 4.2 Market Drivers
- 4.2.1 Digitisation of the BFSI industry
- 4.2.2 Cost-efficiency in personal finance management
- 4.2.3 Growing millennial and Gen-Z preference for DIY investing
- 4.2.4 AI-powered hyper-personalised nudges boost engagement
- 4.2.5 Embedded robo-advice within payroll/benefits platforms
- 4.3 Market Restraints
- 4.3.1 Lack of human touch and empathy
- 4.3.2 Regulatory and fiduciary uncertainty across regions
- 4.3.3 Algorithmic-bias risk creating compliance liabilities
- 4.4 Industry Value Chain Analysis
- 4.5 Regulatory Landscape
- 4.6 Technological Outlook
- 4.7 Industry Attractiveness - Porter's Five Forces Analysis
- 4.7.1 Bargaining Power of Suppliers
- 4.7.2 Bargaining Power of Buyers
- 4.7.3 Threat of New Entrants
- 4.7.4 Threat of Substitute Products
- 4.7.5 Intensity of Competitive Rivalry
- 4.8 Impact of Macroeconomic Factors on the Market
5 MARKET SIZE AND GROWTH FORECASTS (VALUES)
- 5.1 By Business Model
- 5.1.1 Pure Robo-advisor
- 5.1.2 Hybrid Robo-advisor
- 5.2 By Service Type
- 5.2.1 Investment Advisory
- 5.2.2 Wealth Management
- 5.2.3 Retirement Planning
- 5.2.4 Tax-loss Harvesting
- 5.2.5 Goal-based Planning
- 5.3 By Provider Type
- 5.3.1 FinTech Firms
- 5.3.2 Banks and Credit Unions
- 5.3.3 Traditional Wealth Managers/Broker-Dealers
- 5.4 By End-user
- 5.4.1 Retail Investors
- 5.4.2 High-Net-Worth Individuals (HNWI)
- 5.4.3 SMEs and Corporate Treasuries
- 5.5 By Geography
- 5.5.1 North America
- 5.5.1.1 United States
- 5.5.1.2 Canada
- 5.5.1.3 Mexico
- 5.5.2 South America
- 5.5.2.1 Brazil
- 5.5.2.2 Argentina
- 5.5.2.3 Chile
- 5.5.2.4 Rest of South America
- 5.5.3 Europe
- 5.5.3.1 Germany
- 5.5.3.2 United Kingdom
- 5.5.3.3 France
- 5.5.3.4 Italy
- 5.5.3.5 Spain
- 5.5.3.6 Russia
- 5.5.3.7 Rest of Europe
- 5.5.4 Asia-Pacific
- 5.5.4.1 China
- 5.5.4.2 India
- 5.5.4.3 Japan
- 5.5.4.4 South Korea
- 5.5.4.5 Singapore
- 5.5.4.6 Malaysia
- 5.5.4.7 Australia
- 5.5.4.8 Rest of Asia-Pacific
- 5.5.5 Middle East and Africa
- 5.5.5.1 Middle East
- 5.5.5.1.1 Saudi Arabia
- 5.5.5.1.2 Turkey
- 5.5.5.1.3 Israel
- 5.5.5.1.4 Rest of Middle East
- 5.5.5.2 Africa
- 5.5.5.2.1 South Africa
- 5.5.5.2.2 Nigeria
- 5.5.5.2.3 Rest of Africa
- 5.5.5.1 Middle East
- 5.5.1 North America
6 COMPETITIVE LANDSCAPE
- 6.1 Market Concentration
- 6.2 Strategic Moves
- 6.3 Market Share Analysis
- 6.4 Company Profiles (includes Global level Overview, Market level overview, Core Segments, Financials as available, Strategic Information, Market Rank/Share for key companies, Products and Services, and Recent Developments)
- 6.4.1 Vanguard Group Inc.
- 6.4.2 Charles Schwab & Co. Inc. (Intelligent Portfolios)
- 6.4.3 Empower Advisory Group Inc. (Personal Capital)
- 6.4.4 Betterment LLC
- 6.4.5 Wealthfront Corporation
- 6.4.6 BlackRock Inc. (FutureAdvisor)
- 6.4.7 FMR LLC (Fidelity Go)
- 6.4.8 M1 Holdings Inc. (M1 Finance)
- 6.4.9 Acorns Grow Inc.
- 6.4.10 Stash Financial Inc.
- 6.4.11 Robinhood Advisory LLC (Robinhood Portfolio)
- 6.4.12 Ellevest Inc.
- 6.4.13 SigFig Wealth Management LLC
- 6.4.14 SoFi Technologies Inc. (SoFi Invest)
- 6.4.15 Nutmeg Saving & Investment Ltd.
- 6.4.16 Scalable Capital GmbH
- 6.4.17 Raisin DS GmbH (WeltSparen Invest)
- 6.4.18 Bambu Global Pte Ltd.
- 6.4.19 Wahed Invest LLC
- 6.4.20 Syfe Pte Ltd.
- 6.4.21 Stockspot Pty Ltd.
- 6.4.22 Groww (Nextbillion Technology Pvt Ltd.)
- 6.4.23 Freetrade Ltd.
- 6.4.24 SmartWealth (Emirates NBD)
- 6.4.25 Revolut Ltd (Wealth & Trading)
7 MARKET OPPORTUNITIES AND FUTURE OUTLOOK
- 7.1 White-space and Unmet-need Assessment


