

|
시장보고서
상품코드
2124315
IoT 디바이스 관리 시장 : 시장 점유율 분석, 업계 동향 및 통계, 성장 예측(2026-2031년)IoT Device Management - Market Share Analysis, Industry Trends & Statistics, Growth Forecasts (2026 - 2031) |
||||||
 Mordor Intelligence
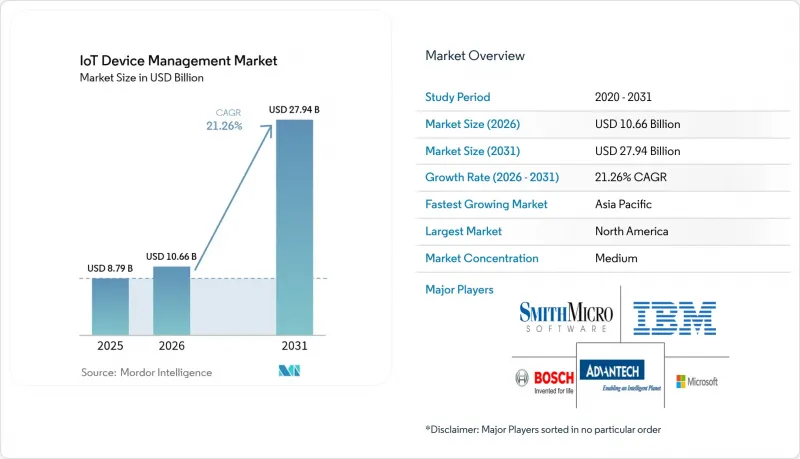
Mordor Intelligence에 의하면, IoT 디바이스 관리 시장 규모는 2025년에 87억 9,000만 달러로 평가되었고, 2026년 106억 6,000만 달러에서 2031년까지 279억 4,000만 달러에 이를 것으로 예측되며, 예측 기간(2026-2031년) CAGR은 21.26%를 나타낼 전망입니다.

본 보고서는 구성 요소별(솔루션 및 서비스), 배포 유형별(클라우드, 온프레미스, 기타), 연결 기술별(셀룰러(2G/3G/4G/5G), LPWAN(NB-IoT, LoRaWAN, Sigfox), 기타),조직 규모별(중소기업, 대기업), 최종 사용자 산업별(제조업, 운송 및 물류, 헬스케어 및 생명과학, 기타), 지역별로 분류되어 있습니다.
세계의 IoT 디바이스 관리 시장 동향 및 인사이트
IoT 엔드포인트의 급증으로 라이프사이클 관리 수요가 증가
2030년까지 전 세계 연결 디바이스 수는 750억 대를 넘어설 것으로 예측되며, 기존 IT 모니터링 모델로는 대응하기 어려운 상황이 되어, 통합적인 오케스트레이션이 이사회 차원의 요구 사항으로서 그 중요성이 커지고 있습니다. 현재 공장 현장에는 수천 개의 이종 센서가 도입되어 있으며, 이들에는 자동 프로비저닝, 지속적인 가시성, OTA(Over-the-Air)를 통한 펌웨어 관리가 요구되고 있습니다. 플랫폼 엔지니어링 팀은 다중 벤더의 디바이스 군을 통합하고, 관할 구역을 초월한 감사 가능성을 확보하기 위해 자동화 템플릿과 보안 기준의 표준화를 추진하고 있습니다.
디바이스 군에 대한 보안 및 규정 준수 요건 강화
2024년에 제정된 EU의 ‘사이버 회복탄력성법’은 ‘보안 설계(Secure by Design)’ 원칙, 소프트웨어 BOM(부품표), 지속적인 취약점 관리를 의무화하고 있으며, 위반 시 최대 1,500만 유로의 벌금이 부과됩니다. 미국과 일본의 유사한 지침에 더해, IoT 엔드포인트를 대상으로 한 월평균 5,200건의 공격이 겹치면서 구매자들은 제로 트러스트 아키텍처와 실시간 위협 감지 기능을 통합한 플랫폼으로 눈을 돌리고 있습니다. 탈레스(Thales)의 보고서에 따르면, 현재 55%의 조직이 IoT 보안을 기업 위험 상위 3위 안에 두고 있습니다.
분산된 상호운용성 표준
Matter나 OPC UA와 같은 이니셔티브가 공통 스키마를 추진하고 있지만, 산업, 소비자, 지자체 등 각 분야에 걸쳐 보편적인 프레임워크가 존재하지 않기 때문에 기업들은 여러 개의 디바이스 관리 포털을 병행하여 사용해야 하는 상황에 처해 있습니다. MDPI의 조사에 따르면, 멀티 벤더 환경 도입 사례의 67%가 여전히 맞춤형 API에 의존하고 있으며, 이로 인해 통합 비용이 증가하고 가치 실현까지 걸리는 시간이 길어지고 있습니다.
부문 분석
2025년에는 보안, 프로비저닝, 분석용 모듈을 핵심으로 하는 솔루션이 70.35%라는 압도적인 점유율을 차지했습니다. 기업들이 기존 자산(브라운필드)을 정책 주도형 클라우드 네이티브 프레임워크로 재구축함에 따라, 이 부문은 연평균 성장률(CAGR) 21.90%로 성장할 전망입니다. 보안 관리 모듈은 끊임없는 규정 준수 압박을 받으며 급성장하는 하위 범주로 자리 잡고 있습니다. 서비스 부문은 29.65%의 점유율을 차지하고 있으며, 브라운필드 개조에는 시스템 통합 및 as-a-Service형 관리가 필요하기 때문에 성장률(CAGR 22.10%) 측면에서 점차 격차를 벌리고 있습니다. 매니지드 서비스는 전담 엔지니어링 팀을 보유하지 않은 중소기업의 지지를 받고 있는 반면, 프로페셔널 서비스는 여러 공장에 걸친 복잡한 배포를 추진하고 있습니다. 이 두 요소의 융합은 핵심 플랫폼 수준에서의 상품화를 시사하며, 차별화의 초점은 수직형 가속기 및 AI 코파일럿으로 이동하고 있습니다.
클라우드는 2025년에도 67.85%의 점유율을 차지하며 계속해서 지배적인 위치를 유지했지만, 지연 시간이 중요한 워크로드로 인해 컴퓨팅은 공장 현장, 전력 변전소, 도로변 캐비닛으로 이동하고 있습니다. 5G MEC 노드 및 GPU 탑재 게이트웨이에 힘입어, 엣지 네이티브 도입은 연평균 성장률(CAGR) 26%를 나타낼 것으로 예측됩니다. 하이브리드형 아키텍처는 세계 클라우드의 확장성과 결정론적인 로컬 제어를 융합하여, 백홀 장애 시에도 펌웨어 거버넌스와 이상 감지를 보장합니다. 엣지에서의 AI 추론을 통해 원시 데이터의 백홀 양이 최대 75% 감소하여, 탄소 발자국 감소와 통신 사업자의 요금 절감으로 이어집니다. 각 벤더는 쿠버네티스(Kubernetes) 호환 런타임을 통합하여, OTA를 통한 펌웨어 및 컨테이너 업데이트를 위한 DevOps 스타일의 CI/CD 파이프라인을 구현하고 있습니다.
지역별 분석
북미는 성숙한 클라우드 생태계와 항공우주, 자동차, 헬스케어 분야의 조기 도입을 바탕으로 2025년 매출의 31.75%를 차지했습니다. 스마트 그리드의 복원력과 국가 사이버 보안 전략에 대한 연방 정부의 자금 지원이 플랫폼 업그레이드를 더욱 촉진하고 있습니다. 아시아태평양은 주요 성장 동력이며, 정부의 공장 자동화 및 스마트 시티 구축에 대한 보조금을 배경으로 연평균 성장률(CAGR) 24.10%로 확대되고 있습니다. IDC는 SIM 프로비저닝을 간소화하는 5G SA(Standalone)의 광범위한 도입에 힘입어, 2030년까지 해당 지역에서 389억 대의 연결 디바이스가 존재할 것으로 예측했습니다.
절대 수량으로는 중국이 압도적인 점유율을 차지하고 있지만, 인도와 인도네시아에서도 통신 사업자들이 산업 회랑 전역에 NB-IoT 네트워크를 구축하고 있어 두 자릿수 성장을 기록하고 있습니다. 일본과 한국의 OEM 업체들은 판매 후 연결 중개를 지원하기 위해 eSIM/iSIM 모듈을 탑재하고 있으며, 이로 인해 통신 사업자에 의존하지 않는 관리 콘솔에 대한 지역적 수요가 증가하고 있습니다. 유럽에서는 GDPR(EU 개인정보보호규정)(일반 데이터 보호 규정)과 사이버 복원력법에 따라 엄격한 취약점 패치 적용 체제가 의무화되어 있어 큰 점유율을 차지하고 있습니다. 이러한 규제로 인해 의존 관계 매핑 및 암호학적으로 검증 가능한 OTA 파이프라인을 제공하는 벤더가 우위를 점하고 있습니다.
중동 및 아프리카의 신흥 지역에서는 유전 원격 계측 및 유틸리티 원격 검침에 위성 보완형 LoRaWAN을 채택함으로써 기존 M2M을 비약적으로 능가하고 있습니다. 남미에서의 보급 확대는 주파수 대역 자유화와 유틸리티 현대화 프로그램과 밀접한 관련이 있으며, 브라질에서는 600만 대의 스마트 계량기를 대상으로 한 AMI 프로젝트의 시범 운영이 진행되고 있습니다. 모든 지역에서 소버린 클라우드 요구 사항이 현지화된 제어 플레인의 도입을 촉진하고 있으며, 세계 하이퍼스케일러와 국내 데이터센터 사업자간의 제휴를 뒷받침하고 있습니다.
기타 혜택
- 엑셀 형식 시장 예측(ME) 시트
- 3개월간의 애널리스트 지원
자주 묻는 질문
목차
제1장 서론
제2장 조사 방법
제3장 주요 요약
제4장 시장 구도
제5장 시장 규모 및 성장 예측
제6장 경쟁 구도
제7장 시장 기회 및 향후 전망
AJY 26.09.11According to Mordor Intelligence, the IoT device management market size was valued at USD 8.79 billion in 2025 and estimated to grow from USD 10.66 billion in 2026 to reach USD 27.94 billion by 2031, at a CAGR of 21.26% during the forecast period (2026-2031).
This report is Segmented by Component (Solutions and Services), Deployment Type (Cloud, On-Premise, and More), Connectivity Technology (Cellular [2G/3G/4G/5G], LPWAN [NB-IoT, Lorawan, Sigfox], and More), Organization Size (Small and Medium-Sized Enterprises and Large Enterprises), by End-User Vertical (Manufacturing, Transportation and Logistics, Healthcare and Life Sciences, and More), and Geography.
Global IoT Device Management Market Trends and Insights
Proliferation of IoT Endpoints Driving Lifecycle-Management Demand
Global connected-device counts will exceed 75 billion units by 2030, overwhelming traditional IT oversight models and elevating centralized orchestration as a board-level requirement. Factory floors now deploy thousands of heterogeneous sensors that demand automated provisioning, continuous observability, and over-the-air (OTA) firmware governance. Platform engineering teams are standardizing automation templates and security baselines in order to harmonize multi-vendor fleets and ensure auditability across jurisdictions.
Heightened Security and Compliance Mandates for Device Fleets
The EU Cyber Resilience Act, enacted in 2024, mandates secure-by-design principles, software bills of materials, and continuous vulnerability management, with non-compliance fines up to EUR 15 million. Parallel directives in the United States and Japan, combined with the average 5,200 monthly attacks on IoT endpoints, are steering buyers toward platforms that embed zero-trust architectures and real-time threat detection. Thales reports that 55% of organizations now rank IoT security among their top three enterprise risks.
Fragmented Interoperability Standards
Although initiatives such as Matter and OPC UA promote common schemas, the absence of universal frameworks across industrial, consumer, and municipal domains forces enterprises to juggle multiple device-management portals. An MDPI study finds that 67% of multi-vendor deployments still rely on bespoke APIs, inflating integration costs and elongating time-to-value.
Other drivers and restraints analyzed in the detailed report include:
- Edge-Cloud Shift Requiring Unified OTA and Remote Diagnostics
- 5G and LPWAN Roll-outs Unlocking Hyperscale Connection Volumes
- Cross-border Data-Sovereignty Constraints
For complete list of drivers and restraints, kindly check the Table Of Contents.
Segment Analysis
Solutions held a commanding 70.35% share in 2025, anchored by modules for security, provisioning, and analytics. The segment is on track for a 21.90% CAGR as enterprises re-architect brownfield assets into policy-driven, cloud-native frameworks. Security management modules are the breakout sub-category, reflecting relentless compliance pressure. Services, at 29.65%, are edging ahead in growth (22.10% CAGR) as brownfield retrofits require systems integration and as-a-service management. Managed services resonate with SMEs that lack embedded engineering teams, while professional services drive complex, multi-factory rollouts. The convergence of the two components signals commoditization at the core platform level and shifts differentiation to vertical accelerators and AI co-pilots.
Cloud continues to dominate with 67.85% share in 2025, but latency-critical workloads are pushing compute to factory floors, utility substations, and roadside cabinets. Edge-native deployments are forecast to log a 26% CAGR, propelled by 5G MEC nodes and GPU-equipped gateways. Hybrid blueprints blend global cloud scalability with deterministic local control, ensuring firmware governance and anomaly detection even during backhaul outages. AI inferencing at the edge reduces raw data backhaul up to 75%, shrinking carbon footprints and lowering carrier fees. Vendors are embedding Kubernetes-compatible runtimes, enabling DevOps-style CI/CD pipelines for OTA firmware and container updates.
Complete Report Scope:
- By Component
- Solutions
- Security Management
- Device Provisioning and On-boarding
- OTA Firmware and Software Updates
- Remote Monitoring and Diagnostics
- Data Management and Analytics
- Services
- Professional Services
- Managed Services
- Solutions
- By Deployment Type
- Cloud
- On-premise
- Hybrid
- Edge-native
- By Connectivity Technology
- Cellular (2G/3G/4G/5G)
- LPWAN (NB-IoT, LoRaWAN, Sigfox)
- Wi-Fi/Bluetooth
- Satellite and Others
- By Organization Size
- Small and Medium-sized Enterprises
- Large Enterprises
- By End-user Vertical
- Manufacturing
- Transportation and Logistics
- Healthcare and Life Sciences
- Retail and E-commerce
- Energy and Utilities
- Smart Cities and Public Safety
- Agriculture
- Others
- By Geography
- North America
- United States
- Canada
- Mexico
- South America
- Brazil
- Argentina
- Rest of South America
- Europe
- Germany
- United Kingdom
- France
- Italy
- Spain
- Rest of Europe
- Asia-Pacific
- China
- Japan
- India
- South Korea
- Rest of Asia-Pacific
- Middle East and Africa
- Middle East
- United Arab Emirates
- Saudi Arabia
- Turkey
- Rest of Middle East
- Africa
- South Africa
- Nigeria
- Kenya
- Rest of Africa
- Middle East
- North America
Geography Analysis
North America captured 31.75% revenue in 2025, leveraging mature cloud ecosystems and early adoption in aerospace, automotive, and healthcare. Federal funding for smart-grid resilience and the National Cybersecurity Strategy further stimulates platform upgrades. Asia Pacific is the primary growth engine, expanding at a 24.10% CAGR as governments subsidize factory automation and smart-city rollouts. IDC projects 38.9 billion connected devices in the region by 2030, underpinned by widespread 5G Stand-Alone deployments that simplify SIM provisioning.
China dominates absolute volumes, yet India and Indonesia are posting double-digit growth as carriers light up NB-IoT networks across industrial corridors. Japanese and South Korean OEMs are embedding eSIM/iSIM modules to support post-sale connectivity brokering, fueling regional demand for carrier-agnostic management consoles. Europe holds a substantial share due to GDPR and the Cyber Resilience Act, which obligate rigorous vulnerability patching regimes. These mandates favor vendors offering dependency mapping and cryptographically verifiable OTA pipelines.
Emerging regions in the Middle East and Africa are leapfrogging legacy M2M by adopting satellite-augmented LoRaWAN for oil-field telemetry and remote utility metering. South America's adoption curve is tied to spectrum liberalization and utility modernization programs, with Brazil piloting AMI projects covering six million smart meters. Across all geographies, sovereign-cloud requirements are driving localized control planes, spurring partnerships between global hyperscalers and in-country data-center operators.
- Microsoft
- Amazon Web Services (AWS)
- IBM
- PTC
- Software AG
- Bosch.IO
- Cisco Systems
- Oracle
- Google Cloud
- Telit Cinterion
- Advantech
- Smith Micro Software
- Aeris Communications
- AVSystem
- Samsung Knox (Samsung Electronics)
- KORE Wireless
- Eseye
- EdgeIQ
- Huawei Technologies
- Arm
- ATandT
Additional Benefits:
- The market estimate (ME) sheet in Excel format
- 3 months of analyst support
TABLE OF CONTENTS
1 INTRODUCTION
- 1.1 Study Assumptions and Market Definition
- 1.2 Scope of the Study
2 RESEARCH METHODOLOGY
3 EXECUTIVE SUMMARY
4 MARKET LANDSCAPE
- 4.1 Market Overview
- 4.2 Market Drivers
- 4.2.1 Proliferation of IoT endpoints driving lifecycle-management demand
- 4.2.2 Heightened security and compliance mandates for device fleets
- 4.2.3 Edge-cloud shift requiring unified OTA and remote diagnostics
- 4.2.4 5G and LPWAN roll-outs unlocking hyperscale connection volumes
- 4.2.5 eSIM/iSIM-enabled dynamic connectivity sourcing
- 4.2.6 AI-driven self-healing and predictive maintenance of devices
- 4.3 Market Restraints
- 4.3.1 Fragmented interoperability standards
- 4.3.2 Cross-border data-sovereignty constraints
- 4.3.3 Carbon-footprint scrutiny of cloud back-ends
- 4.3.4 Scarcity of OT-IT integration talent
- 4.4 Value/Supply-Chain Analysis
- 4.5 Regulatory Landscape
- 4.6 Technological Outlook
- 4.7 Porter's Five Forces Analysis
- 4.7.1 Bargaining Power of Suppliers
- 4.7.2 Bargaining Power of Buyers
- 4.7.3 Threat of New Entrants
- 4.7.4 Threat of Substitutes
- 4.7.5 Intensity of Competitive Rivalry
5 MARKET SIZE AND GROWTH FORECASTS (VALUE)
- 5.1 By Component
- 5.1.1 Solutions
- 5.1.1.1 Security Management
- 5.1.1.2 Device Provisioning and On-boarding
- 5.1.1.3 OTA Firmware and Software Updates
- 5.1.1.4 Remote Monitoring and Diagnostics
- 5.1.1.5 Data Management and Analytics
- 5.1.2 Services
- 5.1.2.1 Professional Services
- 5.1.2.2 Managed Services
- 5.1.1 Solutions
- 5.2 By Deployment Type
- 5.2.1 Cloud
- 5.2.2 On-premise
- 5.2.3 Hybrid
- 5.2.4 Edge-native
- 5.3 By Connectivity Technology
- 5.3.1 Cellular (2G/3G/4G/5G)
- 5.3.2 LPWAN (NB-IoT, LoRaWAN, Sigfox)
- 5.3.3 Wi-Fi/Bluetooth
- 5.3.4 Satellite and Others
- 5.4 By Organization Size
- 5.4.1 Small and Medium-sized Enterprises
- 5.4.2 Large Enterprises
- 5.5 By End-user Vertical
- 5.5.1 Manufacturing
- 5.5.2 Transportation and Logistics
- 5.5.3 Healthcare and Life Sciences
- 5.5.4 Retail and E-commerce
- 5.5.5 Energy and Utilities
- 5.5.6 Smart Cities and Public Safety
- 5.5.7 Agriculture
- 5.5.8 Others
- 5.6 By Geography
- 5.6.1 North America
- 5.6.1.1 United States
- 5.6.1.2 Canada
- 5.6.1.3 Mexico
- 5.6.2 South America
- 5.6.2.1 Brazil
- 5.6.2.2 Argentina
- 5.6.2.3 Rest of South America
- 5.6.3 Europe
- 5.6.3.1 Germany
- 5.6.3.2 United Kingdom
- 5.6.3.3 France
- 5.6.3.4 Italy
- 5.6.3.5 Spain
- 5.6.3.6 Rest of Europe
- 5.6.4 Asia-Pacific
- 5.6.4.1 China
- 5.6.4.2 Japan
- 5.6.4.3 India
- 5.6.4.4 South Korea
- 5.6.4.5 Rest of Asia-Pacific
- 5.6.5 Middle East and Africa
- 5.6.5.1 Middle East
- 5.6.5.1.1 United Arab Emirates
- 5.6.5.1.2 Saudi Arabia
- 5.6.5.1.3 Turkey
- 5.6.5.1.4 Rest of Middle East
- 5.6.5.2 Africa
- 5.6.5.2.1 South Africa
- 5.6.5.2.2 Nigeria
- 5.6.5.2.3 Kenya
- 5.6.5.2.4 Rest of Africa
- 5.6.5.1 Middle East
- 5.6.1 North America
6 COMPETITIVE LANDSCAPE
- 6.1 Market Concentration
- 6.2 Strategic Moves
- 6.3 Market Share Analysis
- 6.4 Company Profiles {(includes Global level Overview, Market level overview, Core Segments, Financials as available, Strategic Information, Market Rank/Share for key companies, Products and Services, and Recent Developments)}
- 6.4.1 Microsoft
- 6.4.2 Amazon Web Services (AWS)
- 6.4.3 IBM
- 6.4.4 PTC
- 6.4.5 Software AG
- 6.4.6 Bosch.IO
- 6.4.7 Cisco Systems
- 6.4.8 Oracle
- 6.4.9 Google Cloud
- 6.4.10 Telit Cinterion
- 6.4.11 Advantech
- 6.4.12 Smith Micro Software
- 6.4.13 Aeris Communications
- 6.4.14 AVSystem
- 6.4.15 Samsung Knox (Samsung Electronics)
- 6.4.16 KORE Wireless
- 6.4.17 Eseye
- 6.4.18 EdgeIQ
- 6.4.19 Huawei Technologies
- 6.4.20 Arm
- 6.4.21 ATandT
7 MARKET OPPORTUNITIES AND FUTURE OUTLOOK
- 7.1 White-space and Unmet-Need Assessment


