|
시장보고서
상품코드
2124627
미국의 스마트홈 : 시장 점유율 분석, 업계 동향과 통계, 성장 예측(2026-2031년)United States Smart Homes - Market Share Analysis, Industry Trends & Statistics, Growth Forecasts (2026 - 2031) |
||||||
 Mordor Intelligence
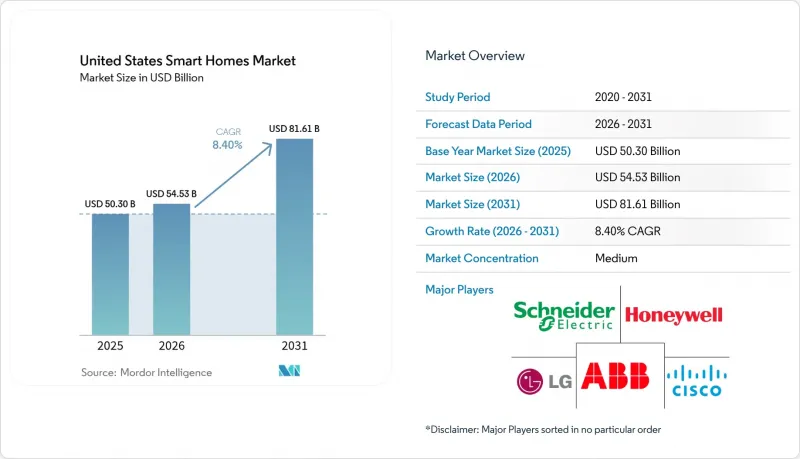
Mordor Intelligence에 의하면, 2026년 미국의 스마트홈 시장 규모는 545억 3,000만 달러로 추정되며, 2025년 503억 달러에서 2031년에는 816억 1,000만 달러에 달할 것으로 예측됩니다.
또한 2026-2031년 연평균 성장률(CAGR) 8.4%를 기록할 전망입니다.
본 보고서는 제품 유형(편의·조명, 에너지 관리, 기타), 연결 기술(Wi-Fi 지원 기기, Thread 지원 기기), 설치 유형(DIY/자가 설치, 전문가 설치 통합 시스템), 판매 채널(온라인 소매(아마존, 소비자 직접 판매),통신 및 유틸리티자의 번들(5G-FWA, 수요 반응 키트)) 및 구성 부품별로 분류되어 있습니다.
미국 스마트 홈 시장 동향 및 인사이트
유틸리티자가 지원하는 에너지 절약 리베이트 및 동적 가격 책정 프로그램
에너지부가 추진하는 88억 달러 규모의 ‘주택 에너지 리베이트’ 프로그램은 이미 캘리포니아주, 하와이주, 뉴멕시코주, 뉴욕주에서 시행되고 있으며, 주택 소유자에게 전례 없는 구매력을 직접 제공합니다. 2024년 5월 뉴욕주에서 시작된 이 프로그램은 스마트 온도 조절기, 히트 펌프, 커넥티드 온수기를 위한 연방 정부 자금을 확보하고자 하는 각 주의 선구자가 되었습니다. 서던 캘리포니아 에디슨(SCE)은 현재 인증된 온도 조절기를 수요 반응(Demand Response) 제도에 등록한 주택 소유주에게 75달러의 청구액 공제를 제공합니다. 한편, PSEG 롱아일랜드는 커넥티드 기기에 중점을 둔 2025년 에너지 절약 대책에 9,245만 달러를 배정했습니다. 위스콘신주의 ‘포커스 온 에너지(Focus on Energy)’ 프로그램에 1억 4,900만 달러의 예산이 배정된 것은 추운 지역에서도 피크 부하를 억제하기 위해 커넥티드 기기에 크게 의존하고 있음을 보여줍니다. 전력 회사는 피크 시간대 발전 비용 절감을 통해 얻은 절감분을 더 광범위한 리베이트 자금에 재투자함으로써, 도입을 촉진하는 선순환을 만들어내고 있습니다.
Matter 프로토콜의 급속한 보급이 다중 브랜드 단말기의 번들화를 촉진
2024년 11월에 공개된 Matter 1.4 사양은 통합된 다중 관리자 제어, 기기 클래스 확대, 네이티브 Thread 메쉬 지원이 융합된 획기적인 순간이었습니다. 2025년 중반까지 670개가 넘는 Thread 기반 제품이 인증을 획득했으며, 주요 소매업체들은 Matter 지원 기기 전용 진열 공간을 확보하겠다고 약속했습니다. 애플은 정책을 전환하여 HomeKit 독점에서 완전한 Matter 준수로 전환했습니다. 이러한 움직임은 생태계 전체의 합의를 시사하는 것이었습니다. 자가 복구 기능을 갖춘 Thread 네트워크 덕분에 서로 다른 브랜드의 기기도 재설정 없이 참여할 수 있게 되어, 높은 반품률의 원인이 되었던 기존의 복잡성이 해소되었습니다. 2025년 하반기에 예정된 버전 1.5에는 전력망과 연동되는 에너지 API가 통합되어, 주택은 수동적인 부하가 아닌 제어 가능한 수요 대응(demand response) 노드로 자리매김하게 될 것입니다.
뿌리 깊은 데이터 개인정보 보호 및 감시에 대한 우려
FCC는 2025년에 ‘사이버 트러스트 마크’를 발표했으나, 이 라벨의 부여는 여전히 선택 사항이므로 기기 제조업체는 소비자들이 종종 불투명하다고 느끼는 단계적 접근 방식을 자유롭게 채택할 수 있습니다. 캘리포니아주의 ‘소비자 개인정보 보호법’은 데이터 이용에 관한 명확한 공개를 의무화하고 있으며, 스마트 카메라, 스피커, 센서가 어떤 정보를 수집하고 있는지에 대한 대중의 인식을 높이고 있습니다. 2025년 3월, 아마존이 음성 데이터 저장과 관련된 옵트인 방식의 정책을 도입했을 때, 음성 비서의 기본 설정이 다시 한번 면밀한 검토 대상이 되었으며, 소셜 미디어상에서 거센 반발을 불러일으켰습니다. 업무용 IP 카메라는 여전히 FCC 라벨 적용 대상에서 제외되어 있어, 보안을 중시하는 가정들 사이에서 우려가 지속되고 있습니다. 가족 구성 또한 상황을 더욱 복잡하게 만들고 있습니다. 젊은 가족들은 자동화를 환영하는 반면, 고령자나 사생활 보호를 중시하는 가족들은 24시간 감시를 사생활 침해로 간주할 수 있습니다.
부문 분석
2025년 미국 스마트 홈 시장 지출 중 보안 시스템이 29.30%를 차지하고 있어, 소비자들이 본능적으로 개인의 안전과 재산 보호를 최우선으로 여긴다는 사실이 부각되고 있습니다. 초기 도입은 보험 할인 프로그램에 포함된 카메라나 비디오 도어벨에서 시작되는 경우가 많으며, 이는 더 광범위한 생태계로 나아가는 발판이 됩니다. 한편, 스마트 가전제품은 가장 빠른 성장이 예상되며, Matter를 통한 브랜드 간 호환성과 에너지 스타(Energy Star) 인증 제품에 대한 유틸리티체의 리베이트 확대를 배경으로 연평균 성장률(CAGR) 14.25%를 기록할 전망입니다. 에너지 관리 패키지, 특히 동적 가격 책정 제도와 연동된 스마트 온도 조절기는 연방 및 주 정부의 인센티브 혜택을 지속적으로 받고 있습니다. 홈 엔터테인먼트 기기는 성숙기에 접어들었지만, 대형 디스플레이 상에서 통합된 자동화 대시보드 역할을 함으로써 여전히 꾸준한 성장을 이어가고 있습니다.
소비자들이 통합된 제어를 중요시하게 되면서, 기존에는 서로 분리되어 있던 카테고리 간의 경계가 점차 좁혀지고 있습니다. 카메라에는 조명 장면과 연동되는 AI 분석 기능이 내장되고, 냉장고에는 에너지 관리 루틴과 연동된 실시간 동적 가격 책정에 대한 알림이 표시되도록 되어 있습니다. 전반적으로 하드웨어 융합이 진행됨에 따라 플랫폼의 기능이 단일 기능 기기를 능가하게 되며, 향후 5년 동안 제품 구분이 모호해질 것이라는 전망이 강해지고 있습니다.
2025년에는 라우터의 높은 보급률과 간편한 설정 덕분에 Wi-Fi 지원 기기의 출하 대수가 전체의 60.35%를 차지했습니다. 그러나 Thread 사양은 2031년까지 연평균 성장률(CAGR) 18.1%로 성장하여 상당한 시장 점유율을 확보할 전망입니다. 최신 버전 1.4에서는 통합된 메시 기능이 제공되어, 사용자의 조작 없이도 여러 벤더의 경계 라우터가 단일 네트워크를 형성할 수 있게 되었습니다. Thread의 저전력 IPv6 기반 아키텍처 덕분에 센서는 보안 및 에너지 관리에 필수적인 실시간 통신 루프에 참여하고 있는 동안에도 수년 단위의 배터리 수명을 유지할 수 있습니다.
Thread와 Wi-Fi의 융합은 현재 상호 보완적인 관계에 있습니다. 스트리밍 카메라와 같은 고대역폭 용도는 여전히 Wi-Fi에 의존하고 있는 반면, 저대역폭 도어 센서, 누수 감지기, 버튼 등은 Thread로 전환되고 있습니다. Apple의 tvOS 26, Google의 Fuchsia 기반 Nest Hub, Amazon의 Echo Hub 펌웨어는 모두 Thread 보더 라우터 기능을 기본 탑재하고 있으며, 이는 Thread가 주류로 자리 잡았음을 보여줍니다. Thread Group은 2025년 6월까지 670건 이상의 인증을 획득하여, 이 생태계가 중요한 성숙의 고비를 넘었음이 확인되었습니다.
기타 혜택:
- 엑셀 형식 시장 예측(ME) 시트
- 3개월간의 애널리스트 지원
자주 묻는 질문
목차
제1장 서론
제2장 조사 방법
제3장 주요 요약
제4장 시장 구도
제5장 시장 규모와 성장 예측
제6장 경쟁 구도
제7장 시장 기회와 향후 전망
LSHAccording to Mordor Intelligence, the United States smart homes market size in 2026 is estimated at USD 54.53 billion, growing from 2025 value of USD 50.30 billion with 2031 projections showing USD 81.61 billion, growing at 8.4% CAGR over 2026-2031.
This report is Segmented by Product Type (Comfort and Lighting, Energy Management, and More), Connectivity Technology(Wi-Fi-Enabled Devices, Thread-Enabled Devices), Installation Type (DIY / Self-Installed, Professionally Installed Integrated Systems), Sales Channel (Online Retail (Amazon, Direct-To-Consumer), Telecom / Utility Bundles (5G-FWA, Demand-Response Kits)), and Component.
United States Smart Homes Market Trends and Insights
Utility-backed Energy-Efficiency Rebates and Dynamic-Pricing Programs
The Department of Energy's USD 8.8 billion Home Energy Rebates program-already live in California, Hawaii, New Mexico, and New York-has placed unprecedented purchasing power directly in homeowners' hands.New York's May 2024 roll-out set the tone for states eager to capture federal dollars for smart thermostats, heat pumps, and connected water heaters. Southern California Edison now offers USD 75 bill credits for enrolling certified thermostats in demand-response schemes, while PSEG Long Island earmarked USD 92.45 million for 2025 efficiency measures focused on connected devices. Wisconsin's USD 149 million allocation under its Focus on Energy program shows that even colder climates are leaning heavily on connected equipment to curb peak loads. Utilities then recycle the savings they achieve on peak-generation costs into broader rebate pools, thereby creating a virtuous adoption cycle.
Rapid Adoption of Matter Protocol Driving Multi-brand Device Bundles
Matter's 1.4 specification, published in November 2024, was the watershed moment when unified multi-admin control, expanded device classes, and native Thread mesh support converged. Over 670 Thread-based products had cleared certification by mid-2025, and major retailers pledged dedicated shelf space to Matter-ready gear. Apple reversed course, shifting from HomeKit exclusivity to full Matter compliance, a move that signaled ecosystem consensus. Self-healing Thread networks now allow devices from different brands to join without re-commissioning, erasing historical complexities that drove high return rates. Version 1.5, expected in late 2025, will embed grid-interactive energy APIs, positioning residences as dispatchable demand-response nodes rather than passive loads.
Persistent Data-Privacy and Surveillance Concerns
Although the FCC unveiled the Cyber Trust Mark in 2025, labeling remains voluntary, leaving device makers free to adopt tiered approaches that consumers often find opaque. California's Consumer Privacy Act requires explicit disclosure of data use, elevating public awareness about what smart cameras, speakers, and sensors collect. Voice-assistant defaults drew renewed scrutiny when Amazon introduced an opt-in voice data retention policy in March 2025, igniting social-media backlash. Professional-grade IP cameras remain outside the FCC label's scope, perpetuating concerns among security-sensitive households. Family dynamics further complicate matters: younger residents may welcome automation, while older or privacy-conscious members view 24-hour monitoring as intrusive.
Other drivers and restraints analyzed in the detailed report include:
- Aging-in-Place and "Age-Tech" Demand Accelerating Retrofit Spending
- Insurance Premium Discounts for Smart Security Installations
- High Professional-Installation Cost for Legacy Housing Stock
For complete list of drivers and restraints, kindly check the Table Of Contents.
Segment Analysis
Security systems accounted for a 29.30% share of 2025 spending within the United States smart homes market, underlining consumers' instinctive prioritization of personal safety and property protection. Early adoption often begins with cameras or video doorbells bundled into insurance discount programs, which then serve as launchpads for broader ecosystems. Smart appliances, however, are poised for the fastest lift, tracking a 14.25% CAGR on the strength of Matter-enabled cross-brand compatibility and escalating utility rebates on energy-star units. Energy-management packages-particularly smart thermostats linked to dynamic pricing schemes-continue benefiting from federal and state incentives. Home-entertainment devices, while maturing, still find incremental gains by acting as centralized automation dashboards on large-screen displays.
Consumer emphasis on unified control is closing the gap between historically siloed categories. Cameras now embed AI analytics that cooperate with lighting scenes, while refrigerators surface real-time dynamic-pricing prompts that mesh with energy-management routines. All told, hardware convergence reinforces the view that product labels will blur over the next five years as platform capabilities outpace single-function devices.
Wi-Fi controlled 60.35% of device shipments in 2025, buoyed by widespread router penetration and low incremental setup friction. Yet the Thread specification is on pace to carve out a substantial share, growing at an 18.1% CAGR to 2031. The latest 1.4 build delivers unified mesh capability, enabling multiple vendor border routers to form a single network without user intervention. Thread's low-power, IPv6-based architecture allows sensors to sustain multi-year battery life even while participating in real-time communication loops essential for security and energy management.
The convergence between Thread and Wi-Fi is now complementary: high-bandwidth applications such as streaming cameras still rely on Wi-Fi, whereas low-bandwidth door sensors, leak detectors, and buttons migrate to Thread. Apple's tvOS 26, Google's Fuchsia-based Nest hubs, and Amazon's Echo Hub firmware all ship with Thread border-router functionality, signaling mainstream endorsement. The Thread Group surpassed 670 certifications by June 2025, confirming that the ecosystem has passed a critical maturity threshold.
Complete Report Scope:
- By Product Type
- Comfort and Lighting
- Control and Connectivity
- Energy Management
- Home Entertainment
- Security
- Smart Appliances
- By Connectivity Technology
- Wi-Fi-enabled devices
- Thread-enabled devices
- By Installation Type
- DIY / Self-installed
- Professionally installed integrated systems
- By Sales Channel
- Online retail (Amazon, direct-to-consumer)
- Telecom / Utility bundles (5G-FWA, demand-response kits)
- By Component
- Hardware (devices and hubs)
- Subscription and monitoring services
List of Companies Covered in this Report:
- ABB Ltd.
- Schneider Electric SE
- Honeywell International Inc.
- Nest Labs (Google)
- Ring (Amazon)
- LG Electronics Inc.
- Cisco Systems Inc.
- Google LLC (Alphabet Inc.)
- Microsoft Corp.
- GE Appliances (Haier Group)
- Legrand SA
- Lutron Electronics Co. Inc.
- Whirlpool Corp.
- Control4 Corp.
- Savant Systems Inc. (GE Lighting)
Additional Benefits:
- The market estimate (ME) sheet in Excel format
- 3 months of analyst support
TABLE OF CONTENTS
1 INTRODUCTION
- 1.1 Study Assumptions and Market Definition
- 1.2 Scope of the Study
2 RESEARCH METHODOLOGY
3 EXECUTIVE SUMMARY
4 MARKET LANDSCAPE
- 4.1 Market Overview
- 4.2 Market Drivers
- 4.2.1 Utility-backed energy-efficiency rebates and dynamic-pricing programs
- 4.2.2 Rapid adoption of Matter protocol driving multi-brand device bundles
- 4.2.3 Aging-in-place and age-tech demand accelerating retrofit spending
- 4.2.4 Insurance premium discounts for smart security installations
- 4.2.5 5G FWA bundles from ISPs lowering entry barriers for hubs/kits
- 4.3 Market Restraints
- 4.3.1 Persistent data-privacy and surveillance concerns
- 4.3.2 High professional-installation cost for legacy housing stock
- 4.3.3 Device return-rates caused by lingering interoperability gaps
- 4.3.4 Rising cyber-compliance costs under forthcoming U.S. Cyber-Trust Mark
- 4.4 Value/Supply-Chain Analysis
- 4.5 Regulatory Landscape
- 4.6 Technological Outlook
- 4.7 Porter's Five Forces
- 4.7.1 Bargaining Power of Suppliers
- 4.7.2 Bargaining Power of Consumers
- 4.7.3 Threat of New Entrants
- 4.7.4 Threat of Substitute Products
- 4.7.5 Intensity of Competitive Rivalry
5 MARKET SIZE AND GROWTH FORECASTS (VALUE)
- 5.1 By Product Type
- 5.1.1 Comfort and Lighting
- 5.1.2 Control and Connectivity
- 5.1.3 Energy Management
- 5.1.4 Home Entertainment
- 5.1.5 Security
- 5.1.6 Smart Appliances
- 5.2 By Connectivity Technology
- 5.2.1 Wi-Fi-enabled devices
- 5.2.2 Thread-enabled devices
- 5.3 By Installation Type
- 5.3.1 DIY / Self-installed
- 5.3.2 Professionally installed integrated systems
- 5.4 By Sales Channel
- 5.4.1 Online retail (Amazon, direct-to-consumer)
- 5.4.2 Telecom / Utility bundles (5G-FWA, demand-response kits)
- 5.5 By Component
- 5.5.1 Hardware (devices and hubs)
- 5.5.2 Subscription and monitoring services
6 COMPETITIVE LANDSCAPE
- 6.1 Market Concentration
- 6.2 Strategic Moves
- 6.3 Market Share Analysis
- 6.4 Company Profiles (includes Global level Overview, Market level overview, Core Segments, Financials as available, Strategic Information, Market Rank/Share for key companies, Products and Services, and Recent Developments)
- 6.4.1 ABB Ltd.
- 6.4.2 Schneider Electric SE
- 6.4.3 Honeywell International Inc.
- 6.4.4 Nest Labs (Google)
- 6.4.5 Ring (Amazon)
- 6.4.6 LG Electronics Inc.
- 6.4.7 Cisco Systems Inc.
- 6.4.8 Google LLC (Alphabet Inc.)
- 6.4.9 Microsoft Corp.
- 6.4.10 GE Appliances (Haier Group)
- 6.4.11 Legrand SA
- 6.4.12 Lutron Electronics Co. Inc.
- 6.4.13 Whirlpool Corp.
- 6.4.14 Control4 Corp.
- 6.4.15 Savant Systems Inc. (GE Lighting)
7 MARKET OPPORTUNITIES AND FUTURE OUTLOOK
- 7.1 White-space and Unmet-need Assessment