|
시장보고서
상품코드
2124646
아프리카의 통신 타워 및 관련 설비 시장 : 시장 점유율 분석, 업계 동향 및 통계, 성장 예측(2026-2031년)Africa Telecom Towers And Allied - Market Share Analysis, Industry Trends & Statistics, Growth Forecasts (2026 - 2031) |
||||||
 Mordor Intelligence
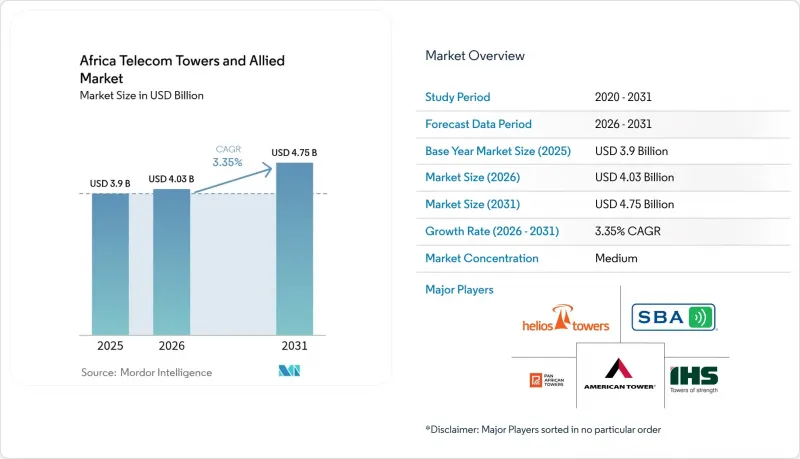
Mordor Intelligence에 의하면, 2026년 아프리카의 통신 타워 및 관련 설비 시장 규모는 40억 3,000만 달러로 추정되고 2025년 39억 달러에서 확대해, 2031년에는 47억 5,000만 달러에 이를 것으로 예측됩니다.
2026년부터 2031년까지 연평균 성장률(CAGR) 3.35%로 성장할 것으로 전망됩니다.

본 보고서는 소유 형태(통신 사업자 소유, 독립 타워 회사, 기타), 설치 형태(옥상 설치, 지상 설치), 연료 유형(재생 에너지, 전력망/디젤 하이브리드), 타워 유형(모노폴, 래티스, 가이와이어식, 스텔스/은폐형), 그리고 국가별로 분류되어 있습니다. 시장 예측은 금액(달러) 및 수량(설치 대수)의 관점에서 제시되어 있습니다.
아프리카의 통신 타워 및 관련 설비 시장 동향 및 인사이트
범아프리카 MNO에 의한 4G/5G 구축 가속화
범아프리카 모바일 네트워크 사업자들은 2024년 및 2025년 초에 수백 곳의 5G 기지국을 증설하여, 사하라 이남 아프리카의 5G 가입자 총수를 에릭슨이 2030년까지 예측한 4억 2,000만 건으로 끌어올렸습니다. MTN 그룹만 해도 5G 구축 범위를 3,000곳 이상으로 확대함에 따라, 아프리카의 통신 타워 시장 전체에서 코로케이션 수요가 급증하고 있습니다. 기지국의 밀집화는 특히 라고스, 나이로비, 요하네스버그에서 시급한 과제가 되고 있으며, 이 지역에서는 5G 미드밴드 주파수 대역의 사용에 따라 기지국 간 간격을 좁혀야 합니다. 독립 타워 기업들은 이러한 시급성을 활용하여, 기존 4G 네트워크에서 전환을 추진하는 통신 사업자들 시장 출시 시간을 단축해 주는 턴키 방식의 맞춤형 건설 프로그램을 제공합니다. 이러한 추세는 최근 튀니지에서 5G 상용 서비스가 시작됨에 따라 더욱 강화되고 있으며, 차세대 연결성에 대한 지역 전체의 강력한 의지를 여실히 보여주고 있습니다.
데이터 소비량 및 스마트폰 보급률 증가
동영상 스트리밍, 소셜 미디어, 모바일 결제로 인해 북아프리카 및 서아프리카 전역에서 가입자 1인당 데이터 사용량은 두 자릿수 기가바이트 규모로 증가했습니다. 젊은 층 증가와 저가형 스마트폰의 수입이 이러한 수요 곡선을 뒷받침하고 있으며, 통신 사업자들은 당초 예산보다 빠른 속도로 용량을 증설할 수밖에 없는 상황입니다. 데이터 통신량 증가에 따라 사이트당 임대 가능한 안테나 수가 늘어나면서, 아프리카의 통신 타워 시장 전체에서 주요 도시권의 임차인 비율이 1.5배에서 2배로 상승했습니다. 그 결과, 타워 운영사는 더 높은 하중 지지 능력과 광섬유 대응 백홀을 갖춘 미래 지향적인 구조를 구축할 동기를 얻게 되었으며, 데이터 집약형 서비스가 보급되는 가운데 수익 확대를 확보하고 있습니다.
환율 변동과 높은 국가 신용 리스크
수익의 대부분은 현지 통화로 표시되지만, 부채와 설비 투자는 여전히 달러에 연동되어 있어 통화 약세 시 타워 운영사는 막대한 환산 손실을 입을 위험에 노출되어 있습니다. IHS Towers는 2024년 몇몇 아프리카 시장에서 현저한 환율 역풍을 보고하며, 거시경제 사이클에 대한 높은 민감도를 여실히 드러냈습니다. 국가 신용등급 하향 조정은 금리 상승을 유발하여 신규 건설의 실현 가능성을 저해하거나 차입금 재융자 노력을 지연시킬 가능성이 있습니다. 통신 사업자와 타워 기업들은 달러 지수 연동형 임대료 인상 조항 등 자연스러운 헤지 수단을 점점 더 모색하고 있지만, 외화 표시 청구에 대한 규제 상한선으로 인해 그 도입은 여전히 제한적입니다.
부문별 분석
독립 타워 기업들은 2025년 아프리카의 통신 타워 시장에서 45.18%의 점유율을 차지했으며, 2031년까지 연평균 성장률(CAGR) 6.53%로 성장할 전망입니다. 이러한 뛰어난 수익률은 92.4%라는 높은 가동률과 환율 리스크 및 규제 리스크를 완화하는 다양한 국가별 포트폴리오에 기인합니다. 인프라 공유에 제약이 있는 시장에서는 통신 사업자가 소유한 자산이 여전히 존재하지만, 대차대조표 경량화 전략이 정착됨에 따라 자산을 현금화해야 하는 압박이 커지고 있습니다. 현재 진행 중인 자산 매각 건이 예정대로 성사된다면, 독립 타워 기업의 아프리카의 통신 타워 시장 규모는 2031년까지 연간 임대 수익 기준 20억 7,000만 달러를 넘어설 가능성이 있습니다.
네트워크 통제가 최우선시되는 정치적으로 민감한 지역에서는 통신 사업자(MNO)가 소유한 사이트가 여전히 중요하지만, 자금 사정에 어려움을 겪는 통신 사업자들은 5G 주파수 사용료 조달을 위해 세일 앤 리스백(Sale-and-Leaseback) 방식을 점점 더 선호하고 있습니다. 합작 투자 타워 기업들은 능동형 부문에서의 차별화를 희생하지 않으면서도, 경쟁사들이 수동형 설비에 공동 투자할 수 있는 중간적인 경로를 제공합니다. 아메리칸 타워의 선택적 진입 전략은 복잡한 대도시권에서 세계 전문 기업들이 누리는 이익률 우위를 뒷받침하고 있으며, 이러한 추세는 아프리카의 통신 타워 업계 전반의 통합을 가속화할 가능성이 높습니다.
2025년, 지상 설치형 타워는 아프리카의 통신 타워 시장 규모의 76.20%를 차지했으며, 교외 및 농촌 지역의 매크로 커버리지에서 비용 대비 효과가 높은 것으로 입증되었습니다. 옥상 설치는 절대적인 설치 면적은 작지만, 인구 밀도가 높은 비즈니스 지구에서 5G 미드밴드 주파수에 대응하기 위해 더 촘촘한 그리드 간격이 요구됨에 따라 연평균 성장률(CAGR) 7.34%로 확대되고 있습니다. 지자체 경관 지침과 지가 급등으로 인해 나이로비, 카사블랑카, 요하네스버그의 중심부에서는 옥상 설치가 유일한 실용적인 선택지가 되고 있습니다.
지상 설치형 타워는 안테나의 부하 용량이 크고 재생에너지로의 사후 개조가 용이하기 때문에 사이트당 절대 수익은 여전히 높은 수준을 유지하고 있습니다. 반면, 옥상 설치형은 허가 취득이 신속하고 토목 공사비 절감이 기대되므로, 타워 운영사는 기존 커버리지 구역 내에서 증분 수익을 확보할 수 있습니다. 이러한 사이트 유형의 미묘한 조합을 통해 데이터 트래픽 패턴이 변화하더라도 아프리카의 통신 타워 시장은 유연성을 유지할 수 있을 것입니다.
기타 혜택 :
- 엑셀 형식 시장 예측(ME) 시트
- 3개월간의 애널리스트 지원
자주 묻는 질문
목차
제1장 서론
제2장 조사 방법
제3장 주요 요약
제4장 시장 구도
제5장 시장 규모 및 성장 예측
제6장 경쟁 구도
제7장 시장 기회 및 향후 전망
KTH 26.09.14According to Mordor Intelligence, the Africa telecom towers and allied market size in 2026 is estimated at USD 4.03 billion, growing from 2025 value of USD 3.9 billion with 2031 projections showing USD 4.75 billion, growing at 3.35% CAGR over 2026-2031.
This report is Segmented by Ownership (Operator-Owned, Independent TowerCo, and More), Installation (Rooftop, Ground-Based), Fuel Type (Renewable-Powered, Grid/Diesel Hybrid), Tower Type (Monopole, Lattice, Guyed, Stealth/Concealed), and Country. The Market Forecasts are Provided in Terms of Value (USD) and Volume (Installed Base).
Africa Telecom Towers And Allied Market Trends and Insights
Accelerated 4G/5G rollout by pan-African MNOs
Pan-African mobile network operators added hundreds of 5G sites in 2024 and early 2025, lifting total 5G subscriptions in Sub-Saharan Africa toward Ericsson's 420 million projection for 2030 . MTN Group alone expanded its 5G footprint to more than 3,000 sites, prompting a surge in colocation requests across the Africa telecom tower market . The densification imperative is especially acute in Lagos, Nairobi, and Johannesburg, where 5G mid-band spectrum requires closer site spacing. Independent TowerCos capitalize on this urgency by offering turnkey build-to-suit programs that shorten time-to-market for operators migrating from legacy 4G networks. The momentum is reinforced by the recent commercial 5G launch in Tunisia, underscoring the broad regional commitment to next-generation connectivity .
Rising data consumption and smartphone penetration
Video streaming, social media, and mobile payments are elevating per-subscriber data use into double-digit gigabyte ranges across North and West Africa. Young demographics and low-cost smartphone imports sustain this demand curve, compelling operators to add capacity faster than originally budgeted. Higher data volumes translate into larger leaseable antenna counts per site, pushing tenancy ratios across the Africa telecom tower market from 1.5x toward 2x in core metros. TowerCos are therefore incentivized to future-proof structures with stronger load capacities and fiber-ready backhaul, ensuring revenue upside as data-heavy services proliferate.
Volatile foreign-exchange and high sovereign risk
Revenue is largely denominated in local currencies, but debt and capex remain USD-linked, exposing TowerCos to material conversion losses during currency depreciations. IHS Towers reported notable FX headwinds in several African markets during 2024, underscoring sensitivity to macroeconomic cycles. Sovereign credit downgrades trigger higher interest rates that can render new builds unviable or slow refinancing efforts. Operators and TowerCos are increasingly exploring natural hedges such as USD-indexed lease escalators, but uptake remains limited by regulatory caps on foreign-currency billing.
Other drivers and restraints analyzed in the detailed report include:
- Government-led rural coverage mandates and universal service funds
- Asset-light network strategies by MNOs boosting tower outsourcing
- Lengthy permitting and land-acquisition bottlenecks
For complete list of drivers and restraints, kindly check the Table Of Contents.
Segment Analysis
Independent TowerCos commanded 45.18% of the Africa telecom tower market share in 2025 and are on track for a 6.53% CAGR through 2031. The superior returns stem from 92.4% utilization rates and diversified country portfolios that smooth FX and regulatory risk. Operator-owned assets persist in markets with infrastructure-sharing constraints, but monetization pressure is rising as balance-sheet light strategies take hold. The Africa telecom tower market size for Independent TowerCos could exceed USD 2.07 billion in annual lease revenue by 2031 if current divestiture pipelines close on schedule.
MNO captive sites remain critical in politically sensitive geographies where network control is paramount; however, cash-strapped operators increasingly favor sale-leasebacks to fund 5G spectrum fees. Joint-venture TowerCos offer a middle path, letting rivals co-invest in passive plant without sacrificing active-layer differentiation. American Tower's selective entry strategy validates the margin advantage enjoyed by global specialists in complex metros, a dynamic likely to accelerate consolidation across the Africa telecom tower industry.
Ground-based towers held 76.20% of the Africa telecom tower market size in 2025, proving cost-effective for suburban and rural macro coverage. Rooftop installations, though smaller in absolute footprint, are gaining a 7.34% CAGR as 5G mid-band frequencies demand tighter grid spacing in densely populated business districts. Municipal aesthetic guidelines and mounting land prices make rooftops the only viable option in central Nairobi, Casablanca, and Johannesburg.
Ground-based towers still deliver higher absolute revenue per site thanks to greater antenna load capacity and ease of renewable-power retrofits. Yet rooftops promise faster permitting and reduced civil works expenditure, allowing TowerCos to capture incremental revenue within established coverage zones. This nuanced mix of site types ensures the Africa telecom tower market remains flexible as data-traffic patterns evolve.
Complete Report Scope:
- By Ownership
- Operator-owned
- Independent TowerCo
- Joint-Venture TowerCo
- MNO Captive
- By Installation
- Rooftop
- Ground-based
- By Fuel Type
- Renewable-powered
- Grid/Diesel Hybrid
- By Tower Type
- Monopole
- Lattice
- Guyed
- Stealth / Concealed
- By Country
- Algeria
- Kenya
- Morocco
- South Africa
- Nigeria
- Ghana
- Egypt
- Tanzania
- Rest of Africa (Tunisia, Uganda, Zambia, Senegal, and Others)
List of Companies Covered in this Report:
- TowerCos
- Mobile Network Operator
Additional Benefits:
- The market estimate (ME) sheet in Excel format
- 3 months of analyst support
TABLE OF CONTENTS
1 INTRODUCTION
- 1.1 Study Assumptions and Market Definition
- 1.2 Scope of the Study
- 1.3 Taxonomy
2 RESEARCH METHODOLOGY
3 EXECUTIVE SUMMARY
- 3.1 Telecom Tower Volume Estimates (Units, 2023-2030)
- 3.2 Telecom Tower Leasing Revenue Estimates (USD, 2023-2030)
- 3.3 Telecom Tower Construction Revenue Estimates (USD, 2023-2030)
4 MARKET LANDSCAPE
- 4.1 Market Overview
- 4.2 Market Drivers
- 4.2.1 Accelerated 4G/5G rollout by pan-African MNOs
- 4.2.2 Rising data consumption and smartphone penetration
- 4.2.3 Government-led rural coverage mandates and universal service funds
- 4.2.4 Asset-light network strategies by MNOs boosting tower outsourcing
- 4.2.5 Green financing incentives for renewable power retrofits
- 4.2.6 Expansion of neutral-host indoor DAS and small-cell backhaul demand
- 4.3 Market Restraints
- 4.3.1 Volatile foreign-exchange and high sovereign risk
- 4.3.2 Lengthy permitting and land-acquisition bottlenecks
- 4.3.3 Diesel supply disruptions raising opex at off-grid sites
- 4.3.4 Fiber backhaul deficits limiting tenancy ratios in secondary cities
- 4.4 Ecosystem Analysis
- 4.5 Regulatory Landscape Related to Telecom Infrastructure
- 4.6 Technological Outlook
- 4.7 Porter's Five Forces Analysis
- 4.7.1 Bargaining Power of Suppliers
- 4.7.2 Bargaining Power of Buyers
- 4.7.3 Threat of New Entrants
- 4.7.4 Threat of Substitutes
- 4.7.5 Intensity of Competitive Rivalry
- 4.8 Impact of Macroeconomic Factors on the Market
5 MARKET SIZE AND GROWTH FORECASTS (VALUE AND VOLUME)
- 5.1 By Ownership
- 5.1.1 Operator-owned
- 5.1.2 Independent TowerCo
- 5.1.3 Joint-Venture TowerCo
- 5.1.4 MNO Captive
- 5.2 By Installation
- 5.2.1 Rooftop
- 5.2.2 Ground-based
- 5.3 By Fuel Type
- 5.3.1 Renewable-powered
- 5.3.2 Grid/Diesel Hybrid
- 5.4 By Tower Type
- 5.4.1 Monopole
- 5.4.2 Lattice
- 5.4.3 Guyed
- 5.4.4 Stealth / Concealed
- 5.5 By Country
- 5.5.1 Algeria
- 5.5.2 Kenya
- 5.5.3 Morocco
- 5.5.4 South Africa
- 5.5.5 Nigeria
- 5.5.6 Ghana
- 5.5.7 Egypt
- 5.5.8 Tanzania
- 5.5.9 Rest of Africa (Tunisia, Uganda, Zambia, Senegal, and Others)
6 COMPETITIVE LANDSCAPE
- 6.1 Market Concentration
- 6.2 Details of Major Mergers and Acquisitions
- 6.3 Market Share Analysis for top vendors
- 6.4 Company Profiles (includes Global level Overview, Market level overview, Core Segments, Financials, Strategic Information, Products and Services, Recent Developments)
- 6.4.1 TowerCos
- 6.4.1.1 American Tower Corporation
- 6.4.1.2 IHS Towers (IHS Holding Limited)
- 6.4.1.3 Helios Towers Plc
- 6.4.1.4 SBA Communications Corporation
- 6.4.1.5 Pan African Towers
- 6.4.1.6 Atlas Tower Group Limited
- 6.4.1.7 Eastcastle Infrastructure
- 6.4.1.8 Paradigm Infrastructure Limited
- 6.4.1.9 Hotspot Network Ltd
- 6.4.2 Mobile Network Operator
- 6.4.2.1 MTN Group
- 6.4.2.2 Vodacom Group
- 6.4.2.3 Airtel Africa plc
- 6.4.2.4 Orange Middle East and Africa
- 6.4.2.5 e& misr company
- 6.4.2.6 Safaricom PLC
- 6.4.2.7 Telkom SA SOC Limited
- 6.4.2.8 Globacom Limited (Glo)
- 6.4.2.9 Maroc Telecom SA
- 6.4.2.10 WE (Telecom Egypt)
- 6.4.2.11 Unitel Angola (Unitel SA)
- 6.4.2.12 Econet Wireless Zimbabwe Ltd.
- 6.4.2.13 Ethio Telecom
- 6.4.2.14 Movitel Mozambique (Movitel S.A.)
- 6.4.2.15 Moov Africa
- 6.4.2.16 Sonatel Senegal (Sonatel SA)
- 6.4.2.17 Yas Madagascar
- 6.4.1 TowerCos
7 MARKET OPPORTUNITIES AND FUTURE OUTLOOK
- 7.1 White-space and Unmet-need Assessment
- 7.2 Investment Analysis
- 7.3 Analyst Suggestions and Recommendations