
|
시장보고서
상품코드
2124796
미국의 수력발전 : 시장 점유율 분석, 업계 동향과 통계, 성장 예측(2026-2031년)United States Hydropower - Market Share Analysis, Industry Trends & Statistics, Growth Forecasts (2026 - 2031) |
||||||
 Mordor Intelligence
Mordor Intelligence에 의하면, 미국의 수력발전 시장 규모는 2025년에 102.27기가와트로 평가되었고, 2026년 102.72기가와트에서 2031년까지 104.98기가와트에 이를 것으로 예측되며, 예측 기간(2026-2031년) CAGR은 0.44%를 기록할 전망입니다. 또한, 0.44%의 연평균 복합 성장률(CAGR)를 기록할 것으로 추산되고 있습니다.
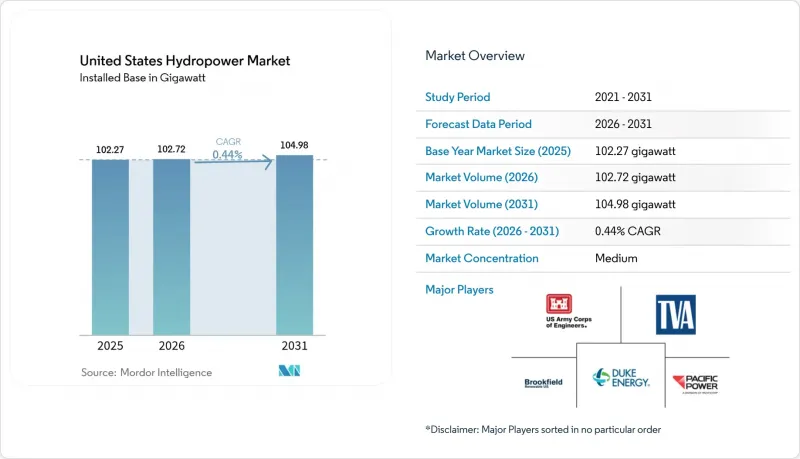
본 보고서는 발전 규모(대규모 수력, 중규모 수력, 소규모·마이크로 수력), 기술(저수지식, 유입식, 양수식, 하천 내식 및 마이크로 도관식), 그리고 최종 사용자(유틸리티, 독립발전사업자, 산업용 및 자가소비용)별로 분류되어 있습니다. 시장 규모 및 전망은 설비 용량(GW) 단위로 표시되어 있습니다.
미국 수력 발전 시장 동향 및 인사이트
연방 투자 세액 공제 연장
'인프라 투자 및 고용법'에 따라 현대화 비용의 최대 30%를 지원하는 직접 지급이 시행됨에 따라, 46곳의 발전소가 설비 용량을 늘리지 않고도 평균 14%의 효율 향상을 실현할 수 있게 되었습니다. 소유주는 24억 달러의 매칭 자금을 확보하고 있으며, 미국 수력 발전 시장에서는 새로운 댐 건설보다 러너 교체나 발전기 권선 교체와 같은 개보수가 선호되는 것으로 확인되었습니다. 자극기의 손실을 줄이고 가변속 거버너를 도입함으로써, 동일한 수력 조건 범위 내에서 연간 발전량을 증가시킬 수 있습니다. 이는 라이선싱 리스크를 무시할 수 있는 수준으로 억제하면서, 유량 1세제곱미터당 수익을 향상시키는 전략입니다. 세제상 지분은 신디케이트화가 가능하기 때문에 소규모 공영 전력 사업자도 이 세액 공제를 활용하고 있으며, 오랫동안 연기되어 왔던 발전소 부대 설비(BOP)의 갱신이 가속화되고 있습니다. 전반적으로 이 인센티브는 확장이 아닌 효율화를 통해 국내 에너지 공급량을 끌어올리고 있습니다.
DOE의 새로운 수력 발전 연구개발(RD&D) 자금 조달 파이프라인
수력발전기술국(Water Power Technologies Office)은 2024년, 디지털 트윈, 소나를 이용한 어류 감지, 양수 발전 최적화를 융합하는 프로젝트에 3,300만 달러를 배정했습니다. 퍼시픽 노스웨스트 국립연구소(PNNL)는 현재 터빈 어셈블리 전체를 가상 환경에서 모델링하고, 블레이드가 손상되기 전에 캐비테이션을 예측함으로써 가동 중단 시간을 최소화하면서 자산의 수명을 연장하고 있습니다. 이러한 분석은 발전소 운영자의 은퇴로 인해 발생하는 전문 지식의 공백을 메우는 데에도 기여합니다. 따라서 센서, 광섬유식 고정자 코일, 클라우드 기반 SCADA 공급업체들은 새로운 국내 수요를 확보하게 되며, 국내 발전 용량이 정체된 상태라 하더라도 미국 수력 발전 시장은 진단 소프트웨어의 수출 기지로서의 입지를 확고히 하게 될 것입니다. 장기적으로는 이러한 도구를 통해 O&M(운영 및 유지보수) 비용 비율이 감소하고, 자유 현금 흐름이 개선되며, 추가적인 인프라 투자를 유치할 것으로 기대됩니다.
FERC의 재인가 절차 장기화
통합 라이선싱 절차의 평균 소요 기간은 7.6년이며, 그 기간 동안 설비 투자(Capex)는 인플레이션의 영향을 받고, 투자자들의 인내심도 점차 약해집니다. 2024년 12월의 규정에 따라 당국은 수질 인증에 대해 1년 이내에 조치를 취해야 할 의무가 있지만, 그 밖의 협의(특히 멸종 위기 종 보호법에 근거한 협의)로 인해 일정이 프로젝트의 예상 기간을 초과할 정도로 장기화될 가능성이 있습니다. 그 결과, 소유주는 환경영향 평가 범위를 다시 확대해야 하는 확장 공사보다 자산 보전을 우선시하여, 기존 허가·인가 기간에 맞추어 현대화 공사를 단계적으로 실시하는 경우가 늘고 있습니다.
부문별 분석
2025년에 대규모 수력 발전이 72.05%의 점유율을 차지하고 있다는 사실은 저수지 면적을 실질적으로 확대할 수 없는 기존 연방 댐의 정체 현상을 여실히 드러내고 있습니다. 대조적으로, 10MW 미만의 ‘소규모·초소규모’ 부문은 개발업자가 복잡한 FERC(연방에너지규제위원회) 절차를 피할 수 있는 비발전용 댐이나 관개 수로를 활용하고 있기 때문에 연평균 성장률(CAGR) 4.55%로 성장을 지속하고, 있습니다. 이러한 프로젝트들은 한 번에 몇 kW밖에 추가하지 않지만, 간소화된 일정 덕분에 분산형 자산이 새로운 송전선로를 건설하지 않고도 지역 송전망을 어떻게 강화할 수 있는지를 보여주고 있습니다. 많은 협동조합의 경우, 홍수 조절 구조물에 1MW 카플란 터빈을 설치함으로써 디젤 발전으로 피크 수요에 대응하는 임대 비용을 상쇄할 수 있습니다. 이 부문은 총 발전 용량을 거의 변화시키지 않으면서 미국 수력 발전 시장을 활성화하고 있습니다.
투자자들의 관심은 1-5MW 규모의 유수식 발전소 포트폴리오에 쏠리고 있습니다. 이 발전소들은 동일한 제어 시스템을 채택하고 있어 O&M(운영 및 유지보수) 인건비를 절감할 수 있습니다. 드론을 활용한 점검과 플러그 앤 플레이 방식의 속도 조절기 덕분에 현장 방문 빈도가 줄어들어, 소유주는 단일 제어 센터에서 수십 곳의 소규모 발전소를 감독할 수 있습니다. 이러한 ‘소프트웨어를 통한 확장’ 모델은 정격 출력이 다소 낮더라도 내부수익률(IRR)을 높여주며, 그린필드 댐에서 디지털 최적화로 전환되는 업계의 흐름을 잘 보여줍니다.
기타 혜택:
- 엑셀 형식 시장 예측(ME) 시트
- 3개월간의 애널리스트 지원
목차
제1장 서론
제2장 조사 방법
제3장 주요 요약
제4장 시장 구도
제5장 시장 규모와 성장 예측
제6장 경쟁 구도
제7장 시장 기회와 향후 전망
LSHAccording to Mordor Intelligence, the United States hydropower market size was valued at 102.27 gigawatt in 2025 and estimated to grow from 102.72 gigawatt in 2026 to reach 104.98 gigawatt by 2031, at a CAGR of 0.44% during the forecast period (2026-2031).
This report is Segmented by Capacity Rating (Large Hydro, Medium Hydro, and Small and Micro Hydro), Technology (Reservoir-Based, Run-Of-River, Pumped-Storage, and In-Stream and Micro-Conduit), and End-User (Utilities, Independent Power Producers, and Industrial and Captive). The Market Sizes and Forecasts are Provided in Terms of Installed Capacity (GW).
United States Hydropower Market Trends and Insights
Federal Investment Tax-Credits Extension
The Infrastructure Investment and Jobs Act now delivers direct payments covering up to 30% of modernization costs, enabling 46 plants to pursue efficiency gains averaging 14% without adding capacity. Owners have lined up USD 2.4 billion in matching capital, confirming that the US hydropower market favors upgrades such as runner replacements and generator rewinds over new dams. Down-rating exciter losses and installing variable-speed governors boost annual output within the same hydraulic envelope, a strategy that improves revenue per cubic meter of flow while keeping licensing risk negligible. Because tax equity can be syndicated, smaller public-power entities also tap the credit, accelerating long-delayed electrical balance-of-plant renewals. In aggregate, the incentive nudges national energy supply upward through efficiency rather than expansion.
DOE's New Water Power RD&D Funding Pipeline
The Water Power Technologies Office earmarked USD 33 million in 2024 for projects that merge digital twins, sonar-based fish detection, and pumped-storage optimization. Pacific Northwest National Laboratory now models entire turbine assemblies in a virtual environment that predicts cavitation before it degrades blades, extending asset life with minimal downtime. Such analytics also compress the expertise gap created by retiring plant operators. Vendors of sensors, fiber-optic stator coils, and cloud SCADA, therefore, gain new domestic demand, positioning the US hydropower market as an export source of diagnostic software even while local megawatts remain flat. Over the long term, these tools could shave O&M expense ratios, improving free cash flow and attracting additional infrastructure capital.
Extended FERC Relicensing Timelines
The Integrated Licensing Process averages 7.6 years, during which capex faces inflation creep and investor patience wanes. Although a December 2024 rule requires agencies to act within one year on water-quality certifications, other consultations-particularly under the Endangered Species Act-can still stretch schedules beyond project pro-formas. As a result, owners often sequence modernization work to coincide with existing license terms, prioritizing asset preservation over expansions that would reopen environmental impact scopes.
Other drivers and restraints analyzed in the detailed report include:
- Grid-Support Payments for Flexible Capacity
- Aging Coal Retirements Creating Replacement Need
- ESA-Driven Fish-Passage Retrofit Costs
For complete list of drivers and restraints, kindly check the Table Of Contents.
Segment Analysis
Large Hydro's 72.05% share in 2025 underscores the inertia of legacy federal dams whose reservoir footprints cannot meaningfully expand. In contrast, the Small & Micro bracket below 10 MW records a 4.55% CAGR as developers tap non-powered dams and irrigation conduits that bypass complex FERC processes. These projects add just kilowatts at a time, yet their streamlined timelines illustrate how distributed assets can reinforce rural grids without new transmission corridors. For many cooperatives, slipstreaming a 1 MW Kaplan unit into a flood-control structure offsets diesel peaker rentals. The segment enhances the nationwide US hydropower market while leaving aggregate capacity largely unchanged.
Investor interest coalesces around portfolios of 1-5 MW run-of-river stations where identical control packages cut O&M labor. Because drone inspections and plug-and-play governors reduce visit frequency, owners can supervise dozens of micro-plants from a single control center. This scale-via-software model elevates the internal rate of return despite modest nameplates, and it embodies the sector's pivot from greenfield dams to digital optimization.
Complete Report Scope:
- By Capacity Rating
- Large Hydro (Above 100 MW)
- Medium Hydro (10 to 100 MW)
- Small and Micro Hydro (Below 10 MW)
- By Technology
- Reservoir-Based
- Run-of-River
- Pumped-Storage
- In-Stream and Micro-conduit
- By Component (Qualitative Analysis only)
- Turbines
- Generators
- Control and Automation
- Balance-of-Plant
- By End-User
- Utilities (State and Public)
- Independent Power Producers
- Industrial and Captive
List of Companies Covered in this Report:
- GE Vernova
- Siemens Energy AG
- Voith Hydro GmbH
- Andritz AG
- Toshiba Energy Systems
- American Hydro
- Canyon Hydro
- Mavel Americas
- Gilkes
- Duke Energy Corporation
- NextEra Energy Resources
- Brookfield Renewable US
- PacifiCorp
- TVA
- Bonneville Power Administration
- PG&E
- Xcel Energy
- Dominion Energy
- FirstLight Power
- American Municipal Power
Additional Benefits:
- The market estimate (ME) sheet in Excel format
- 3 months of analyst support
TABLE OF CONTENTS
1 Introduction
- 1.1 Study Assumptions & Market Definition
- 1.2 Scope of the Study
2 Research Methodology
3 Executive Summary
4 Market Landscape
- 4.1 Market Overview
- 4.2 Market Drivers
- 4.2.1 Federal investment tax-credits extension
- 4.2.2 DOE's new Water Power RD&D funding pipeline
- 4.2.3 Grid-support payments for flexible capacity
- 4.2.4 Aging coal retirements creating replacement need
- 4.2.5 Corporate 24*7 clean-power procurement mandates
- 4.2.6 Climate-driven flood-control modernization funds
- 4.3 Market Restraints
- 4.3.1 Extended FERC relicensing timelines
- 4.3.2 ESA-driven fish-passage retrofit costs
- 4.3.3 Low avoided-cost rates in organized markets
- 4.3.4 Distributed PV cannibalization risk for peak pricing
- 4.4 Supply-Chain Analysis
- 4.5 Regulatory Landscape
- 4.6 Technological Outlook
- 4.7 Porter's Five Forces
- 4.7.1 Threat of New Entrants
- 4.7.2 Bargaining Power of Suppliers
- 4.7.3 Bargaining Power of Buyers
- 4.7.4 Threat of Substitutes
- 4.7.5 Competitive Rivalry
- 4.8 PESTLE Analysis
5 Market Size & Growth Forecasts
- 5.1 By Capacity Rating
- 5.1.1 Large Hydro (Above 100 MW)
- 5.1.2 Medium Hydro (10 to 100 MW)
- 5.1.3 Small and Micro Hydro (Below 10 MW)
- 5.2 By Technology
- 5.2.1 Reservoir-Based
- 5.2.2 Run-of-River
- 5.2.3 Pumped-Storage
- 5.2.4 In-Stream and Micro-conduit
- 5.3 By Component (Qualitative Analysis only)
- 5.3.1 Turbines
- 5.3.2 Generators
- 5.3.3 Control and Automation
- 5.3.4 Balance-of-Plant
- 5.4 By End-User
- 5.4.1 Utilities (State and Public)
- 5.4.2 Independent Power Producers
- 5.4.3 Industrial and Captive
6 Competitive Landscape
- 6.1 Market Concentration
- 6.2 Strategic Moves (M&A, Partnerships, PPAs)
- 6.3 Market Share Analysis (Market Rank/Share for key companies)
- 6.4 Company Profiles (includes Global level Overview, Market level overview, Core Segments, Financials as available, Strategic Information, Products & Services, and Recent Developments)
- 6.4.1 GE Vernova
- 6.4.2 Siemens Energy AG
- 6.4.3 Voith Hydro GmbH
- 6.4.4 Andritz AG
- 6.4.5 Toshiba Energy Systems
- 6.4.6 American Hydro
- 6.4.7 Canyon Hydro
- 6.4.8 Mavel Americas
- 6.4.9 Gilkes
- 6.4.10 Duke Energy Corporation
- 6.4.11 NextEra Energy Resources
- 6.4.12 Brookfield Renewable US
- 6.4.13 PacifiCorp
- 6.4.14 TVA
- 6.4.15 Bonneville Power Administration
- 6.4.16 PG&E
- 6.4.17 Xcel Energy
- 6.4.18 Dominion Energy
- 6.4.19 FirstLight Power
- 6.4.20 American Municipal Power
7 Market Opportunities & Future Outlook
- 7.1 White-space & Unmet-Need Assessment