
|
시장보고서
상품코드
2124880
희귀질환 치료 : 시장 점유율 분석, 업계 동향과 통계, 성장 예측(2026-2031년)Rare Disease Treatment - Market Share Analysis, Industry Trends & Statistics, Growth Forecasts (2026 - 2031) |
||||||
 Mordor Intelligence
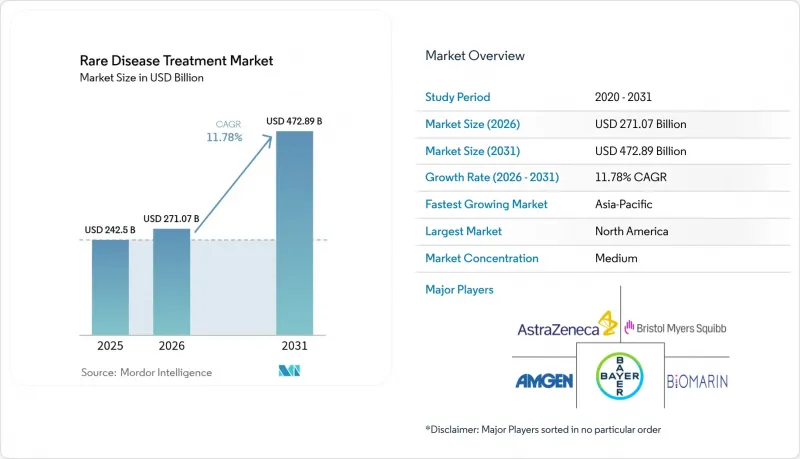
Mordor Intelligence에 의하면, 희귀질환 치료 시장 규모는 2025년 2,425억 달러에서 2026년에는 2,710억 7,000만 달러에 이르고, 2026-2031년 CAGR 11.8%로 성장을 지속하여 2031년에는 4,728억 9,000만 달러에 달할 것으로 예측됩니다.
본 보고서는 질환 유형(종양성 희귀질환, 신경계 질환 등), 치료법 유형(저분자 의약품, 생물학적 제제·단일클론항체 등), 투여 경로(경구, 비경구, 기타), 최종 사용자(병원, 전문 클리닉 등), 지역(북미, 유럽 등)별로 분류되어 있습니다. 시장 예측은 금액(달러) 기준으로 제시되어 있습니다.
전 세계 희귀질환 치료 시장 동향 및 인사이트
정부의 인센티브 및 전 세계 희귀질환 치료제의 독점권
독점권 연장 및 세액 공제는 희귀질환 치료 시장의 혁신을 지속적으로 뒷받침하고 있습니다. 미국에서는 7년간의 독점권과 25%의 임상시험 세액 공제를 통해 순위험이 감소하는 반면, 유럽연합(EU)에서는 10년간의 보호가 인정되며, 소아 적응증의 경우 12년까지 연장될 가능성이 있습니다. 렛 증후군에 대한 DAYBUE 승인 후 나타난 매각 사례가 보여주듯이, 약 1억 5,000만 달러 상당의 우선 심사 바우처는 추가적인 수익 가능성을 제공합니다. 이러한 인센티브는 기초 과학 분야의 획기적인 성과를 상업적으로 실현 가능한 치료법으로 전환하는 데 기여하고 있습니다.
확대되는 FDA/EMA의 희귀질환 승인 파이프라인
규제 당국은 신속 심사 메커니즘을 적극적으로 도입하고 있습니다. FDA는 2024년, 방향족 L-아미노산 탈카르복실화효소 결핍증 치료제 ‘Kebilidi’를 포함한 여러 유전자 치료제를 승인했습니다. EMA는 2023년에 17건의 희귀질환 지정을 부여했으며, 이는 후보 약물이 꾸준히 유입되고 있음을 보여줍니다. FDA의 START 시범 프로그램 및 EMA의 PRIME 제도와 더불어, 이러한 체계는 심사 불확실성을 줄이고 시장 출시를 가속화하며 시장 확대를 뒷받침하고 있습니다.
기존 RCT에서의 환자 수 부족
초희귀질환의 경우, 전 세계 환자 수가 불과 수백 명에 그치는 경우가 있어 표준 무작위 대조 시험을 실시하기가 극히 어렵습니다. 적응형 임상시험이나 바스켓 임상시험이 도움이 되는 분야임에도 불구하고, 희귀질환 관련 연구의 50% 이상은 피험자 모집 부족으로 인해 여전히 결과를 발표하지 못하고 있습니다.
부문 분석
2025년, 암 관련 희귀질환은 희귀질환 치료제 시장 점유율의 41.89%를 차지하며, 희귀질환 치료제 시장 전체에서 수익 면에서의 우위를 부각시켰습니다. 이러한 주도적 지위는 틈새 암 치료제, 특히 표적 생물학적 제제 및 면역 요법의 혜택을 받는 혈액 악성 종양과 관련된 높은 미충족 의료 수요와 프리미엄 가격 책정을 반영합니다. 종양학 분야의 희귀질환 치료 시장 규모는 추가적인 정밀 의학 의약품의 승인 획득 및 대상 하위 집단의 확대에 따라 한 자릿수 중반대의 성장률을 유지할 것으로 예측됩니다. 대조적으로, 신경 질환 분야는 혈액-뇌 장벽을 투과하여 잠재적인 완치 효과를 가져오는 ‘렌멜디’나 ‘케빌디’와 같은 유전자 치료에 힘입어 2031년까지 연평균 성장률(CAGR) 12.62%를 나타낼 것으로 예측됩니다. 신경퇴행성 질환 적응증에 대한 심사 기간을 단축하는 규제상 시범 프로그램도 추가적인 성장 모멘텀을 뒷받침하고 있습니다.
이 두 가지 주축 이외의 분야에서도 성장이 꾸준하고 의미 있는 수준을 유지하고 있습니다. 대사성 질환 분야에서는 효소 보충 요법과 평생에 걸친 치료 선택지를 넓혀주는 새로운 유전자 편집 요법이 계속해서 중심이 될 것입니다. 한편, 면역계 질환 분야에서는 단일클론 항체와 유전자 변형 T세포 플랫폼의 발전이 도입되고 있습니다. 감염증 분야로의 응용은 시장 규모는 작지만, 항생제 내성이라는 틈새 영역에서 희귀질환에 대한 인센티브가 제한된 판매량을 상쇄하기 때문에 관심을 모으고 있습니다. 파이프라인 분석에 따르면, 현재 3상 임상시험 단계에 있는 자산의 약 18%가 신경 질환을 대상으로 하고 있으며, 이는 고성장 분야로의 자본 재분배가 지속되고 있음을 보여줍니다. 전반적으로, 질환 유형의 다양화는 제약 기업의 포트폴리오 리스크를 낮추고, 희귀질환 치료 시장이 균형 잡힌 장기적 성장을 실현하는 데 기여하고 있습니다.
생물학적 제제와 단일클론 항체는 2025년 매출의 50.74%를 차지하며, 입증된 효능과 만성적 정맥 주입 모델에 대한 지불자 측의 이해가 깊어짐에 따라 희귀질환 치료 시장 규모의 중심적인 위치를 유지하고 있습니다. 그럼에도 불구하고, 유전자 치료 및 세포 치료는 특성이 충분히 규명된 돌연변이와 초희귀 돌연변이 모두를 표적으로 하는 700건이 넘는 진행 중인 임상 프로그램에 힘입어 연평균 성장률(CAGR) 12.88%로 다른 모든 치료법을 능가하는 속도로 성장하고 있습니다. 신경계 및 혈액계 카테고리에서 최근 승인된 사례들은 아데노연관바이러스(AAV) 벡터의 유효성을 입증하며, 조직 친화성이 향상된 차세대 캡시드에 대한 투자를 촉진하고 있습니다.
각 치료법 간의 경쟁 관계는 확대되고 있습니다. 저분자 의약품은 대사 경로 및 알로스테릭 효소 조절에서 틈새적인 중요성을 유지하고 있으며, 편의성과 제조상의 복잡성이 낮다는 장점을 제공합니다. RNA 기반 치료법, 특히 siRNA 제제는 적용 범위가 확대되고 있음에도 불구하고 도입에 있어 계속해서 과제에 직면하고 있습니다. 그 이유는 연간 치료비가 파티실란(ONPATTRO)과 같은 1세대 치료제의 경우 37만 5,000달러인 반면, 보다 새롭고 고도로 전문화된 siRNA 치료법의 경우 160만 달러 이상에 달하기 때문입니다. 분기마다 투여되는 부트리스란(Amvuttra)은 투여 부담과 이에 따른 의료 서비스 이용을 줄여주며, 임상적 유효성을 저해하지 않으면서 파티실란에 비해 비용 대비 효과 면에서 우위를 가질 가능성이 있습니다. 리소좀 축적증의 경우, 효소 보충 요법이 여전히 중심적인 역할을 하고 있지만, 장기적인 치료법 전환에 관한 연구에 따르면 단일 투여 유전자 치료로 점차 전환되고 있는 것으로 보입니다. 이러한 동향이 맞물리면서 치료법 구성이 변화하고 있으며, 희귀질환 치료 시장에서 기존의 생물학적 제제 프랜차이즈에 대한 혁신 압력이 강해지고 있습니다.
지역별 분석
2025년, 북미는 희귀질환 치료 시장 점유율의 41.86%를 차지했습니다. 이는 FDA의 패스트트랙 제도, 광범위한 민간 보험 적용 범위, 그리고 강력한 학술 연구 네트워크가 결합되어 실현된 결과입니다. 희귀질환 치료제의 평균 시장 출시 기간은 다른 어떤 지역보다 2-3년 짧아, 이를 통해 미국은 지속적인 선구자적 우위를 유지하고 있습니다. 캐나다도 ‘우선 심사(Priority Review)’ 프로그램을 통해 유사한 추진력을 보이고 있으나, 주별 예산 상한선으로 인해 전국적인 접근이 6-9개월 지연되고 있습니다. 유럽도 이에 뒤이어가고 있습니다. EMA(유럽의약품청)는 2023년에 17건의 새로운 희귀질환 지정을 승인하며, 각국에서의 중복 신청을 줄이는 견고한 집중 심사 절차의 유효성을 입증하고 있습니다. 그러나 환급 규정의 불균형으로 인해 중·동유럽 국가에서는 승인된 치료법의 절반 이하만 보장되고 있어, 양극화된 접근 환경이 조성되고 있습니다.
아시아태평양은 2031년까지 연평균 성장률(CAGR) 13.29%라는 가장 높은 성장이 예상되며, 그 주된 원동력은 중국의 규제 개혁으로 인해 ‘국가 희귀질환 목록’이 121개 질환에서 207개 질환으로 확대된 데 있습니다. 중국 국가의약품감독관리국(NMPA)의 CARE 제도에 따라 대상 의약품의 심사 기간은 130영업일로 단축되었으나, FDA 승인을 받은 희귀질환 치료제 중 이후 중국에서 승인을 획득한 비율은 고작 38%에 그쳐, 현지화 과정에서 여전히 과제가 존재함을 보여줍니다. 일본은 초희귀 신경근 질환 적응증 분야에서 주도적인 위치를 유지하고 있으며, 2024년에 GNE 근병증에 대한 아세뉴라믹산이 승인된 것은 대상을 좁힌 지원 프로그램의 가치를 여실히 보여줍니다. 한국과 싱가포르에서는 다국적 기업의 임상시험 유치를 위한 세액 공제 및 임상시험 인프라에 대한 보조금이 도입되었으나, 국내 인구 규모가 작기 때문에 수익 성장에는 여전히 한계가 있습니다. 전반적으로 진단 능력 향상, 신생아 선별 검사 확대, 그리고 가구 소득 증대가 희귀질환 치료 시장 규모에 대한 아시아태평양의 장기적인 기여를 뒷받침하고 있습니다. 라틴아메리카, 중동 및 아프리카는 현재 시장 침투율이 한 자릿수에 그치고 있지만, 아직 발전 단계에 있음에도 전략적으로 중요한 신흥 시장입니다. 브라질 보건감시청은 우선 희귀질환 의약품에 대해 최대 8년간의 독점권을 부여하고 있지만, 보상은 여전히 사례별로 결정되기 때문에 보급 상황은 예측하기 어렵습니다. 사우디아라비아는 2024년에 희귀질환 등록부를 설립하여, 현지 약물경제학적 지침이 성숙 단계에 도달하면 향후 시장 진입을 위한 기반을 마련했습니다. 다자간 기구들은 가격 측면의 장벽을 완화하기 위해 공동 조달 모델을 시범적으로 도입하고 있지만, 환율 변동과 공급망의 미비점이 계속해서 성장을 저해하고 있습니다.
기타 혜택:
- 엑셀 형식 시장 예측(ME) 시트
- 3개월간의 애널리스트 지원
자주 묻는 질문
목차
제1장 서론
제2장 조사 방법
제3장 주요 요약
제4장 시장 구도
제5장 시장 규모와 성장 예측
제6장 경쟁 구도
제7장 시장 기회와 향후 전망
LSH 26.09.14According to Mordor Intelligence, the rare disease treatment market size is expected to grow from USD 242.5 billion in 2025 to USD 271.07 billion in 2026 and is forecast to reach USD 472.89 billion by 2031 at 11.8% CAGR over 2026-2031.
This report is Segmented by Disease Type (Oncological Rare Diseases, Neurological Disorders, and More), Therapy Type (Small-Molecule Drugs, Biologics & Monoclonal Antibodies, and More), Route of Administration (Oral, Parenteral, Others), End User (Hospitals, Specialty Clinics, and More), and Geography (North America, Europe, and More). The Market Forecasts are Provided in Terms of Value (USD).
Global Rare Disease Treatment Market Trends and Insights
Government Incentives & Global Orphan-Drug Exclusivity
Extended exclusivity and tax credits continue to underwrite innovation within the rare disease treatment market. In the United States, seven-year exclusivity and 25% clinical trial tax credits lower net risk, while the European Union grants 10-year protection that can extend to 12 years for pediatric compliance. Priority Review Vouchers worth roughly USD 150 million add further return potential, as shown by the sale following DAYBUE approval for Rett syndrome. Such incentives help translate basic-science breakthroughs into commercially viable therapies.
Growing FDA/EMA Rare-Disease Approvals Pipeline
Regulators have embraced expedited mechanisms. The FDA cleared multiple gene therapies in 2024, including Kebilidi for aromatic L-amino acid decarboxylase deficiency. The EMA granted 17 orphan designations in 2023, demonstrating a steady flow of candidates. Together with the FDA START pilot and EMA PRIME schemes, these frameworks reduce review uncertainty and accelerate launches, fuelling market expansion.
Limited Patient Pools for Conventional RCTs
Ultra-rare conditions can involve only hundreds of patients worldwide, making standard randomised trials extremely difficult. Adaptive and basket designs help, but more than 50% of rare-disease studies still fail to publish results due to recruitment gaps.
Other drivers and restraints analyzed in the detailed report include:
- Premium Pricing & Favourable Reimbursement Frameworks
- Rapid Advances in Gene & Cell Therapies
- Escalating Payor Push-Back on Six-Figure Price Tags
For complete list of drivers and restraints, kindly check the Table Of Contents.
Segment Analysis
Oncological rare diseases captured 41.89% of the rare disease treatment market share in 2025, underscoring their revenue dominance within the overall rare disease treatment market. This leadership reflects the high clinical unmet need and premium pricing associated with niche cancer therapeutics, particularly hematologic malignancies that benefit from targeted biologics and immunotherapies. The rare disease treatment market size for oncological indications is projected to maintain mid-single-digit growth as additional precision drugs secure approvals and expand addressable sub-cohorts. Neurological disorders, by contrast, are forecast to grow at a 12.62% CAGR through 2031, propelled by gene therapies such as Lenmeldy and Kebilidi that penetrate the blood-brain barrier and deliver potentially curative benefits . Regulatory pilots that shorten review timelines for neurodegenerative indications add further momentum.
Growth outside these two pillars remains steady yet meaningful. Metabolic disorders continue to rely on enzyme replacement and emerging gene-editing modalities that broaden lifetime treatment options. In contrast, immunological disorders absorb advances in monoclonal antibodies and engineered T-cell platforms. Infectious-disease applications, although smaller in value, attract interest for antimicrobial-resistance niches where orphan incentives offset limited volumes. Pipeline analysis shows roughly 18% of phase III assets now target neurological diseases, signaling sustained capital reallocation toward high-growth categories. Overall, disease-type diversification reduces portfolio risk for manufacturers and helps the rare disease treatment market achieve balanced long-term expansion.
Biologics and monoclonal antibodies accounted for 50.74% of 2025 revenue, maintaining their position at the center of the rare disease treatment market size, thanks to their proven efficacy and payer familiarity with chronic infusion models. Even so, gene and cell therapies are outpacing every other modality at a 12.88% CAGR, driven by a pipeline exceeding 700 active clinical programmes that target both well-characterised and ultra-rare mutations. Recent approvals across neurologic and hematologic categories validate adeno-associated virus vectors and encourage investment in next-generation capsids with enhanced tissue tropism.
The competitive interplay among modalities is widening. Small-molecule drugs preserve niche relevance for metabolic pathways and allosteric enzyme modulation, offering convenience and lower manufacturing complexity. RNA-based interventions, particularly siRNA agents, continue to face adoption challenges despite broader coverage, because annual treatment costs range from USD 375,000 for first-generation options, such as patisiran (ONPATTRO), to more than USD 1.6 million for newer, highly specialized siRNA therapies. Vutrisiran (Amvuttra), administered quarterly, reduces the administration burden and related healthcare utilization, giving it a potential cost-effectiveness edge over patisiran without compromising clinical benefit. Enzyme-replacement therapies remain central for lysosomal storage diseases; however, long-term switching studies suggest a gradual shift toward single-administration gene transfers. Collectively, these dynamics transform the therapeutic mix and heighten innovation pressure on incumbent biologics franchises within the rare disease treatment market.
Complete Report Scope:
- By Disease Type
- Oncological Rare Diseases
- Neurological Disorders
- Metabolic Disorders
- Hematologic Disorders
- Immunological Disorders
- Infectious Diseases
- Others
- By Therapy Type
- Small-Molecule Drugs
- Biologics & Monoclonal Antibodies
- Gene & Cell Therapy
- RNA-based Therapy
- Enzyme Replacement Therapy
- Others
- By Route of Administration
- Oral
- Parenteral
- Others
- By End User
- Hospitals
- Specialty Clinics
- Home-Care Settings
- Research & Academic Institutes
- By Geography
- North America
- United States
- Canada
- Mexico
- Europe
- Germany
- United Kingdom
- France
- Italy
- Spain
- Rest of Europe
- Asia-Pacific
- China
- India
- Japan
- South Korea
- Australia
- Rest of Asia-Pacific
- South America
- Brazil
- Argentina
- Rest of South America
- Middle East and Africa
- GCC
- South Africa
- Rest of Middle East and Africa
- North America
Geography Analysis
North America accounted for 41.86% of rare disease treatment market share in 2025, reflecting the combination of FDA fast-track pathways, wide commercial insurance coverage, and strong academic research networks. Average launch timelines for orphan assets are two to three years shorter than in any other region, giving the United States an enduring first-mover advantage. Canada mirrors this momentum through its Priority Review program, although provincial budget caps delay uniform access by six to nine months. Europe follows closely; the EMA granted 17 new orphan designations in 2023, underscoring a robust centralised review process that cuts duplicative national filings. Nonetheless, disparate reimbursement rules mean Central and Eastern European countries cover fewer than half of approved therapies, creating a two-tier access environment.
Asia-Pacific is poised for the fastest 13.29% CAGR through 2031, driven chiefly by China's regulatory reforms that expanded the National Rare Diseases List from 121 to 207 conditions. The NMPA CARE scheme compresses review cycles to 130 working days for qualifying drugs, yet only 38% of FDA-cleared orphan therapies later gain Chinese approval, signalling ongoing localisation hurdles. Japan sustains leadership in ultra-rare neuromuscular indications; its 2024 approval of aceneuramic acid for GNE myopathy illustrates the value of targeted subsidy programs.South Korea and Singapore roll out tax credits and clinical-trial infrastructure grants that attract multinational studies, although small domestic populations still limit revenue upside. Collectively, growing diagnostic capacity, newborn screening expansion, and rising household income underpin the long-run contribution of Asia-Pacific to rare disease treatment market size. Latin America, the Middle East, and Africa represent nascent yet strategic frontiers with single-digit current penetration. Brazil's Health Surveillance Agency grants up to eight years of exclusivity for priority orphan drugs, but reimbursement remains case-by-case, creating unpredictable uptake. Saudi Arabia established a Rare Disease Registry in 2024, setting the stage for future market entry once local pharmacoeconomic guidelines mature.Multilateral organisations are piloting pooled procurement models to ease affordability barriers, though currency volatility and supply-chain gaps continue to restrain growth.
- Novartis
- Johnson & Johnson
- Roche
- AstraZeneca plc (Alexion)
- Amgen
- Pfizer
- Takeda Pharmaceutical Co.
- Sanofi
- Bristol-Myers Squibb
- Vertex Pharmaceuticals
- BioMarin Pharmaceutical
- CSL Behring
- Ultragenyx Pharmaceutical
- Regeneron Pharmaceuticals
- Bluebird bio
- Sarepta Therapeutics
- Horizon Therapeutics
- Genzyme (Sanofi)
- PTC Therapeutics
Additional Benefits:
- The market estimate (ME) sheet in Excel format
- 3 months of analyst support
TABLE OF CONTENTS
1 Introduction
- 1.1 Study Assumptions & Market Definition
- 1.2 Scope of the Study
2 Research Methodology
3 Executive Summary
4 Market Landscape
- 4.1 Market Overview
- 4.2 Market Drivers
- 4.2.1 Government incentives & global orphan-drug exclusivity
- 4.2.2 Growing FDA/EMA orphan-drug approvals pipeline
- 4.2.3 Premium pricing & favourable reimbursement frameworks
- 4.2.4 Rapid advances in gene & cell therapies
- 4.2.5 Distributed manufacturing for personalised gene therapy (under-the-radar)
- 4.2.6 AI-enabled virtual trials for ultra-rare cohorts (under-the-radar)
- 4.3 Market Restraints
- 4.3.1 Limited patient pools for conventional RCTs
- 4.3.2 Escalating payor push-back on six-figure price tags
- 4.3.3 Viral-vector manufacturing bottlenecks (under-the-radar)
- 4.3.4 Post-gene-therapy long-term safety liabilities (under-the-radar)
- 4.4 Value / Supply-Chain Analysis
- 4.5 Regulatory Landscape
- 4.6 Technological Outlook
- 4.7 Porter's Five Forces
- 4.7.1 Threat of New Entrants
- 4.7.2 Bargaining Power of Buyers
- 4.7.3 Bargaining Power of Suppliers
- 4.7.4 Threat of Substitutes
- 4.7.5 Competitive Rivalry
5 Market Size & Growth Forecasts (Value)
- 5.1 By Disease Type
- 5.1.1 Oncological Rare Diseases
- 5.1.2 Neurological Disorders
- 5.1.3 Metabolic Disorders
- 5.1.4 Hematologic Disorders
- 5.1.5 Immunological Disorders
- 5.1.6 Infectious Diseases
- 5.1.7 Others
- 5.2 By Therapy Type
- 5.2.1 Small-Molecule Drugs
- 5.2.2 Biologics & Monoclonal Antibodies
- 5.2.3 Gene & Cell Therapy
- 5.2.4 RNA-based Therapy
- 5.2.5 Enzyme Replacement Therapy
- 5.2.6 Others
- 5.3 By Route of Administration
- 5.3.1 Oral
- 5.3.2 Parenteral
- 5.3.3 Others
- 5.4 By End User
- 5.4.1 Hospitals
- 5.4.2 Specialty Clinics
- 5.4.3 Home-Care Settings
- 5.4.4 Research & Academic Institutes
- 5.5 By Geography
- 5.5.1 North America
- 5.5.1.1 United States
- 5.5.1.2 Canada
- 5.5.1.3 Mexico
- 5.5.2 Europe
- 5.5.2.1 Germany
- 5.5.2.2 United Kingdom
- 5.5.2.3 France
- 5.5.2.4 Italy
- 5.5.2.5 Spain
- 5.5.2.6 Rest of Europe
- 5.5.3 Asia-Pacific
- 5.5.3.1 China
- 5.5.3.2 India
- 5.5.3.3 Japan
- 5.5.3.4 South Korea
- 5.5.3.5 Australia
- 5.5.3.6 Rest of Asia-Pacific
- 5.5.4 South America
- 5.5.4.1 Brazil
- 5.5.4.2 Argentina
- 5.5.4.3 Rest of South America
- 5.5.5 Middle East and Africa
- 5.5.5.1 GCC
- 5.5.5.2 South Africa
- 5.5.5.3 Rest of Middle East and Africa
- 5.5.1 North America
6 Competitive Landscape
- 6.1 Market Concentration
- 6.2 Market Share Analysis
- 6.3 Company Profiles (includes Global level Overview, Market level overview, Core Segments, Financials as available, Strategic Information, Market Rank/Share for key companies, Products & Services, and Recent Developments)
- 6.3.1 Novartis AG
- 6.3.2 Johnson & Johnson (Janssen)
- 6.3.3 Roche Holding AG
- 6.3.4 AstraZeneca plc (Alexion)
- 6.3.5 Amgen Inc.
- 6.3.6 Pfizer Inc.
- 6.3.7 Takeda Pharmaceutical Co.
- 6.3.8 Sanofi S.A.
- 6.3.9 Bristol Myers Squibb
- 6.3.10 Vertex Pharmaceuticals
- 6.3.11 BioMarin Pharmaceutical
- 6.3.12 CSL Behring
- 6.3.13 Ultragenyx Pharmaceutical
- 6.3.14 Regeneron Pharmaceuticals
- 6.3.15 Bluebird bio
- 6.3.16 Sarepta Therapeutics
- 6.3.17 Horizon Therapeutics
- 6.3.18 Genzyme (Sanofi)
- 6.3.19 PTC Therapeutics
7 Market Opportunities & Future Outlook
- 7.1 White-space & Unmet-Need Assessment