

|
시장보고서
상품코드
2125613
미국 및 유럽의 광섬유 케이블 시장 : 시장 점유율 분석, 산업 동향 및 통계 데이터, 성장 예측(2026-2031년)United States And European Fiber Optic Cable - Market Share Analysis, Industry Trends & Statistics, Growth Forecasts (2026 - 2031) |
||||||
 Mordor Intelligence
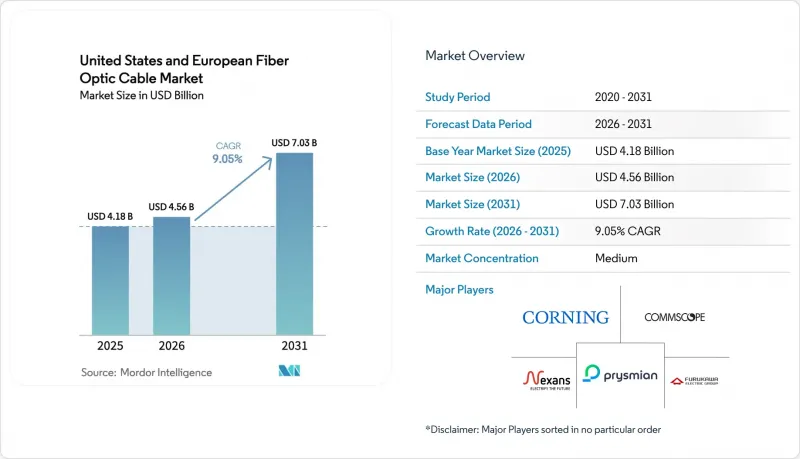
Mordor Intelligence에 의하면, 2026년 미국 및 유럽의 광섬유 케이블 시장 규모는 45억 6,000만 달러로 추정되고, 2025년 41억 8,000만 달러에서 확대해, 2031년에는 70억 3,000만 달러에 이를 것으로 예측됩니다.
2026-2031년 연평균 성장률(CAGR)은 9.05%를 나타낼 전망입니다.
본 보고서는 케이블 유형별(루스 튜브, 타이트 버퍼드 등), 모드별(싱글 모드, 멀티 모드), 부설 방식별(지하, 가공, 해저), 최종 사용자 산업별(통신, 전력 등) 및 지역별로 분류되어 있습니다. 시장 예측은 금액(달러)으로 표시되어 있습니다.
미국 및 유럽의 광섬유 케이블 시장 동향 및 인사이트
급증하는 데이터 트래픽과 클라우드 워크로드
AI 훈련 클러스터 전용 하이퍼스케일 데이터센터에서는 구리선 회선으로는 대응할 수 없는 동서 방향의 트래픽 패턴을 반영하여, 고밀도 리본 어셈블리가 전례 없는 속도로 소비되고 있습니다. Meta의 ‘Project Waterworth’와 Amazon의 아일랜드-미국 간 케이블은 400G 및 800G 광 레인을 우선시하는 민간 백본 인프라에 대한 수십억 달러 규모의 투자를 상징하는 사례입니다. MPO/MTP 규격 커넥터의 리드타임은 16주를 초과하고 있으며, 이는 공급 환경이 핍박하고 있음을 나타내며, 수직 통합형 공급업체의 우위를 높이고 있습니다. 초저손실 G.654.E 광섬유는 해상 구간의 재생 지점을 줄여 궁극적으로 클라우드 사업자의 총 소유 비용(TCO)을 절감하기 때문에 채택이 확대되고 있습니다. 그 결과, AI 워크로드에 최적화된 특수한 타이트 버퍼드 및 리본 설계 제품을 제공할 수 있는 제조업체는 프리미엄 가격을 확보하는 동시에, On-Premise 환경에서의 이전, 증설, 변경에 따른 지속적인 서비스 수익을 확대되고 있습니다.
FTTH 및 5G 구축에 대한 투자 가속화
2024년 9월 현재, EU 39개국의 광섬유 보급률은 74.6%에 달했으며, 같은 기간 동안 독일에서는 380만 가구, 영국에서는 420만 가구가 새로 연결되었습니다. Delta Fibre, Open Dutch Fibre 및 KPN의 Glaspoort에 의한 경쟁적인 오버빌드로 인해 네덜란드의 가구 커버리지율은 88%라는 이정표에 도달했습니다. 이와 동시에, mm파 5G의 밀도 향상은 스몰 셀 클러스터로의 다크 파이버 백홀에 의존하고 있으며, 이로 인해 모바일 네트워크 사업자들은 굴착 비용을 상쇄하기 위해 FTTH와 5G 자산을 공동으로 구축하고 있습니다. 인프라 공유 및 중립 호스트 타워 모델은 신규 진입 사업자에 대한 진입 장벽을 낮추고 있는 반면, 멀티테넌트 데이터센터에서는 동일한 도관 시스템을 활용하여 미트룸을 통합하고 있습니다. 이러한 융합으로 인해, 가공 및 지하 경로 모두에 적용 가능한 모듈식 제품 포트폴리오를 유지하는 케이블 제조업체의 수주 파이프라인이 가속화되고 있습니다.
높은 토목 공사비 및 부지 취득 비용
2024년, 지하 공사 비용은 1피트당 18.25달러에 달했습니다. 이는 인건비 급등과 인구 밀집 도시에서의 허가 취득 절차 장기화로 인해 12%나 급등한 결과입니다. 토목 공사비는 프로젝트 예산의 최대 80%를 차지하기 때문에 사업자들은 마이크로 트렌치 공법이나 덕트 재사용 전략을 추구할 수밖에 없는 상황입니다. 피트당 6.55달러로 책정된 가공 배선은 여전히 매력적이지만, 도시 경관을 보존하기 위한 유럽의 지하 매설 의무화라는 과제에 직면해 있습니다. 이러한 동향으로 인해 기존 전신주 설치권이나 기존 덕트를 보유한 기존 사업자에게 유리한 상황이 조성되고, 그린필드 지역에서의 신규 부설이 억제되며, 성숙한 우편번호 구역 내의 치열한 경쟁이 완화되고 있습니다.
부문 분석
2025년, 광섬유 케이블 시장에서 루스 튜브 방식은 매출액 기준 33.68%의 점유율을 유지했습니다. 이는 실외 덕트나 가공 구간에 최적의 방습 구조 덕분입니다. 이 부문은 정부 자금을 통한 지방 건설 사업을 활성화하고 있으며, 극심한 기온 변동으로 인해 장기적인 신뢰성을 확보하기 위해 젤 충전형 또는 드라이 코어형 루스 튜브 방식이 요구되고 있습니다. 수요는 무선 대체 수단보다 지하 매설 네트워크를 우선시하는 주 차원의 광대역 보조금과 밀접한 관련이 있으며, 이를 통해 기존 사업자가 소유한 국내 시설에서의 생산량 예측이 가능해졌습니다.
한편, 하이퍼스케일 및 코로케이션 사업자들은 타이트 버퍼가 적용된 어셈블리의 조달을 가속화하고 있으며, 2031년까지 연평균 성장률(CAGR)은 9.54%를 나타낼 것으로 예측됩니다. 이는 데이터 홀 내 도입이 증가하고 있음을 반영하며, 굽힘에 강한 피복과 900μm 코팅 덕분에 설치 시간이 단축되고 있습니다. AI 클러스터의 랙당 포트 수는 3배로 증가했으며, 리본 형태의 타이트 버퍼는 사전 종단 처리된 MPO 트렁크에 대한 대량 융착 연결을 용이하게 하여, 지속되는 커넥터 부족 상황 속에서 가격 프리미엄을 창출하고 있습니다. GPU의 확장으로 인해 재생에너지 원에 가까운 멀티테넌트 빌딩이 선호됨에 따라 케이블 구성은 난연성 플레넘 규격으로 편중되고 있으며, 공급업체들은 저독성 화합물에 대응하기 위해 재킷 생산 라인을 재구축하고 있습니다.
싱글 모드 솔루션은 장거리 전송이 가능하며, FTTH, 메트로, 해저 백본을 위한 미래 지향적인 대역폭을 갖추고 있어 2025년 매출의 60.92%를 차지했습니다. 정부 보조금 덕분에 1Gbps 서비스가 표준이 된 액세스 루프에서 싱글모드의 우위가 확고해졌습니다. 통신 사업자들은 신규 설비 투자의 수명을 연장하기 위해 표준 G.652.D 또는 굽힘 내성이 있는 G.657.A2 코어를 도입하고 있습니다.
다중 모드 광섬유의 출하량은 2031년까지 연평균 성장률(CAGR) 9.41%를 나타낼 것으로 전망됩니다. 이는 OM4/OM5 변형이 하이퍼스케일 리프-스파인 패브릭 내에서 400G SR8 및 800G SR4 레인을 지원하기 때문입니다. 병렬 광학 아키텍처는 전송 거리를 150m로 제한하지만, 트랜시버 비용을 대폭 절감하여 데이터 홀에서 점유율을 되찾고 있습니다. 각 벤더들은 850nm VCSEL 광원에 최적화된 단계적 굴절률 프로파일을 채택하여 이에 대응하고 있으며, 이를 통해 모드 분산이 개선되고 사양의 허용 오차가 더욱 엄격해졌습니다. 이러한 추세로 인해 단거리 점퍼의 총 출하량이 증가하여, 장거리 프로젝트 사이의 공장 가동률이 향상되고, 통신 사업자의 설비 투자 주기에 내재된 수익의 주기성을 완화하는 데 기여하고 있습니다.
기타 혜택 :
- Excel 형식 시장 예측(ME) 시트
- 3개월간의 애널리스트 지원
자주 묻는 질문
목차
제1장 서론
제2장 분석 방법
제3장 주요 요약
제4장 시장 구도
제5장 시장 규모 및 성장률 예측
제6장 경쟁 구도
제7장 시장 기회 및 향후 전망
AJY 26.09.15According to Mordor Intelligence, the United States and European Fiber Optic Cable Market size in 2026 is estimated at USD 4.56 billion, growing from 2025 value of USD 4.18 billion with 2031 projections showing USD 7.03 billion, growing at 9.05% CAGR over 2026-2031.
This report is Segmented by Cable Type (Loose-Tube, Tight-Buffered, and More), Mode (Single-Mode, Multi-Mode), Deployment Type (Underground, Aerial, Submarine), End-User Industry (Telecommunications, Power Utilities, and More), and Geography. The Market Forecasts are Provided in Terms of Value (USD).
United States And European Fiber Optic Cable Market Trends and Insights
Surging Data Traffic and Cloud Workloads
Hyperscale data centers dedicated to AI training clusters are consuming high-density ribbon assemblies at an unprecedented pace, reflecting east-west traffic patterns that copper links cannot support. Meta's Project Waterworth and Amazon's Ireland-US cable exemplify multibillion-dollar commitments to private backbone infrastructure that prioritize 400 G and 800 G optical lanes. Connector lead times exceed 16 weeks for MPO/MTP formats, illustrating a tightening supply environment that strengthens the hand of vertically integrated suppliers . Ultra-low-loss G.654.E fibers are gaining traction because they reduce regeneration sites across ocean spans, thereby decreasing the total cost of ownership for cloud operators. As a result, manufacturers capable of delivering specialty tight-buffered and ribbon designs optimized for AI workloads secure premium pricing while broadening recurring services revenue from on-premise moves, adds, and changes.
Accelerated FTTH and 5G Rollout Investments
EU39 fiber coverage rose to 74.6% by September 2024, with Germany adding 3.8 million premises and the United Kingdom passing 4.2 million during that period. Competitive overbuilds by Delta Fibre, Open Dutch Fibre, and KPN's Glaspoort drove the Netherlands to an 88% household coverage milestone. In parallel, millimeter-wave 5G densification depends on dark-fiber backhaul to small-cell clusters, prompting mobile network operators to co-deploy FTTH and 5G assets to amortize trenching costs. Infrastructure sharing and neutral-host tower models lower barriers for alternative operators, while multitenant data centers leverage the same conduit systems to integrate meet-me rooms. This convergence accelerates order pipelines for cable makers that maintain modular product portfolios adaptable to both aerial and underground pathways.
High Civil-Works and Right-of-Way Costs
Underground construction reached USD 18.25 per foot in 2024, a 12% leap attributed to labor inflation and lengthy permitting cycles in dense metros . Civil works represent up to 80% of project budgets, compelling operators to pursue micro-trenches and conduit reuse strategies. Aerial placement, priced at USD 6.55 per foot, remains attractive but faces European mandates for burial to preserve streetscapes. These dynamics tilt the playing field toward incumbents holding legacy pole-attachment rights and pre-existing ducts, deterring greenfield overbuilds and moderating competitive intensity in mature ZIP codes.
Other drivers and restraints analyzed in the detailed report include:
- Government Broadband Stimulus Programs
- Adoption of Ultra-Low-Loss Single-Mode Fibers
- Competition from Fixed-Wireless and Satellite Broadband
For complete list of drivers and restraints, kindly check the Table Of Contents.
Segment Analysis
Loose-tube designs maintained a 33.68% revenue lead within the fiber optic cable market in 2025, owing to moisture-blocked constructions ideal for outdoor ducts and aerial spans. This segment capitalizes on government-funded rural builds, where extended temperature swings demand gel-filled or dry-core loose-tube formats for long-term reliability. Demand ties closely to statewide broadband grants that prioritize buried networks over wireless substitutes, enabling predictable furnace loading at domestic facilities owned by incumbents.
Hyperscale and colocation operators, however, are accelerating procurement of tight-buffered assemblies that demonstrate a 9.54% CAGR to 2031, reflecting growing intra-data-hall deployments where bend-insensitive jacketing and 900-µm coatings reduce installation time. Port counts per rack have tripled in AI clusters, and ribbonized tight buffers ease mass-fusion splicing to pre-terminated MPO trunks, attracting price premiums amid ongoing connector shortages. As GPU expansion favors multi-tenant buildings located near renewable energy, the cable mix skews toward flame-retardant plenum ratings, prompting vendors to retool jacketing lines for lower-toxicity compounds.
Single-mode solutions controlled 60.92% of 2025 revenue, given their long-haul reach and future-proof bandwidth for FTTH, metro, and subsea backbones. Government subsidies cement single-mode dominance for access loops where 1 Gbps services are baseline. Operators deploy standard G.652.D or bend-tolerant G.657.A2 cores to extend the life cycles of new plant investments.
Multi-mode fiber volumes are set for a 9.41% CAGR through 2031 as OM4/OM5 variants support 400G SR8 and 800G SR4 lanes inside hyperscale leaf-spine fabrics. Parallel-optic architectures limit reach to 150 m but slash transceiver costs, reclaiming share in data halls. Vendors respond with graded-index profiles optimized for 850 nm VCSEL sources that improve modal dispersion, tightening spec tolerances. The trend lifts overall volume for short-reach jumpers, enhancing factory utilization rates between long-haul campaign runs and helping buffer revenue cyclicality inherent in carrier capex cycles.
Complete Report Scope:
- By Cable Type
- Loose-tube
- Tight-buffered
- Ribbon
- Armoured
- By Mode
- Single-mode
- Multi-mode
- By Deployment Type
- Underground
- Aerial
- Submarine
- By End-user Industry
- Telecommunications
- Power Utilities
- Defense and Military
- Industrial and Manufacturing
- Medical
- By Country
- United States
- Germany
- United Kingdom
- France
- Italy
- Spain
- Netherlands
- Austria
- Switzerland
- Rest of Europe
List of Companies Covered in this Report:
- Prysmian Group
- Corning Inc.
- Nexans SA
- CommScope Holding Company Inc.
- Furukawa Electric Co., Ltd.
- Sumitomo Electric Industries Ltd.
- Sterlite Technologies Limited
- Fujikura Ltd.
- Leoni AG
- Belden Inc.
- LS Cable and System
- HUBER+SUHNER AG
- Hexatronic Group AB
- AFL (Fujikura)
- Optical Cable Corp.
- Coherent Corp. (Finisar Corporation)
- ZTT Group
- Molex LLC
Additional Benefits:
- The market estimate (ME) sheet in Excel format
- 3 months of analyst support
TABLE OF CONTENTS
1 INTRODUCTION
- 1.1 Study Assumptions and Market Definition
- 1.2 Scope of the Study
2 RESEARCH METHODOLOGY
3 EXECUTIVE SUMMARY
4 MARKET LANDSCAPE
- 4.1 Market Overview
- 4.2 Market Drivers
- 4.2.1 Surging data traffic and cloud workloads
- 4.2.2 Accelerated FTTH and 5G rollout investments
- 4.2.3 Government broadband stimulus (US BEAD/EU Digital Decade)
- 4.2.4 Adoption of ultra-low-loss single-mode fibers
- 4.2.5 Open-RAN neutral-host densification needs dark fiber
- 4.2.6 Utility-owned fiber commercialization for grid modernization
- 4.3 Market Restraints
- 4.3.1 High civil-works and right-of-way costs
- 4.3.2 Competition from fixed-wireless and satellite broadband
- 4.3.3 Skilled labour shortage for fiber splicing
- 4.3.4 Volatility in glass-preform supply chain
- 4.4 Value Chain Analysis
- 4.5 Regulatory Landscape
- 4.6 Technological Outlook
- 4.7 State of Fiber Optics in Key Industries
- 4.8 Porter's Five Forces Analysis
- 4.8.1 Threat of New Entrants
- 4.8.2 Bargaining Power of Suppliers
- 4.8.3 Bargaining Power of Buyers
- 4.8.4 Threat of Substitutes
- 4.8.5 Competitive Rivalry
- 4.9 Impact of Macroeconomic Factors on the Market
5 UNITED STATES MARKET SIZE AND GROWTH FORECASTS (VALUE)
- 5.1 By Cable Type
- 5.1.1 Loose-tube
- 5.1.2 Tight-buffered
- 5.1.3 Ribbon
- 5.1.4 Armoured
- 5.2 By Mode
- 5.2.1 Single-mode
- 5.2.2 Multi-mode
- 5.3 By Deployment Type
- 5.3.1 Underground
- 5.3.2 Aerial
- 5.3.3 Submarine
- 5.4 By End-user Industry
- 5.4.1 Telecommunications
- 5.4.2 Power Utilities
- 5.4.3 Defense and Military
- 5.4.4 Industrial and Manufacturing
- 5.4.5 Medical
- 5.5 By Country
- 5.5.1 United States
- 5.5.2 Germany
- 5.5.3 United Kingdom
- 5.5.4 France
- 5.5.5 Italy
- 5.5.6 Spain
- 5.5.7 Netherlands
- 5.5.8 Austria
- 5.5.9 Switzerland
- 5.5.10 Rest of Europe
6 COMPETITIVE LANDSCAPE
- 6.1 Market Concentration
- 6.2 Strategic Moves
- 6.3 Market Share Analysis
- 6.4 Company Profiles (includes Global level Overview, Market level overview, Core Segments, Financials as available, Strategic Information, Market Rank/Share for key companies, Products and Services, and Recent Developments)
- 6.4.1 Prysmian Group
- 6.4.2 Corning Inc.
- 6.4.3 Nexans SA
- 6.4.4 CommScope Holding Company Inc.
- 6.4.5 Furukawa Electric Co., Ltd.
- 6.4.6 Sumitomo Electric Industries Ltd.
- 6.4.7 Sterlite Technologies Limited
- 6.4.8 Fujikura Ltd.
- 6.4.9 Leoni AG
- 6.4.10 Belden Inc.
- 6.4.11 LS Cable and System
- 6.4.12 HUBER+SUHNER AG
- 6.4.13 Hexatronic Group AB
- 6.4.14 AFL (Fujikura)
- 6.4.15 Optical Cable Corp.
- 6.4.16 Coherent Corp. (Finisar Corporation)
- 6.4.17 ZTT Group
- 6.4.18 Molex LLC
7 MARKET OPPORTUNITIES AND FUTURE OUTLOOK
- 7.1 White-space and Unmet-need Assessment


