

|
시장보고서
상품코드
2125671
폴리에틸렌 테레프탈레이트(PET) 음료 포장 시장 : 시장 점유율 분석, 업계 동향 및 통계, 성장 예측(2026-2031년)Polyethylene Terephthalate (PET) Beverage Packaging - Market Share Analysis, Industry Trends & Statistics, Growth Forecasts (2026 - 2031) |
||||||
 Mordor Intelligence
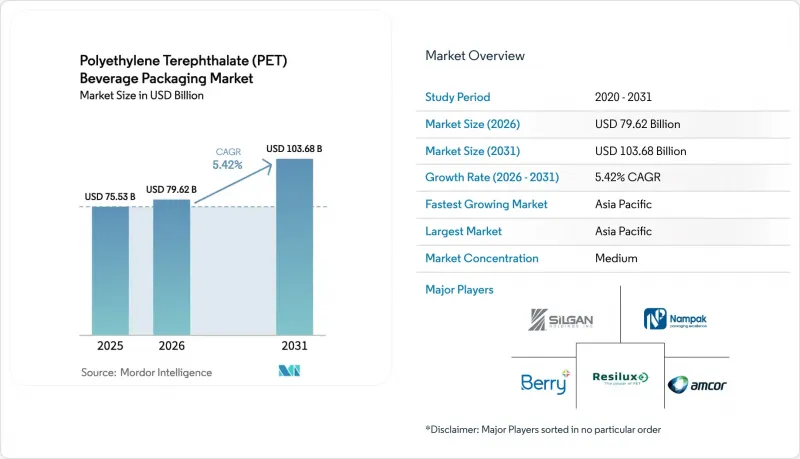
폴리에틸렌 테레프탈레이트(PET) 음료 포장 시장 규모는 2025년 755억 3,000만 달러로 평가되었고, 2026년에는 796억 2,000만 달러로 추정되고, 2026-2031년 CAGR 5.42%로 성장을 지속할 전망이며, 2031년에는 1,036억 8,000만 달러에 이를 것으로 예측됩니다.
본 보고서는 제품 유형별(병, 프리폼, 용기 등), 용량별(250ml 이하, 251-500ml, 501-1,000ml, 기타), 소재 유형별(버진 PET, 재생 PET, 기타), 최종 사용자 산업별(미네랄 워터, 탄산음료, 주스·넥타, 에너지 드링크·스포츠 드링크, 기타), 지역별로 분류되어 있습니다. 시장 전망은 금액(달러) 기준으로 제시되어 있습니다.
세계의 폴리에틸렌 테레프탈레이트(PET) 음료 포장 시장 동향 및 인사이트
뛰어난 경량성 및 강도 비율, 그리고 투명성
코카콜라의 경량화 조치로 인해 12-20온스 용기의 무게가 21g에서 18.5g으로 줄어들어, 연간 300만 톤의 PET를 절약하고 운송 시 배출량을 줄이는 동시에 탄산 함유 기준을 유지하고 있습니다. 블로우 성형 기술의 개선으로 폴리머 사슬의 배향이 최적화되고 강성이 향상됨에 따라, 컨버터는 측벽의 패널화 위험을 수반하지 않고도 수지 사용량을 줄일 수 있게 되었습니다. 링 컨테이너(Ring Container)사의 ‘Trimlite’는 산소 차단성을 유지한 채 넓은 입구의 항아리 무게를 40% 줄였으며, 캔 공급 부족으로 가격 변동이 있었던 알루미늄에 비해 PET가 비용 대비 성능 면에서 우월함을 부각시키고 있습니다. 이러한 진보는 포장비가 제품 납품 비용의 20%를 차지하는 시장에서 브랜드가 이익률을 유지하는 데 도움이 되고 있습니다. 신흥국에서의 청량음료 생산 확대에 따라, 경량 PET는 수지 수요를 비례적으로 증가시키지 않으면서도 판매량 확대를 가능하게 하여, 폴리에틸렌 테레프탈레이트(PET) 음료 포장 시장의 안정화를 더욱 촉진하고 있습니다.
재활용 병 및 rPET 함유 병에 대한 수요 급증
2025년을 목표로 한 EU의 재생 소재 25% 함유 규정과 2025년 4월부터 시행되는 인도의 30% 의무화 조치로 인해, 각 브랜드는 재활용 업체와 공급 계약을 반드시 체결해야 하며, 그렇지 않을 경우 최대 30%의 가격 프리미엄을 지불해야 할 위험에 직면해 있습니다. 유럽에서는 2022년에 회수율이 75%로 상향 조정되어, 병 1개당 rPET 함유율은 평균 24%를 기록했습니다. DePoly사가 2,300만 달러를 투자한 스위스 공장과 GR3N사의 마이크로파 분해 기술을 통해 오염된 폐기물에서 버진 등급의 원료를 얻을 수 있게 되어 공급 부족이 완화되고 있습니다. 재활용 자산을 보유한 통합형 컨버터는 원료를 확보하고 협상력을 강화하고 있으며, 이는 폴리에틸렌 테레프탈레이트(PET) 음료 포장 시장의 성장을 뒷받침하고 있습니다.
전 세계적으로 일회용 플라스틱에 대한 과세 및 금지 조치가 강화되고 있습니다.
오리건주의 병 법안은 현재 와인도 대상으로 하고 있으며, 10센트의 보증금이 추가됨에 따라 취급 비용이 증가하여 PET 경량화에 따른 경제성이 저하되고 있습니다. 캘리포니아주에서는 2027년까지 캡 고정식 규제의 도입이 검토되고 있으며, 이로 인해 전 세계 브랜드들은 EU 기준에 부합하는 표준화된 포장 형태로 전환하도록 촉진되고 있습니다. 규제의 불일치로 인해 브랜드들은 여러 가지 패키지 변형을 관리할 수밖에 없게 되어, 재고 비용과 금형 비용 증가를 초래하고 있습니다. 중소 음료 제조업체들은 불균형한 비용 압박에 직면하고 있으며, 규제의 복잡성을 잘 헤쳐 나갈 수 있는 대형 다국적 기업으로 시장 점유율이 이동하고 있습니다.
부문 분석
병은 2025년 매출의 70.42%를 차지했으며, 폴리에틸렌 테레프탈레이트(PET) 음료 포장 시장의 핵심으로 자리 잡고 있습니다. 이 부문은 금형 가동률이 높고, 전 세계적으로 표준화되어 있으며, 탄산 음료 및 비탄산 음료와의 호환성이 뛰어나다는 장점이 있습니다. Origin Materials사의 모든 PET 테더 캡은 단일 소재로 재활용이 가능하며, 향후 캡 소재가 PP나 HDPE로 전환될 것임을 시사합니다. 고도의 산소 차단성이 필요한 기능성 음료 수요 증가에 따라, 폴리에틸렌 테레프탈레이트(PET) 음료 포장 시장 내 병 시장 규모는 확대될 것으로 예측됩니다.
캡 시장은 EU의 법규와 650억 달러 규모의 ‘테더가 부착된 캡’ 시장의 견인에 힘입어 7.76%라는 가장 높은 연평균 성장률(CAGR)을 기록하고 있습니다. 이미 20개 이상의 컨버터가 포춘 500대 기업을 대상으로 한 PET 캡 설계 인증을 획득했습니다. 단일 소재 캡은 생산 라인의 간소화를 약속하고, 혼합 폴리머로 인한 오염을 제거함으로써 재활용의 경제성을 높이며, 기존에는 상품화되었던 부문에서 차별화의 새로운 가능성을 열어줍니다. 프리폼은 특히 병 성형이 충전 라인 근처에서 이루어지는 지역에서 거래되는 중간재로서 여전히 중요성을 유지하고 있지만, 저(jar)는 프리미엄 차나 콤부차용 틈새 시장에 머물러 있습니다.
501-1,000ml 용량대는 물, 청량음료, 즉석 음용 커피 등 폭넓은 용도에 대응할 수 있는 범용성 덕분에 2025년에는 폴리에틸렌 테레프탈레이트(PET) 음료 포장 시장에서 38.44%의 점유율을 차지했습니다. 그러나 250ml 이하 용기는 분량 관리 및 외출 시 소비 경향을 반영하여 6.93%라는 가장 높은 연평균 성장률(CAGR)을 보이고 있습니다. 각 브랜드가 온스당 프리미엄 가격 정책을 전개함에 따라, 이러한 소형 폴리에틸렌 테레프탈레이트(PET) 음료 포장 시장 규모는 확대될 것으로 예측됩니다.
소형 병은 에너지 드링크나 기능성 음료가 편의점에서 충동 구매를 유도하는 데 도움이 됩니다. PET의 경량성은 유리제 미니 병에 비해 팔레트 적재 효율을 향상시키는 동시에, 투명한 벽면은 기능성 음료에 포함된 천연 착색료를 돋보이게 합니다. 1리터를 초과하는 대용량 제품은 가족 단위 소비에 적합하지만, 냉장고 문 크기의 제약에 직면해 있습니다. 온라인 식료품 판매의 성장에 따라, 공간 활용률을 극대화하는 정사각형 단면이나 손잡이가 없는 주전자에 대한 관심이 높아지고 있습니다.
지역별 분석
아시아태평양은 2025년에 전 세계 매출의 42.63%를 차지했으며, 연평균 성장률(CAGR) 6.29%로 확대되고 있습니다. 중산층의 소득 증가, 급속한 도시화, 소매 네트워크의 확산으로 인해 포장된 수분 보충 음료에 대한 수요가 높아지고 있습니다. 중국의 반덤핑 관세는 국내 수지 제조업체를 보호하는 한편, 2025년 4월부터 시행되는 인도의 rPET 30% 의무화 규정은 전 세계 보틀링 기업 간의 후방 통합을 가속화하고 있습니다. 일본과 한국은 다운스트림 공정에서 라벨 박리 비용을 최소화하는 라벨리스 병을 주도하며, 지역의 혁신 역량을 돋보이게 하고 있습니다.
북미는 정착된 소비 습관과 프리미엄 기능성 음료의 출시로 여전히 2위 규모 시장을 자랑하는 지역입니다. 캘리포니아주에서 검토가 진행 중인 재활용 소재 함유율에 관한 제안과 오리건주의 병 재활용법 확대에 따라 규정 준수의 복잡성이 증가하고 있습니다. 캐나다와 멕시코는 대량의 수지를 공급하고 있으며, 미국의 원료 가격이 급등했을 때 무역 흐름의 균형을 유지하고 있습니다.
유럽은 규제가 가장 엄격한 지역으로, 캡의 고정화 및 재활용 소재 함유율 기준 상향이 특징입니다. 수거 인프라를 통해 75%의 수거율을 달성하고 있으나, rPET 수요는 이미 공급을 초과하고 있어 스페인, 폴란드, 독일에서는 공장 투자가 활발해지고 있습니다. 북유럽 국가들에서는 유리병을 선호하는 보증금 제도가 대체 위험을 초래하고 있지만, 소매점에서 시범적으로 도입함에 따라 가볍고 재충전이 가능한 PET 제품이 등장하기 시작했습니다.
라틴아메리카, 중동 및 아프리카 시장 점유율은 작지만, 기후 조건과 인구 동향이 음료 소비를 뒷받침하고 있어 견조한 성장세를 보이고 있습니다. 환율 변동과 지역에 따라 차이가 있는 재활용 인프라가 시장 진출 전략을 좌우하고 있어, 각 변환업체들은 원료를 확보하면서 브랜드 신뢰도를 쌓기 위해 현지 수거 업체나 NGO와 제휴하고 있습니다.
기타 혜택 :
- 엑셀 형식 시장 예측(ME) 시트
- 3개월간 애널리스트 지원
자주 묻는 질문
목차
제1장 서론
제2장 조사 방법
제3장 주요 요약
제4장 시장 구도
제5장 시장 규모 및 성장 예측
제6장 경쟁 구도
제7장 시장 기회 및 향후 전망
AJY 26.09.15According to Mordor Intelligence, the polyethylene terephthalate (PET) beverage packaging market size is expected to grow from USD 75.53 billion in 2025 to USD 79.62 billion in 2026 and is forecast to reach USD 103.68 billion by 2031 at 5.42% CAGR over 2026-2031.
This report is Segmented by Product Type (Bottles, Preforms, Jars, and More), Capacity (<=250ml, 251-500ml, 501-1, 000ml, and More), Material Type (Virgin PET, Recycled PET, and More), End-User Industry (Water Bottles, Carbonated Drinks, Juices and Nectars, Energy and Sports Drinks, and More), and Geography. The Market Forecasts are Provided in Terms of Value (USD).
Global Polyethylene Terephthalate (PET) Beverage Packaging Market Trends and Insights
Superior lightweight-to-strength ratio and clarity
Coca-Cola's lightweighting cut the 12-20 oz bottle from 21 g to 18.5 g, saving 3 million t of PET yearly and lowering haulage emissions while safeguarding carbonation standards. Blow-molding refinements orient polymer chains for higher rigidity, letting converters lower resin use without risk of side-wall paneling. Ring Container's Trimlite cut wide-mouth jar weight by 40% while keeping oxygen barrier, underlining PET's cost-to-performance edge versus aluminum, which saw price swings during can shortages. Such advances help brands defend margins in markets where packaging can be 20% of delivered product cost. As emerging economies scale soft-drink output, lightweight PET unlocks volume growth without proportional resin demand, further stabilising the polyethylene terephthalate (PET) beverage packaging market.
Surging demand for recycled and rPET-content bottles
The EU's 25% recycled content rule for 2025 and India's 30% mandate from April 2025 are forcing brands to lock in supply contracts with recyclers or risk paying price premiums of up to 30%. Europe lifted collection rates to 75% in 2022, allowing average bottle rPET content of 24%. DePoly's USD 23 million Swiss plant and GR3N's microwave depolymerisation add virgin-grade feedstock from contaminated waste, narrowing the deficit. Integrated converters that own recycling assets secure feedstock and strengthen negotiation power, fuelling growth in the polyethylene terephthalate (PET) beverage packaging market.
Single-use plastic taxes and bans tightening globally
Oregon's Bottle Bill now covers wine, adding a 10-cent deposit that raises handling cost and blunts PET's lightweight economics. California is considering tethered-cap rules by 2027, nudging global brand lines toward standardised EU-compliant formats. Fragmented regulations force brands to manage multiple packaging variants, driving up inventory and tooling fees. Smaller beverage firms face disproportionate cost pressure, nudging market share toward large multinationals that can navigate compliance complexity.
Other drivers and restraints analyzed in the detailed report include:
- Expansion of bottled water and functional beverage categories
- Bio-based PET capacity additions unlocking EPR credits
- Volatility in PTA/MEG feedstock prices
For complete list of drivers and restraints, kindly check the Table Of Contents.
Segment Analysis
Bottles accounted for 70.42% of 2025 revenue and remain the backbone of the polyethylene terephthalate (PET) beverage packaging market. The segment benefits from high tooling utilisation, global standardisation, and compatibility with carbonated and still beverages. Origin Materials' all-PET tethered cap unlocks mono-material recycling, signalling eventual closure migration away from PP and HDPE. The polyethylene terephthalate (PET) beverage packaging market size for bottles is projected to rise alongside functional drinks that demand advanced oxygen barriers.
Closures record the fastest 7.76% CAGR, bolstered by EU legislation and the USD 65 billion opportunity in attached caps. Over 20 converters already qualified PET closure designs for Fortune 500 clients. Mono-material closures promise line-side simplification and remove mixed-polymer contamination, strengthening recycling economics and opening a new frontier of differentiation inside a previously commodity-like segment. Preforms retain importance as traded intermediates, especially in regions where bottle blowing happens close to filling lines, while jars stay niche for premium teas and kombucha.
The 501-1,000 ml range held 38.44% polyethylene terephthalate (PET) beverage packaging market share in 2025 thanks to its versatility across water, soft drinks and ready-to-drink coffees. Yet containers not exceeding 250 ml show the highest 6.93% CAGR, mirroring portion-control and on-the-go consumption. The polyethylene terephthalate (PET) beverage packaging market size for these small formats is forecast to rise as brands deploy premium price points per ounce.
Small bottles help energy drinks and nutraceutical beverages capture impulse purchases at convenience stores. PET's light weight improves pallet efficiency relative to glass miniatures, while clear walls showcase natural colourants in functional beverages. Larger formats above 1 L cater to family consumption but face refrigerator-door dimension constraints. Growth in e-grocery triggers interest in square cross-sections and handle-less jugs that maximise cube utilisation.
Complete Report Scope:
- By Product Type
- Bottles
- Preforms
- Jars
- Lids/Caps and Closures
- Other Products
- By Capacity (Fill Volume) Type
- <= 250 ml
- 251 - 500 ml
- 501 - 1,000 ml
- 1,001 - 2,000 ml
- > 2,000 ml
- By Material Type
- Virgin PET
- Recycled PET (rPET)
- Bio-based PET
- Other Material Types
- By End-user Industry
- Water Bottles
- Carbonated Drinks
- Juices and Nectars
- Energy and Sports Drinks
- Alcoholic Beverages
- Functional and RTD Beverages
- Other End-user Industries
- By Geography
- North America
- United States
- Canada
- Mexico
- Europe
- France
- Germany
- Italy
- Spain
- United Kingdom
- Russia
- Rest of Europe
- Asia-Pacific
- China
- India
- Japan
- South Korea
- Australia and New Zealand
- Rest of Asia-Pacific
- South America
- Brazil
- Argentina
- Rest of South America
- Middle East
- Saudi Arabia
- UAE
- Turkey
- Rest of Middle East
- Africa
- South Africa
- Nigeria
- Rest of Africa
- North America
Geography Analysis
Asia-Pacific held 42.63% of global revenues in 2025 and expands at 6.29% CAGR. Rising middle-class incomes, rapid urbanisation and retail network penetration lift demand for packaged hydration. China's anti-dumping duties protect domestic resin producers, while India's 30% rPET rule from April 2025 accelerates backward integration among global bottlers. Japan and South Korea spearhead labelless bottles that minimise downstream delabelling costs, highlighting regional innovation strength.
North America remains the second-largest region with entrenched consumption habits and premium functional drink launches. California's evolving recycled-content proposals and Oregon's expanded bottle bill raise compliance complexity. Canada and Mexico supply resin at scale, balancing trade flows when US feedstock prices spike.
Europe is the most regulated landscape, featuring tethered caps and escalating recycled-content thresholds. Collection infrastructure allows 75% retrieval rates, yet rPET demand already overshoots supply, spurring plant investment in Spain, Poland and Germany. Nordic glass-favoured deposit systems present substitution risk, but lightweight refillable PET alternatives begin to appear in retail pilots.
Latin America, the Middle East and Africa contribute smaller shares but post solid growth as climate conditions and demographic profiles drive beverage uptake. Currency fluctuations and patchy recycling infrastructure shape entry strategies, prompting converters to partner with local collectors and NGOs to secure feedstock while building brand goodwill.
- Amcor plc
- ALPLA Group
- Berry Global Group Inc.
- Plastipak Holdings Inc.
- Silgan Holdings Inc.
- Resilux NV
- Graham Packaging Company L.P.
- Nampak Ltd
- Retal Industries Ltd
- Indorama Ventures PCL
- Alpek, S.A.B. de C.V.
- Visy Industries Holdings Pty Ltd
- Sidel Group
- KHS GmbH
- Pactiv Evergreen Inc.
- CKS Packaging Inc.
- Altium Packaging LLC
- Esterform Packaging Ltd
- PET Power B.V.
- Zhejiang Zhongsu Packaging Materials Co., Ltd.
Additional Benefits:
- The market estimate (ME) sheet in Excel format
- 3 months of analyst support
TABLE OF CONTENTS
1 INTRODUCTION
- 1.1 Study Assumptions and Market Definition
- 1.2 Scope of the Study
2 RESEARCH METHODOLOGY
3 EXECUTIVE SUMMARY
4 MARKET LANDSCAPE
- 4.1 Market Overview
- 4.2 Market Drivers
- 4.2.1 Superior lightweight-to-strength ratio and clarity
- 4.2.2 Surging demand for recycled and rPET-content bottles
- 4.2.3 Expansion of bottled water and functional beverage categories
- 4.2.4 Bio-based PET capacity additions unlocking EPR credits
- 4.2.5 EU tethered-cap directive accelerating bottle redesign
- 4.2.6 On-premise refill programs pivoting to refillable PET
- 4.3 Market Restraints
- 4.3.1 Single-use-plastic taxes and bans tightening globally
- 4.3.2 Volatility in PTA/MEG feedstock prices
- 4.3.3 Aluminum-can substitution in carbonated drinks
- 4.3.4 Deposit-return schemes favouring glass in DACH and Nordics
- 4.4 Value Chain Analysis
- 4.5 Regulatory Landscape
- 4.6 Technological Outlook (Design-for-Recycling, tethered caps)
- 4.7 Porter's Five Forces Analysis
- 4.7.1 Threat of New Entrants
- 4.7.2 Bargaining Power of Suppliers
- 4.7.3 Bargaining Power of Buyers
- 4.7.4 Threat of Substitutes
- 4.7.5 Competitive Rivalry
- 4.8 Import-Export Flow Analysis
- 4.9 Impact of Ukraine-Russia Conflict on Resin and Energy Costs
- 4.10 Global Beverage Industry Landscape
- 4.11 Global Beverage Packaging Industry Landscape
- 4.12 Assessment of Macro Economic Trends on the Market
5 MARKET SIZE AND GROWTH FORECASTS (VALUES)
- 5.1 By Product Type
- 5.1.1 Bottles
- 5.1.2 Preforms
- 5.1.3 Jars
- 5.1.4 Lids/Caps and Closures
- 5.1.5 Other Products
- 5.2 By Capacity (Fill Volume) Type
- 5.2.1 <= 250 ml
- 5.2.2 251 - 500 ml
- 5.2.3 501 - 1,000 ml
- 5.2.4 1,001 - 2,000 ml
- 5.2.5 > 2,000 ml
- 5.3 By Material Type
- 5.3.1 Virgin PET
- 5.3.2 Recycled PET (rPET)
- 5.3.3 Bio-based PET
- 5.3.4 Other Material Types
- 5.4 By End-user Industry
- 5.4.1 Water Bottles
- 5.4.2 Carbonated Drinks
- 5.4.3 Juices and Nectars
- 5.4.4 Energy and Sports Drinks
- 5.4.5 Alcoholic Beverages
- 5.4.6 Functional and RTD Beverages
- 5.4.7 Other End-user Industries
- 5.5 By Geography
- 5.5.1 North America
- 5.5.1.1 United States
- 5.5.1.2 Canada
- 5.5.1.3 Mexico
- 5.5.2 Europe
- 5.5.2.1 France
- 5.5.2.2 Germany
- 5.5.2.3 Italy
- 5.5.2.4 Spain
- 5.5.2.5 United Kingdom
- 5.5.2.6 Russia
- 5.5.2.7 Rest of Europe
- 5.5.3 Asia-Pacific
- 5.5.3.1 China
- 5.5.3.2 India
- 5.5.3.3 Japan
- 5.5.3.4 South Korea
- 5.5.3.5 Australia and New Zealand
- 5.5.3.6 Rest of Asia-Pacific
- 5.5.4 South America
- 5.5.4.1 Brazil
- 5.5.4.2 Argentina
- 5.5.4.3 Rest of South America
- 5.5.5 Middle East
- 5.5.5.1 Saudi Arabia
- 5.5.5.2 UAE
- 5.5.5.3 Turkey
- 5.5.5.4 Rest of Middle East
- 5.5.6 Africa
- 5.5.6.1 South Africa
- 5.5.6.2 Nigeria
- 5.5.6.3 Rest of Africa
- 5.5.1 North America
6 COMPETITIVE LANDSCAPE
- 6.1 Market Concentration
- 6.2 Strategic Moves
- 6.3 Market Share Analysis
- 6.4 Company Profiles (includes Global level Overview, Market level overview, Core Segments, Financials as available, Strategic Information, Market Rank/Share for key companies, Products and Services, and Recent Developments)
- 6.4.1 Amcor plc
- 6.4.2 ALPLA Group
- 6.4.3 Berry Global Group Inc.
- 6.4.4 Plastipak Holdings Inc.
- 6.4.5 Silgan Holdings Inc.
- 6.4.6 Resilux NV
- 6.4.7 Graham Packaging Company L.P.
- 6.4.8 Nampak Ltd
- 6.4.9 Retal Industries Ltd
- 6.4.10 Indorama Ventures PCL
- 6.4.11 Alpek, S.A.B. de C.V.
- 6.4.12 Visy Industries Holdings Pty Ltd
- 6.4.13 Sidel Group
- 6.4.14 KHS GmbH
- 6.4.15 Pactiv Evergreen Inc.
- 6.4.16 CKS Packaging Inc.
- 6.4.17 Altium Packaging LLC
- 6.4.18 Esterform Packaging Ltd
- 6.4.19 PET Power B.V.
- 6.4.20 Zhejiang Zhongsu Packaging Materials Co., Ltd.
7 MARKET OPPORTUNITIES AND FUTURE OUTLOOK
- 7.1 White-space and Unmet-need Assessment


