

|
시장보고서
상품코드
2154430
투자자용 통신 네트워크 경험 인텔리전스 : 시장 점유율 분석, 업계 동향과 통계, 성장 예측(2026-2031년)Telecom Network Experience Intelligence For Investors - Market Share Analysis, Industry Trends & Statistics, Growth Forecasts (2026 - 2031) |
||||||
 Mordor Intelligence
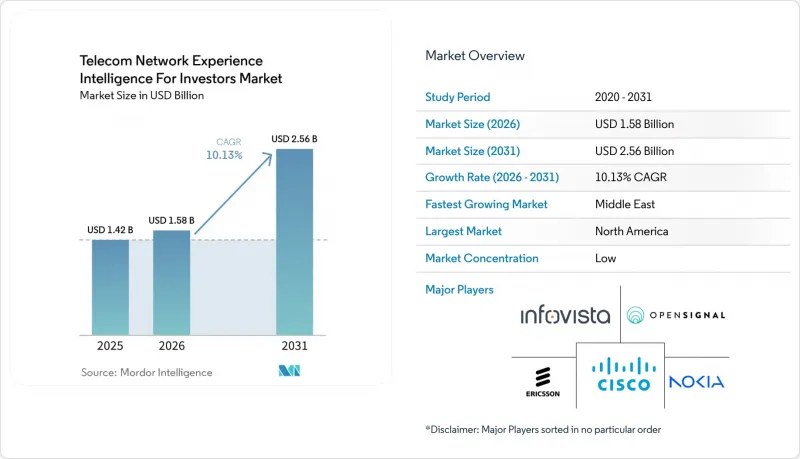
에 따르면 투자자용 통신 네트워크 체험 인텔리전스 시장 규모는 2025년 14억 2,000만 달러, 2026년 15억 8,000만 달러에서 2031년까지 25억 6,000만 달러로 확대할 것으로 예측되고 있으며, 2026-2031년까지 연평균 성장률(CAGR)은 10.13%에 달할 전망입니다.
투자자를 위한 글로벌 통신 네트워크 경험 인텔리전스 시장의 동향 및 인사이트
5G 독립형(SA) 및 네트워크 슬라이싱 보장에 대한 수요
상용 5G 독립형(SA) 서비스의 등장으로 네트워크 슬라이싱은 단순한 기술적 기능이 아닌, 판매 가능한 기업 서비스로 자리 잡았습니다. 이에 따라 통신사업자들은 각 슬라이스가 약속된 서비스 수준을 충족하고 있는지 여부를 입증할 수 있는 감사 가능한 기록이 필요합니다. 2025년 통신사업자 설문조사에 따르면 26%의 사업자가 네트워크 슬라이싱을 이미 도입했거나 시험을 시작했으며, 관련 보증 수요의 상당 부분이 향후 더욱 증가할 것으로 예상됩니다. 3GPP는 여러 슬라이스에 걸친 서비스 수준 계약(SLA)을 관리하는 메커니즘으로 ‘보증 폐쇄 제어 루프(Assurance Closed Control Loop)’를 정의하고 있습니다. NETSCOUT는 슬라이스별 서비스 수준 감사 추적을 제공하며, 이는 차별화된 서비스 가격 책정의 근거로 모니터링을 활용하여야 할 필요성을 반영한 것입니다. 이러한 요구 사항은 서비스 품질에 대한 증거가 운영 팀과 재무 감사 담당자 모두에게 유용하므로 투자자를 대상으로 한 통신 네트워크 경험 인텔리전스 시장의 더 광범위한 채택을 촉진하고 있습니다.
AI를 활용한 예측형 어슈어런스 및 폐쇄 루프 자동화
AI 기반 보증은 네트워크 운영을 ‘문제 탐지’에서 ‘자동 수정’으로 변화시키고 있습니다. 노키아와 Google Cloud는 2026년 6월, Gemini를 탑재한 여러 AI 에이전트가 Nokia Assurance Center에 통합될 것이라고 발표했으며, 노키아는 이번 도입을 통해 문제 해결 시간을 대폭 단축할 수 있을 것이라고 밝혔습니다. ETSI는 네트워크 디지털 트윈과 폐쇄 루프 자동화를 보다 고도화된 자율 네트워크를 향한 단계로 규정하고 있습니다. 기본적인 이상 감지가 보편화됨에 따라 각 벤더들은 멀티 벤더 텔레메트리 데이터의 품질, 지속성 및 거버넌스에 점점 더 의존하게 되고 있습니다. 오랜 운영 실적을 가진 플랫폼은 해당 정보를 활용하여 모델 훈련 및 워크플로우의 신뢰성을 향상시킬 수 있습니다. 이에 따라 데이터 스튜어드십은 투자자 대상 통신 네트워크 경험 인텔리전스 시장에서 중요한 경쟁 요소가 되고 있습니다.
레거시 OSS의 데이터 사일로와 KPI 정의의 불일치
기존 OSS 아키텍처는 정적인 네트워크나 보다 제한적인 공급업체 환경을 가정하여 설계되었습니다. 그 결과, AI 기반 보증 시스템이 요구하는 통합된 실시간 서비스 뷰를 제공하지 못하는 경우가 많습니다. 통신사업자가 도메인 간 분석을 적용하려면 개별 데이터 모델을 지속적으로 변환해야 합니다. 텔레포니카의 현대화 노력은 이러한 운영상 과제를 여실히 보여주고 있습니다. 이러한 상황은 판매 주기의 장기화, 고객 확보 비용의 상승, 그리고 전문 서비스 업무량의 증가를 초래합니다. 또한 투자자 대상 통신 네트워크 경험 인텔리전스 시장에서 벤더가 기대하는 ‘소프트웨어 스케일’을 통한 경제적 효과의 실현을 지연시킬 가능성도 있습니다.
부문 분석
2025년, 소프트웨어는 ‘투자자 대상 통신 네트워크 경험 인텔리전스’ 시장 점유율의 33.42%를 차지하고 있으며, 이는 통신사업자들이 여전히 라이선싱형 플랫폼을 활용하여 내부 어슈어런스 기능을 구축하고 있음을 보여줍니다. 서비스 부문은 2026-2031년까지 연평균 성장률(CAGR) 10.44%로 확대될 것으로 예상됩니다. 통신사업자들은 AI 기반 보증 시스템을 대규모로 구축하기 위해 전문가의 지원을 점점 더 필요로 하고 있습니다. RADCOM의 보고서에 따르면 네트워크 분야의 상당수 리더들이 AIOps 인력 부족을 과제로 꼽고 있습니다. 이러한 기술 격차로 인해 운영 연속성에 대한 필요성이 관리형 보증 서비스에 대한 수요로 전환되고 있습니다.
Amdocs, Accenture 및 IBM은 기본적인 모니터링 기능을 넘어서는 관리형 보증 계약을 제공하고 있습니다. 이러한 계약은 소프트웨어 플랫폼에 대한 접근권보다 서비스 수준 성과에 중점을 두는 경향이 강해지고 있습니다. 공급업체가 측정 가능한 비즈니스 성과를 입증할 수 있다면, 고객 1인당 수익을 증가시킬 수 있습니다. 또한 벤더는 지속적인 가치를 입증해야 하므로, 계약에 대한 종속도도 낮아집니다. 따라서 투자자 대상 통신 네트워크 경험 인텔리전스(TNEI) 업계에서는 단순한 소프트웨어 교체가 아닌, 운영 기술 부족에 기인한 서비스 수요가 나타나고 있습니다.
클라우드 기반 도입은 2025년에 23.76%를 차지할 것으로 예상되며, 2026-2031년까지 연평균 성장률(CAGR) 10.68%로 확대될 전망입니다. 현재의 선도적 지위와 가장 빠른 성장세가 맞물려, 클라우드 네이티브 어슈어런스는 신규 도입시 선호되는 아키텍처로 자리 잡고 있습니다. 노키아는 2025년 6월, AI를 활용한 운영을 실현하기 위해 Vertex AI와 BigQuery를 채택한 ‘Autonomous Network Fabric’을 발표했습니다. 또한 이 설계에서는 데이터 상주 요건이 부과된 관할 구역을 위해 일부 온프레미스 처리도 유지하고 있습니다.
국가 안보나 데이터 현지화 규제로 인해 현지 처리가 요구되는 경우, 온프레미스 시스템은 여전히 중요합니다. 하이브리드 구성은 기밀 데이터 관리를 유지하면서 클라우드 기능이 필요한 통신사업자에게 실용적인 선택지가 됩니다. RADCOM ACE는 5G 코어 환경을 포함한 퍼블릭 및 프라이빗 클라우드 환경을 위한 클라우드 네이티브 기능으로 활용 가능합니다. 이를 통해 기업 및 정부 산하 프라이빗 네트워크 사업자의 클라우드 아키텍처 활용 범위가 확대됩니다. 투자자 대상의 통신 네트워크 경험 인텔리전스 시장에서는 완전한 온프레미스 구축이 명확한 현지 처리 요건의 적용을 받는 통신사업자로 계속 제한될 가능성이 높습니다.
네트워크 경험 벤치마킹은 규제 보고, 경쟁력 있는 마케팅 및 자본 지출 계획을 지원하기 위해 2025년에는 22.27%의 점유율을 차지했습니다. 고객 경험 및 해지율 분석은 2026-2031년까지 연평균 성장률(CAGR) 10.59%로 확대될 것으로 예측됩니다. 통신사업자들은 실시간 신호 품질과 가입자 행동 모델을 연계하고 있습니다. Opensignal의 ‘Network Experience Suite’는 네트워크 성능과 해당 지역의 가입자 이탈 행동을 거의 실시간으로 연결합니다. 이를 통해 통신사업자는 정기 보고서에 반영되기 전에 조기 해지 징후에 대응할 수 있게 됩니다.
서비스 및 경험 품질(QoE) 보장은 성능, 장애, 이벤트 분석과 결합되어 더욱 정교한 분석을 위한 기반으로 계속 작용하고 있습니다. 통신사업자는 일반적으로 고객 유지 모델을 도입하기 전에 이러한 기능을 필요로 합니다. 이러한 일련의 과정을 통해 기존 고객 계정 내에서 업그레이드 경로가 형성됩니다. 2026년 5월에 개최된 ITU 워크숍에서는 서비스 품질(QoS) 및 경험 품질(QoE) 벤치마크를 위한 새로운 측정 기법으로의 전환이 강조되었습니다. 지속적인 표준 변경은 업데이트 수요를 창출하며, 투자자 대상 통신 네트워크 경험 인텔리전스 시장에서 공급업체의 진입 요건을 높이고 있습니다.
지역별 분석
북미는 2025년에 31.77%의 점유율을 차지했으며, 5G의 선도적인 상용화와 견고한 기관 투자자 기반에 힘입었습니다. 미국의 통신사업자들은 실사 및 인프라 재검토 과정에서 독립적인 품질 벤치마크를 활용하고 있습니다. AT&T, T-Mobile, Verizon 간의 경쟁은 설득력 있는 품질 증거를 생성하는 시스템에 대한 투자를 촉진하고 있습니다. Opensignal은 2026년 7월 미국 모바일 네트워크 경험 조사에서 이러한 통신사들에 대해 보고했습니다. 캐나다에서는 관리형 보증 서비스에 대한 수요가 있는 반면, 멕시코에서는 사후 대응형 모니터링에서 예측 인텔리전스로 전환되고 있습니다.
유럽은 두 번째로 큰 시장 클러스터이며, 독일, 영국, 프랑스, 북유럽 국가들이 성숙한 벤치마킹 및 품질 보고 수요를 지원하고 있습니다. Vodafone Germany의 EXFO Context는 모바일 및 유선 통신 사업 전반에 걸친 제로 터치 자동화를 지원합니다. 아시아태평양은 통신사업자 수가 가장 많으며, 새로운 자율형 네트워크 기능의 시험장 역할을 하고 있습니다. 노키아는 2026년 DTW26에서 NTT 도코모와 공동으로 자율형 네트워크 테스트를 시행했습니다. 인도에서 제안된 5G 슬라이싱 품질 프레임워크는 본격적인 상용 서비스 개시에 앞서, 규정 준수를 기반으로 한 성능 입증에 대한 수요를 시사하고 있습니다.
중동은 2026-2031년까지 연평균 성장률(CAGR) 10.56%로 확대될 것으로 예상되며, 투자자 대상 통신 네트워크 경험 인텔리전스 시장에서 가장 두드러진 성장을 보일 것으로 전망됩니다. 걸프협력회의(GCC) 회원국의 통신사업자들은 5G 독립형(SA) 프로그램을 추진하고 있는 반면, 정부계 펀드 투자자들은 통신 인프라 심사를 위해 검증된 증거를 요구하고 있습니다. Ooredoo는 2026년 2월, Polystar와 5G 독립형(SA)에 대한 투자를 위한 네트워크 전반의 모바일 및 고정 광대역 분석에 관한 기본 협약을 체결했습니다. 남미와 아프리카는 여전히 소규모 시장이지만, 브라질의 품질 프레임워크와 남아프리카공화국 및 이집트에서의 전개 활동이 수요를 지원하고 있습니다. 높은 도입 비용과 AIOps 기술 인력 부족이 아프리카 및 남미 전역에서의 더 광범위한 보급을 여전히 저해하고 있습니다.
기타 혜택:
- 엑셀 형식의 시장 예측(ME) 시트
- 3개월간의 애널리스트 지원
자주 묻는 질문
목차
제1장 서론
- 조사 전제조건과 시장 정의
- 조사 범위
제2장 조사 방법
제3장 개요
제4장 시장 구도
- 시장 개요
- 시장 성장 촉진요인
- 시장 성장 억제요인
- 거시경제 요인이 시장에 미치는 영향
- 업계 밸류체인 분석
- 규제 상황
- 기술 전망
- Porter's Five Forces 분석
제5장 시장 규모와 성장 예측
- 컴포넌트별
- 배포 모드별
- 솔루션 기능별
- 네트워크 도메인별
- 커넥티비티 테크놀러지별
- 최종사용자별
- 조직 규모별
- 지역별
- 북미
- 미국
- 캐나다
- 멕시코
- 남미
- 브라질
- 아르헨티나
- 기타 남미 국가
- 유럽
- 독일
- 영국
- 프랑스
- 이탈리아
- 스페인
- 러시아
- 기타 유럽 국가
- 아시아태평양
- 중국
- 일본
- 인도
- 한국
- 호주
- 기타 아시아태평양 국가
- 중동
- 사우디아라비아
- 아랍에미리트
- 튀르키예
- 기타 중동 국가
- 아프리카
- 남아프리카공화국
- 이집트
- 기타 아프리카 국가
- 북미
제6장 경쟁 구도
- 시장 집중도
- 전략적 동향
- 시장 점유율 분석
- 기업 개요
- Cisco Systems, Inc.
- Telefonaktiebolaget LM Ericsson
- Nokia Corporation
- Huawei Technologies Co., Ltd.
- Infovista SAS
- Opensignal, Inc.
- Ookla LLC
- Accenture plc
- RADCOM Ltd.
- VIAVI Solutions Inc.
- NETSCOUT SYSTEMS, INC.
- Amdocs Limited
- International Business Machines Corporation
- Oracle Corporation
- Juniper Networks, Inc.
- Ciena Corporation
- Spirent Communications plc
- EXFO Inc.
- Mycom OSI Limited
제7장 시장 기회와 향후 전망
KSA 26.10.23According to Mordor Intelligence, the telecom network experience intelligence for investors market size is projected to expand from USD 1.42 billion in 2025 and USD 1.58 billion in 2026 to USD 2.56 billion by 2031, registering a CAGR of 10.13% between 2026 to 2031.
Global Telecom Network Experience Intelligence For Investors Market Trends and Insights
5G Standalone and Network Slicing Assurance Demand
Commercial 5G standalone services make network slicing a sellable enterprise service rather than a technical capability. Operators therefore need auditable records that show whether each slice meets its promised service level. A 2025 operator survey found that 26% of operators had deployed or begun testing network slicing, indicating that much of the related assurance demand remains ahead. 3GPP identifies assurance closed control loops as a mechanism for managing multiple slice service-level agreements. NETSCOUT offers per-slice service-level audit trails, reflecting the need to use monitoring as support for differentiated service pricing. This need supports wider adoption in the telecom network experience intelligence for investors market because service quality evidence can serve both operating teams and financial reviewers.
AI-Driven Predictive Assurance and Closed-Loop Automation
AI-enabled assurance is changing network operations from issue detection to automated correction. Nokia and Google Cloud announced in June 2026 that multiple Gemini-powered AI agents would be embedded in Nokia Assurance Center, and Nokia said the deployment can significantly reduce problem-solving time. ETSI describes network digital twins and closed-loop automation as steps toward higher levels of autonomous networks. As basic anomaly detection becomes more common, vendors depend more on the quality, continuity, and governance of their multi-vendor telemetry data. Platforms with longer operational histories can use that information to improve model training and workflow reliability. This makes data stewardship an important competitive factor in the telecom network experience intelligence for investors market.
Legacy OSS Data Silos and Inconsistent KPI Semantics
Legacy OSS architectures were designed for static networks and narrower supplier environments. They often cannot provide the unified, real-time service view that AI-based assurance systems require. Separate data models need ongoing transformation before operators can apply cross-domain analytics. Telefonica's modernization work illustrates this operating challenge. These conditions lengthen sales cycles, raise customer acquisition costs, and increase professional-services work. They can delay the software-scale economics expected by vendors in the telecom network experience intelligence for investors market.
Other drivers and restraints analyzed in the detailed report include:
- Multi-Vendor, Multi-Domain Network Complexity
- Enterprise SLA Evidence for Private Networks and Edge Services
- High Integration and Migration Costs
For complete list of drivers and restraints, kindly check the Table Of Contents.
Segment Analysis
Software held 33.42% of the telecom network experience intelligence for investors market share in 2025, showing that operators still use licensed platforms to build internal assurance capabilities. Services are expected to expand at a CAGR of 10.44% from 2026 to 2031. Operators increasingly need specialist support to configure AI-driven assurance systems at scale. RADCOM reported that a significant share of network leaders cited a shortage of AIOps talent as a challenge. The skills gap converts a need for operational continuity into demand for managed assurance services.
Amdocs, Accenture, and IBM offer managed assurance arrangements that extend beyond basic monitoring. These arrangements increasingly focus on service-level results rather than access to a software platform. This can increase revenue per customer when suppliers can demonstrate measured business outcomes. It also reduces reliance on contract lock-in because vendors must show continuing value. The telecom network experience intelligence for investors industry is therefore seeing services demand tied to the shortage of operational skills rather than to a simple replacement of software.
Cloud-based deployment held 23.76% in 2025 and is expected to expand at a CAGR of 10.68% from 2026 to 2031. This combination of current leadership and fastest expansion makes cloud-native assurance the preferred architecture for new deployments. Nokia introduced Autonomous Network Fabric in June 2025 using Vertex AI and BigQuery for AI-supported operations. The design also retained selected on-premises processing for jurisdictions with data residency limits.
On-premises systems remain important where national security or data localization rules require local processing. Hybrid configurations offer a practical option for operators that need cloud capabilities while retaining sensitive data controls. RADCOM ACE is available as a cloud-native function for public and private cloud settings, including 5G core environments. This broadens the potential use of cloud architecture among enterprise and government private-network operators. In the telecom network experience intelligence for investors market, fully on-premises deployment is likely to remain concentrated among operators subject to explicit local processing requirements.
Network experience benchmarking held 22.27% in 2025 because it supports regulatory reporting, competitive marketing, and capital expenditure planning. Customer experience and churn analytics is projected to expand at a CAGR of 10.59% from 2026 to 2031. Operators are linking real-time signal quality with subscriber behavior models. Opensignal's Network Experience Suite connects network performance with local subscriber switching behavior in near real time. This allows operators to respond to early churn signals before they are visible in periodic reports.
Service and quality-of-experience assurance, together with performance, fault, and event analytics, remains the operating base for more advanced analytics. Operators generally need these functions before they can add customer retention models. This sequence creates an upgrade path within existing customer accounts. An ITU workshop in May 2026 highlighted the movement toward new measurement methods for quality-of-service and quality-of-experience benchmarking. Continued standards change creates replacement demand and raises entry requirements for suppliers in the telecom network experience intelligence for investors market.
Complete Report Scope:
- By Component
- Software
- Services
- By Deployment Mode
- Cloud-Based
- On-Premises
- Hybrid
- By Solution Function
- Network Experience Benchmarking
- Service and QoE Assurance
- Performance, Fault, and Event Analytics
- Customer Experience and Churn Analytics
- Other Solution Functions
- By Network Domain
- Radio Access Network
- Core Network
- Transport Network
- Fixed Access and Broadband Network
- Other Network Domains
- By Connectivity Technology
- 2G, 3G, 4G, and 5G
- 5G Standalone and Network Slicing
- Other Connectivity Technologies
- By End User
- Mobile Network Operators
- Fixed-Line Operators and Internet Service Providers
- MVNOs and MVNEs
- Managed Service Providers and Neutral Hosts
- Private Network Operators and Enterprises
- Telecom Regulators and Public Authorities
- Infrastructure Investors, Lenders, and Equity Analysts
- By Organization Size
- Large Enterprises and Tier-1 Operators
- Small and Medium-Sized Operators and Enterprises
- By Geography
- North America
- United States
- Canada
- Mexico
- South America
- Brazil
- Argentina
- Rest of South America
- Europe
- Germany
- United Kingdom
- France
- Italy
- Spain
- Russia
- Rest of Europe
- Asia-Pacific
- China
- Japan
- India
- South Korea
- Australia
- Rest of Asia-Pacific
- Middle East
- Saudi Arabia
- United Arab Emirates
- Turkey
- Rest of Middle East
- Africa
- South Africa
- Egypt
- Rest of Africa
- North America
Geography Analysis
North America held 31.77% in 2025, supported by advanced 5G commercialization and a strong institutional investor base. U.S. operators use independent quality benchmarks in due diligence and infrastructure review processes. Competition among AT&T, T-Mobile, and Verizon encourages investment in systems that generate defensible quality evidence. Opensignal reported on these operators in its July 2026 U.S. mobile network experience study. Canada has demand for managed assurance services, while Mexico is moving from reactive monitoring toward predictive intelligence.
Europe is the second-largest cluster, with Germany, the United Kingdom, France, and the Nordic countries supporting mature benchmarking and quality-reporting demand. EXFO Context at Vodafone Germany supports zero-touch automation across mobile and fixed operations. Asia-Pacific has the highest operator count and acts as a testing ground for new autonomous-network capabilities. Nokia conducted autonomous-network trials with NTT DOCOMO at DTW26 in 2026. India's proposed 5G slicing quality framework points to compliance-led demand for performance evidence before wider commercial service launches.
The Middle East is expected to expand at a CAGR of 10.56% from 2026 to 2031, making it the fastest-growing geographic area in the telecom network experience intelligence for investors market. Gulf Cooperation Council operators are advancing 5G standalone programs, while sovereign wealth investors need verified evidence for telecommunications infrastructure reviews. Ooredoo signed a February 2026 framework agreement with Polystar for mobile and fixed broadband analytics across networks with 5G standalone investment. South America and Africa remain smaller markets, although Brazil's quality framework and deployment activity in South Africa and Egypt support demand. High integration costs and limited AIOps skills continue to limit wider adoption across Africa and South America.
- Cisco Systems, Inc.
- Telefonaktiebolaget LM Ericsson
- Nokia Corporation
- Huawei Technologies Co., Ltd.
- Infovista SAS
- Opensignal, Inc.
- Ookla LLC
- Accenture plc
- RADCOM Ltd.
- VIAVI Solutions Inc.
- NETSCOUT SYSTEMS, INC.
- Amdocs Limited
- International Business Machines Corporation
- Oracle Corporation
- Juniper Networks, Inc.
- Ciena Corporation
- Spirent Communications plc
- EXFO Inc.
- Mycom OSI Limited
Additional Benefits:
- The market estimate (ME) sheet in Excel format
- 3 months of analyst support
TABLE OF CONTENTS
1 INTRODUCTION
- 1.1 Study Assumptions and Market Definition
- 1.2 Scope of the Study
2 RESEARCH METHODOLOGY
3 EXECUTIVE SUMMARY
4 MARKET LANDSCAPE
- 4.1 Market Overview
- 4.2 Market Drivers
- 4.2.1 5G Standalone and Network Slicing Assurance Demand
- 4.2.2 AI-Driven Predictive Assurance and Closed-Loop Automation
- 4.2.3 Multi-Vendor, Multi-Domain Network Complexity
- 4.2.4 Enterprise SLA Evidence for Private Networks and Edge Services
- 4.2.5 Rising Value of Crowdsourced and Real-World Experience Data
- 4.2.6 Experience-Led Network Investment and Churn Reduction
- 4.3 Market Restraints
- 4.3.1 Legacy OSS Data Silos and Inconsistent KPI Semantics
- 4.3.2 High Integration and Migration Costs
- 4.3.3 Scarcity of Telecom-AIOps and Network-Data Engineering Skills
- 4.3.4 Data Sovereignty, Privacy, and Cybersecurity Constraints
- 4.4 Impact of Macroeconomic Factors on the Market
- 4.5 Industry Value Chain Analysis
- 4.6 Regulatory Landscape
- 4.7 Technological Outlook
- 4.8 Porter's Five Forces Analysis
- 4.8.1 Threat of New Entrants
- 4.8.2 Bargaining Power of Suppliers
- 4.8.3 Bargaining Power of Buyers
- 4.8.4 Threat of Substitutes
- 4.8.5 Competitive Rivalry
5 MARKET SIZE AND GROWTH FORECASTS (VALUE)
- 5.1 By Component
- 5.1.1 Software
- 5.1.2 Services
- 5.2 By Deployment Mode
- 5.2.1 Cloud-Based
- 5.2.2 On-Premises
- 5.2.3 Hybrid
- 5.3 By Solution Function
- 5.3.1 Network Experience Benchmarking
- 5.3.2 Service and QoE Assurance
- 5.3.3 Performance, Fault, and Event Analytics
- 5.3.4 Customer Experience and Churn Analytics
- 5.3.5 Other Solution Functions
- 5.4 By Network Domain
- 5.4.1 Radio Access Network
- 5.4.2 Core Network
- 5.4.3 Transport Network
- 5.4.4 Fixed Access and Broadband Network
- 5.4.5 Other Network Domains
- 5.5 By Connectivity Technology
- 5.5.1 2G, 3G, 4G, and 5G
- 5.5.2 5G Standalone and Network Slicing
- 5.5.3 Other Connectivity Technologies
- 5.6 By End User
- 5.6.1 Mobile Network Operators
- 5.6.2 Fixed-Line Operators and Internet Service Providers
- 5.6.3 MVNOs and MVNEs
- 5.6.4 Managed Service Providers and Neutral Hosts
- 5.6.5 Private Network Operators and Enterprises
- 5.6.6 Telecom Regulators and Public Authorities
- 5.6.7 Infrastructure Investors, Lenders, and Equity Analysts
- 5.7 By Organization Size
- 5.7.1 Large Enterprises and Tier-1 Operators
- 5.7.2 Small and Medium-Sized Operators and Enterprises
- 5.8 By Geography
- 5.8.1 North America
- 5.8.1.1 United States
- 5.8.1.2 Canada
- 5.8.1.3 Mexico
- 5.8.2 South America
- 5.8.2.1 Brazil
- 5.8.2.2 Argentina
- 5.8.2.3 Rest of South America
- 5.8.3 Europe
- 5.8.3.1 Germany
- 5.8.3.2 United Kingdom
- 5.8.3.3 France
- 5.8.3.4 Italy
- 5.8.3.5 Spain
- 5.8.3.6 Russia
- 5.8.3.7 Rest of Europe
- 5.8.4 Asia-Pacific
- 5.8.4.1 China
- 5.8.4.2 Japan
- 5.8.4.3 India
- 5.8.4.4 South Korea
- 5.8.4.5 Australia
- 5.8.4.6 Rest of Asia-Pacific
- 5.8.5 Middle East
- 5.8.5.1 Saudi Arabia
- 5.8.5.2 United Arab Emirates
- 5.8.5.3 Turkey
- 5.8.5.4 Rest of Middle East
- 5.8.6 Africa
- 5.8.6.1 South Africa
- 5.8.6.2 Egypt
- 5.8.6.3 Rest of Africa
- 5.8.1 North America
6 COMPETITIVE LANDSCAPE
- 6.1 Market Concentration
- 6.2 Strategic Moves
- 6.3 Market Share Analysis
- 6.4 Company Profiles (includes Global Level Overview, Market Level Overview, Core Segments, Financials as available, Strategic Information, Market Rank/Share, Products and Services, Recent Developments)
- 6.4.1 Cisco Systems, Inc.
- 6.4.2 Telefonaktiebolaget LM Ericsson
- 6.4.3 Nokia Corporation
- 6.4.4 Huawei Technologies Co., Ltd.
- 6.4.5 Infovista SAS
- 6.4.6 Opensignal, Inc.
- 6.4.7 Ookla LLC
- 6.4.8 Accenture plc
- 6.4.9 RADCOM Ltd.
- 6.4.10 VIAVI Solutions Inc.
- 6.4.11 NETSCOUT SYSTEMS, INC.
- 6.4.12 Amdocs Limited
- 6.4.13 International Business Machines Corporation
- 6.4.14 Oracle Corporation
- 6.4.15 Juniper Networks, Inc.
- 6.4.16 Ciena Corporation
- 6.4.17 Spirent Communications plc
- 6.4.18 EXFO Inc.
- 6.4.19 Mycom OSI Limited
7 MARKET OPPORTUNITIES AND FUTURE OUTLOOK
- 7.1 White-Space and Unmet-Need Assessment


