
|
시장보고서
상품코드
1619729
웹스케일 네트워크 사업자 시장 리뷰(2024년 3분기) : 설비투자 전년 대비 58% 급증, 12개월 누계 2,500억 달러 돌파 - 전망은 긍정적이지만, 생성형 AI에 대한 현실 점검 필요Webscale Network Operators - 3Q24 Market Review: Capex Jumps 58% YoY in 3Q24, Pushing 12 mo. Total Over $250 Billion, Outlook Remains Strong, but Reality Check is Needed for GenAI |
||||||
2024년 3분기 설비투자액은 전년 동기 대비 58% 증가, 12개월 누계로 2,500억 달러 이상
웹스케일 네트워크 운영자(WNO) 21개사를 대상으로 조사한 결과 최근 12개월간(2023년 4분기-2024년 3분기)에서 웹스케일 사업자의 수익은 2조 5,300억 달러(전년 동기 대비 9.1% 증가), 연구개발비는 3,070억 달러(동 6.5% 증가), 설비투자액은 2,540억 달러(동 32.5% 증가)였습니다. 2024년 9월 시점의 장부상의 현금 및 단기투자는 6,310억 달러(전년 대비 11.3% 감소), 부채총액은 5,380억 달러(전년 대비 4.1% 감소)였습니다. 또한, 2024년 9월 시점의 웹스케일러의 순PP&E의 장부가액은 8,540억 달러로, 전년 동월 대비 25.9% 증가했습니다. 웹스케일러의 제3분기말 종업원 수는 약 422만 6,000명으로, 2023년 9월 현재 413만명에서 2.3% 증가했습니다.
이 보고서는 2011년 이후 WNO(웹 스케일 네트워크 사업자) 시장의 성장과 발전을 검토합니다.
비주얼
보고서 하이라이트:
- 수익 : 2024년3 분기의 단기 수익은 6,386억 달러로 전년 동기 대비 10.6% 증가했습니다. Alphabet, Amazon, Meta(FB), Microsoft의 빅 4가 견인하고 있습니다. 이들 기업은 5분기 연속으로 2자리수의 수익 성장을 기록해, 타사를 크게 이끌고 있습니다. 급성장한 것은 Meta로, 2022 4분기와 2023년 3분기 대비 23.1% 증가한 다음 Microsoft(16.4% 증가), Alphabet(14.4% 증가), Amazon(11.9% 증가) Amazon은 2024년 3분기 성장에 가장 큰 영향을 미쳤으며, 2023년 3분기부터 158억 달러 증가했으며, 202 4년 3분기는 전년 동기 대비 11.0% 증가한 1,589억 달러가 되고 있습니다.(7.8%) 감소의 58억 달러가 되고 있습니다.
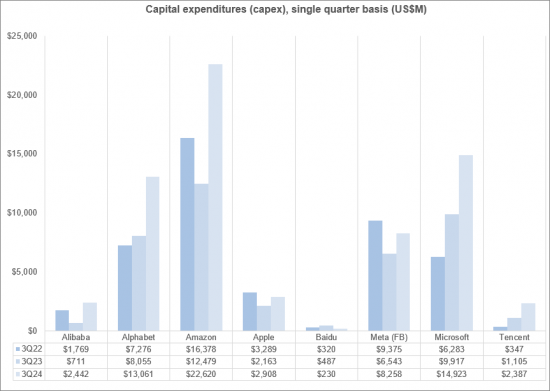
- 설비 투자: 2023년에 5% 감소한 웹스케일 설비투자는 2024년에는 놀라울 정도로 빠르게 지속되고 어려운 페이스로 증가하고 있습니다. 2012년 34분기의 설비투자액은 756억 달러로, 연환산 총액은 동기 대비 32.5% 증가한 2,539억 달러에 이르렀고, 과거 최고를 갱신했습니다. 생성 AI에 대한 투자자의 관심은 급속히 확산되고 있으며 데이터 센터에서 GPU 투자를 견인하고 있습니다.
- 수익성 : 웹 스케일 프리 현금 흐름 마진은 2024년 3분기 연평균 17.6%로 전년 동기(17.9%) 보다 약간 낮지만 2022년 3분기의 14.1%보다 높은 값이 되었습니다. 2023년 4분기부터 2024년 3분기의 평균 순이익률은 18.9%로 2023년 3분기의 16.9%를 약간 웃돌고 있습니다. 두 수익성 지표는 전년도 COVID와 거의 동일합니다.
- 직원 수: 웹 스케일 시장의 직원 수는 2024년 9월에는 423만명이 되었으며, 2023년 9월의 413만명에서 약간 증가했습니다. 이 차이는 일부 웹 스케일러의 규모와 특히 전자 상거래 전문가의 직원수 변화의 속도를 생각하면, 매우 미미합니다.
- 지역 동향 : 아시아태평양은 몇 분기에 걸쳐 시장의 발목을 잡고 있으며, 3 분기도 그 경향이 계속되었습니다. 아메리카, 유럽, 중동 및 아프리카의 웹 스케일 수익은 근 몇 4분기동안 2자리대 전반의 성장을 계속하고 있지만, 아시아태평양은 저조하고, 2024년 3분기 매출 성장률은 전년 동기 대비 5% 증가로, 지난 몇 분기의 1자리대 전반의 성장률과 같은 수준이었습니다.
조사 대상
WNO 톱 8사
|
|
기타 WNO
|
|
목차
- 1. 보고서 하이라이트
- 2. 전망
- 3. 분석
- 4. 주요 통계
- 5. 기업 상세
- 6. WNO 톱 8사
- 7. 기업 벤치마킹
- 8. 지역별 분석
- 9. 원시 데이터
- 10. 환율
- 11. 본서에 대해
Capex jumps 58% YoY in 3Q24, pushing 12 mo. total over $250 billion; outlook remains strong, but reality check is needed for GenAI
This report reviews the growth and development of the webscale network operator (WNO, or webscale) market since 2011. It covers 21 companies. In the most recent 12 months (4Q23-3Q24), webscalers represented $2.53 trillion (T) in revenues (+9.1% YoY), $307 billion (B) in R&D spending (+6.5% YoY), and $254B in capex (+32.5% YoY). They had $631B of cash and short-term investments (-11.3% YoY) on the books as of September 2024, and $538B in total debt (-4.1% YoY). The value of webscalers' net plant, property & equipment (net PP&E) on the books as of September 2024 was $854B, up 25.9% YoY. Webscalers employed approximately 4.226 million (M) people at the end of 3Q24, up 2.3% from the Sept. 2023 total of 4.130M.
VISUALS
Below are highlights from the report:
- Revenues: Single quarter revenues in 3Q24 were $638.6 billion (B), up 10.6% YoY. That pushed annualized revenues to $2.527 trillion. Topline growth has been driven by the big 4: Alphabet, Amazon, Meta (FB) and Microsoft. For five straight quarters, all of these companies have recorded double digit revenue growth, well above the rest of the pack. For the 3Q24 annualized period, the fastest growth came from Meta, up 23.1% versus 4Q22-3Q23, followed by Microsoft (+16.4%), Alphabet (14.4%), and Amazon (11.9%). The biggest dollar impact on growth in 3Q24 came from Amazon, as its single quarter revenues grew $15.8 billion from 3Q23 to end 3Q24 at $158.9B, up 11.0% YoY. The only curb on growth in 3Q24 was Japanese IT services & cloud vendor Fujitsu, which recorded 3Q24 revenues of $5.8B, down $492 million (M) YoY (-7.8%).
- Capex: After declining 5% in 2023, webscale capex has grown at incredibly fast, unsustainable rates in 2024: up by 25%, 51%, and 58% YoY in the first three quarters of the year. 3Q24 capex of $75.6B pushed the annualized total to $253.9B, up 32.5% YoY, and another all-time high. Investor interest in generative AI has spread rapidly, driving GPU spend in the data center. The current investment spike would seem to be inspired by a mix of hype and fear of missing out, as GenAI brings with it a plethora of legal & regulatory risks and relative lack of proven business models. Most recent webscale capex is focused on outfitting existing data centers: from 46% of annualized capex in 3Q22, Network/IT and software capex was 53% of total capex for the latest annualized period. The biggest capex outlays in 3Q24 came from Amazon ($22.6B), Microsoft ($14.9B), Alphabet ($13.1B), and Meta (FB) ($8.3B). These four account for about 80% of single quarter spending. They are the reason behind the unsustainable surge in the price of NVIDIA stock.
- Profitability: Webscale free cash flow margins averaged out to 17.6% for the 3Q24 annualized period, a bit lower than a year prior (17.9%) but higher than the 14.1% booked in 3Q22. Average net profit margin for 4Q23-3Q24 was 18.9%, a bit higher than 16.9% in 3Q23. Both profitability metrics are around the same level as in the year before COVID. Meta, Tencent and Microsoft are regularly near or at the top of the heap on both metrics, and this was again the case in 3Q24. The ecommerce specialists Amazon and Alibaba are the laggards, as usual. The biggest drops in free cash flow margins came at the companies with surging capex: Alphabet and Amazon. The biggest decline in net profitability was Apple, which was fined 13 billion Euros in September 2024 for taking illegal profits from a tax scheme in Ireland over two decades. This tax scheme has been widely known about and criticized for many years. While 13 billion sounds like a lot, it hardly impacted Apple's market trajectory at all. Apple's stock price is around 14% higher now than on 1 July 2024. Consumers and taxpayers are losing out, while big tech uses political friends to secure victories. This will get worse with new political leadership in the US.
- Employees: Headcount in the webscale market totaled to 4.23 million in September 2024, slightly up from 4.13 million in September 2023. This difference is negligible, considering the size of some of the webscalers and how quickly the ecommerce specialists in particular can change workforce levels. Amazon's workforce grew by 51,000 between September 2023 and 2024, for instance. Total webscale headcount has been approximately 4.1 to 4.2 million or so steadily since late 2021. Some of the biggest webscalers are investing heavily in AI and GenAI, with one clear goal being to improve their internal cost efficiencies. This inevitably will mean fewer employees. Even within the ecommerce space, there is a rising use of robots and autonomous vehicles in the logistics chain. Per our latest forecast, we expect webscale employment to rise slightly in 2025 but decline thereafter due to greater use of robotics, automation and AI.
- Regional trends: The Asia-Pacific region has been a drag on the market for several quarters, and that continued in 3Q24. Webscale revenues in the Americas, Europe, and MEA have been growing in the low double digit range for a few quarters, but AP has been weak: 3Q24 revenue growth was 5% YoY, in line with the last few quarters of low single digit percentage growth. Weak Asian currencies and a very competitive 'big tech' market in China account for the gap. Another factor is TikTok. This company, owned by ByteDance, has grown at explosive rates for the last few years, but remains private. We have no reasonable way to include TikTok figures in our database. The ByteDance surge also ate into the 2022-23 growth of some western webscalers, notably Meta (FB), but that effect has ebbed.
Coverage
Top 8 WNOs
|
|
Other WNOs
|
|
Table of Contents
- 1. Report highlights
- 2. Outlook
- 3. Analysis
- 4. Key Stats
- 5. Company Drilldown
- 6. Top 8 WNOs
- 7. Company Benchmarking
- 8. Regional Breakouts
- 9. Raw Data
- 10. Exchange Rates
- 11. About
(주말 및 공휴일 제외)
