|
시장보고서
상품코드
1892854
왕복동 발전 엔진 시장 기회, 성장요인, 업계 동향 분석 및 예측(2026-2035년)Reciprocating Power Generating Engine Market Opportunity, Growth Drivers, Industry Trend Analysis, and Forecast 2026 - 2035 |
||||||
세계의 왕복동 발전 엔진 시장은 2025년에 488억 달러로 평가되었고, 2035년까지 연평균 복합 성장률(CAGR) 4%로 성장하여 731억 달러에 이를 것으로 예측됩니다.
시장 성장은 확장되는 마이크로그리드 개념과 지역 산업 전기화 프로그램에 의해 촉진되고 있으며, 이는 확장성과 신뢰성을 겸비한 전력 솔루션에 대한 수요를 주도하고 있습니다. 왕복동 엔진은 빠른 시동, 효율성, 적응성이 높은 평가를 받고 있으며, 도시와 외딴 지역 모두에서 신뢰할 수 있는 전력 공급에 적합합니다. 이 엔진은 피스톤의 직선 운동을 회전 기계 에너지로 변환하고, 실린더 내에서 제어된 연료 연소를 통해 전력을 생산합니다. 데이터센터, 광업, 석유 및 가스 사업에 대한 투자 확대와 더불어 신흥 경제국의 에너지 내성 요구사항이 증가하면서 수요가 증가하고 있습니다. 다양한 연료로 가동, 변동 부하 관리, 예비 전력 및 피크 전력 공급이 가능한 특성으로 시장에서의 입지를 더욱 강화하고 있습니다. 기술 발전과 재생에너지원의 통합으로 간헐적 발전을 유연하게 보완하는 역할이 확대되고 있습니다.
| 시장 범위 | |
|---|---|
| 개시 연도 | 2025년 |
| 예측 연도 | 2026-2035년 |
| 개시 연도 시장 규모 | 488억 달러 |
| 예측 금액 | 731억 달러 |
| CAGR | 4% |
0.5MW-1MW 엔진 부문은 2025년 25%의 점유율을 차지하며 2035년까지 연평균 복합 성장률(CAGR) 3.5%를 보일 것으로 예측됩니다. 다양한 분야에서 신뢰할 수 있는 백업 솔루션에 대한 수요가 증가함에 따라, 컴팩트하고 비용 효율적이며 다재다능한 산업용 전원장치에 대한 수요가 증가하고 있습니다.
가스 연소 왕복동 엔진 부문은 2025년 112억 달러에 달할 것으로 예상되며, 이는 운영 효율성 향상, 환경 규제 준수, 재생 에너지 통합으로 인한 수요 증가를 반영하고 있습니다. 이러한 엔진은 변동성 및 분산형 재생에너지 발전을 지원하는 신뢰할 수 있는 솔루션으로 작용합니다.
미국 왕복동 발전 엔진 시장은 2025년 70%의 점유율을 차지하며 67억 달러 규모에 달할 것으로 예측됩니다. 백업 전원에 대한 수요 증가, 노후화된 전력망 인프라, 분산형 에너지 솔루션 도입, 청정 연료에 대한 규제 지원, 산업 활동 및 데이터센터의 확대로 인해 시장 성장이 뒷받침되고 있습니다.
자주 묻는 질문
목차
제1장 조사 방법과 범위
제2장 주요 요약
제3장 업계 인사이트
- 생태계 분석
- 원재료 가용성과 조달 분석
- 제조능력 평가
- 공급망 회복탄력성와 리스크 요인
- 유통 네트워크 분석
- 규제 상황
- 업계에 대한 영향요인
- 성장 촉진요인
- 업계의 잠재적 리스크&과제
- 성장 가능성 분석
- Porter's Five Forces 분석
- PESTEL 분석
- 왕복동 발전 엔진 비용 구조 분석
- 가격 동향 분석(달러/MW)
- 지역별
- 정격 출력별
- 신흥 기회와 동향
- 디지털화와 IoT 통합
- 신흥 시장 진출
- 파괴적 동향과 전망
- 시장 발전과 역사적 배경
- 기술적 기초와 성능 특성
- 엔진 회전수 유형과 구성
- 효율 곡선과 운전 파라미터
제4장 경쟁 구도
- 서론
- 기업의 시장 점유율 분석 : 지역별
- 북미
- 유럽
- 아시아태평양
- 중동 및 아프리카
- 라틴아메리카
- 전략적 대시보드
- 전략적 이니셔티브
- 주요 제휴 및 협력 관계
- 주요 M&A 활동
- 제품 혁신과 신제품 발매
- 시장 확대 전략
- 경쟁 벤치마킹
- 혁신과 지속가능성 상황
제5장 시장 규모와 예측 : 연료 유형별, 2022-2035
- 주요 동향
- 가스 피워
- 0.5MW-1MW
- >1MW-2MW
- >2MW-3.5MW
- >3.5MW-5MW
- 5MW 이상-7.5MW
- 7.5MW 이상
- 디젤 연료식
- 0.5MW-1MW
- >1MW-2MW
- >2MW-3.5MW
- >3.5MW-5MW
- 5MW 이상-7.5MW
- 7.5MW 이상
- 듀얼 연료
- 0.5MW-1MW
- >1MW-2MW
- >2MW-3.5MW
- >3.5MW-5MW
- 5MW 이상-7.5MW
- 7.5MW 이상
- 기타
- 0.5MW-1MW
- >1MW-2MW
- >2MW-3.5MW
- >3.5MW-5MW
- 5MW 이상-7.5MW
- 7.5MW 이상
제6장 시장 규모와 예측 : 정격 출력별, 2022-2035
- 주요 동향
- 0.5MW-1MW
- 1MW 이상-2MW
- 2MW 이상-3.5MW
- >3.5MW-5MW
- 5MW 이상-7.5MW
- 7.5MW 이상
제7장 시장 규모와 예측 : 용도별, 2022-2035
- 주요 동향
- 산업용
- CHP
- 에너지 및 유틸리티
- 매립지 및 바이오가스
- 석유 및 가스
- 기타
제8장 시장 규모와 예측 : 최종 용도별, 2022-2035
- 주요 동향
- 예비 전력
- 0.5MW-1MW
- >1MW-2MW
- >2MW-3.5MW
- >3.5MW-5MW
- 5MW 이상-7.5MW
- 7.5MW 이상
- 주출력
- 0.5MW-1MW
- >1MW-2MW
- >2MW-3.5MW
- >3.5MW-5MW
- 5MW 이상-7.5MW
- 7.5MW 이상
제9장 시장 규모와 예측 : 지역별, 2022-2035
- 주요 동향
- 북미
- 미국
- 캐나다
- 멕시코
- 유럽
- 영국
- 프랑스
- 독일
- 러시아
- 이탈리아
- 스페인
- 네덜란드
- 덴마크
- 노르웨이
- 아시아태평양
- 중국
- 인도
- 일본
- 한국
- 호주
- 태국
- 싱가포르
- 인도네시아
- 말레이시아
- 필리핀
- 중동 및 아프리카
- 아랍에미리트(UAE)
- 사우디아라비아
- 카타르
- 오만
- 쿠웨이트
- 이란
- 이집트
- 튀르키예
- 요르단
- 남아프리카공화국
- 라틴아메리카
- 브라질
- 아르헨티나
- 칠레
- 페루
제10장 기업 개요
- Ashok Leyland
- Briggs &Stratton
- Caterpillar
- Cummins
- Deere &Company
- Deutz AG
- Enerflex
- Escorts Kubota Limited
- GE Vernova
- Guascor Energy
- Kawasaki Heavy Industries
- Kirloskar
- MAN Energy Solutions
- Mitsubishi Heavy Industries
- Rehlko
- Rolls-Royce
- Scania
- TRITON DURO
- Wartsila
- Yanmar Holdings
- Honda Motor
- IHI Corporation
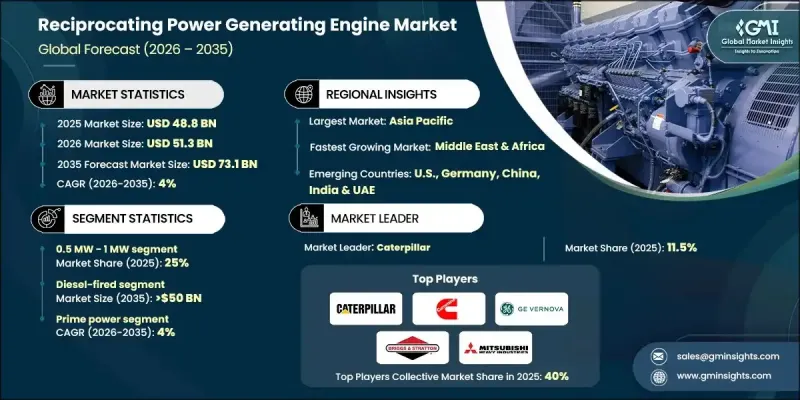
The Global Reciprocating Power Generating Engine Market was valued at USD 48.8 billion in 2025 and is estimated to grow at a CAGR of 4% to reach USD 73.1 billion by 2035.

The market growth is propelled by expanding microgrid initiatives and rural industrial electrification programs, which drive the need for scalable and reliable power solutions. Reciprocating engines are highly valued for their fast start-up, efficiency, and adaptability, making them suitable for delivering dependable electricity in both urban centers and remote locations. These engines convert the linear motion of pistons into rotational mechanical energy, producing electricity through controlled fuel combustion in cylinders. Growing investments in data centers, mining, and oil & gas operations, along with rising energy resilience requirements in emerging economies, are fueling demand. The ability of these engines to operate on diverse fuels, manage variable loads, and provide standby or peaking power further strengthens their market relevance. Technological advancements and the integration of renewable energy sources are expanding their role as flexible complements to intermittent power generation.
| Market Scope | |
|---|---|
| Start Year | 2025 |
| Forecast Year | 2026-2035 |
| Start Value | $48.8 Billion |
| Forecast Value | $73.1 Billion |
| CAGR | 4% |
The 0.5 MW - 1 MW engine segment accounted for a 25% share in 2025 and is expected to grow at a 3.5% CAGR through 2035. Demand for compact, cost-efficient, and versatile industrial power units is rising, driven by the growing need for reliable backup solutions across multiple sectors.
The gas-fired reciprocating engines segment reached USD 11.2 billion in 2025, reflecting a surge in demand due to improved operational efficiency, environmental compliance, and renewable energy integration. These engines serve as dependable solutions to support variable and distributed energy generation.
U.S. Reciprocating Power Generating Engine Market held a 70% share in 2025, generating USD 6.7 billion. Market growth is supported by the rising requirement for backup power, aging grid infrastructure, adoption of distributed energy solutions, regulatory support for cleaner fuels, and increasing industrial and data center activity.
Key companies operating in the Global Reciprocating Power Generating Engine Market include Wartsila, Mitsubishi Heavy Industries, IHI Corporation, Honda Motor, Cummins, Scania, Rolls-Royce, Caterpillar, Deutz AG, Kawasaki Heavy Industries, Deere & Company, Kirloskar, TRITON DURO, Ashok Leyland, Briggs & Stratton, Enerflex, GE Vernova, Escorts Kubota Limited, and Guascor Energy. Companies in the Reciprocating Power Generating Engine Market are strengthening their position by investing in R&D to enhance fuel efficiency, emissions compliance, and operational flexibility. Strategic partnerships with utilities, industrial firms, and microgrid operators enable wider adoption and service integration. Manufacturers are expanding global service networks and offering customized solutions to meet regional energy needs. Technological innovation, such as hybrid and gas-capable engines, supports compliance with environmental regulations and renewable integration.
Table of Contents
Chapter 1 Methodology & Scope
- 1.1 Research design
- 1.1.1 Research approach
- 1.1.2 Data collection methods
- 1.2 Base estimates and calculations
- 1.2.1 Base year calculation
- 1.2.2 Market estimates & forecast parameters
- 1.3 Forecast
- 1.3.1 Key trends for market estimates
- 1.3.2 Quantified market impact analysis
- 1.3.2.1 Mathematical impact of growth parameters on forecast
- 1.3.3 Scenario analysis framework
- 1.4 Primary research and validation
- 1.4.1 Some of the primary sources (but not limited to)
- 1.5 Data mining sources
- 1.5.1 Paid Sources
- 1.5.2 Sources, by region
- 1.6 Research trail & scoring components
- 1.6.1 Research trail components
- 1.6.2 Scoring components
- 1.7 Research transparency addendum
- 1.7.1 Source attribution framework
- 1.7.2 Quality assurance metrics
- 1.7.3 Our commitment to trust
- 1.8 Market definitions
Chapter 2 Executive Summary
- 2.1 Industry synopsis, 2022 - 2035
- 2.1.1 Business trends
- 2.1.2 Fuel type trends
- 2.1.3 Rated power trends
- 2.1.4 Application trends
- 2.1.5 End use trends
- 2.1.6 Regional trends
Chapter 3 Industry Insights
- 3.1 Industry ecosystem analysis
- 3.1.1 Raw material availability & sourcing analysis
- 3.1.2 Manufacturing capacity assessment
- 3.1.3 Supply chain resilience & risk factors
- 3.1.4 Distribution network analysis
- 3.2 Regulatory landscape
- 3.3 Industry impact forces
- 3.3.1 Growth drivers
- 3.3.2 Industry pitfalls & challenges
- 3.4 Growth potential analysis
- 3.5 Porter's analysis
- 3.5.1 Bargaining power of suppliers
- 3.5.2 Bargaining power of buyers
- 3.5.3 Threat of new entrants
- 3.5.4 Threat of substitutes
- 3.6 PESTEL analysis
- 3.6.1 Political factors
- 3.6.2 Economic factors
- 3.6.3 Social factors
- 3.6.4 Technological factors
- 3.6.5 Legal factors
- 3.6.6 Environmental factors
- 3.7 Cost structure analysis of reciprocating power generating engines
- 3.8 Price trend analysis (USD/MW)
- 3.8.1 By region
- 3.8.2 By rated power
- 3.9 Emerging opportunities & trends
- 3.9.1 Digitalization and IoT integration
- 3.9.2 Emerging market penetration
- 3.10 Disruptive trends & future outlook
- 3.11 Market evolution & historical context
- 3.12 Technology fundamentals & performance characteristics
- 3.12.1 Engine speed types & configurations
- 3.12.2 Efficiency curves & operational parameters
Chapter 4 Competitive Landscape, 2025
- 4.1 Introduction
- 4.2 Company market share analysis, by region, 2025
- 4.2.1 North America
- 4.2.2 Europe
- 4.2.3 Asia Pacific
- 4.2.4 Middle East & Africa
- 4.2.5 Latin America
- 4.3 Strategic dashboard
- 4.4 Strategic initiatives
- 4.4.1 Key partnerships & collaborations
- 4.4.2 Major M&A activities
- 4.4.3 Product innovations & launches
- 4.4.4 Market expansion strategies
- 4.5 Competitive benchmarking
- 4.6 Innovation & sustainability landscape
Chapter 5 Market Size and Forecast, By Fuel Type, 2022 - 2035 (USD Million, MW & Units)
- 5.1 Key trends
- 5.2 Gas-fired
- 5.2.1 0.5 MW - 1 MW
- 5.2.2 > 1 MW - 2 MW
- 5.2.3 > 2 MW - 3.5 MW
- 5.2.4 > 3.5 MW - 5 MW
- 5.2.5 > 5 MW - 7.5 MW
- 5.2.6 > 7.5 MW
- 5.3 Diesel-fired
- 5.3.1 0.5 MW - 1 MW
- 5.3.2 > 1 MW - 2 MW
- 5.3.3 > 2 MW - 3.5 MW
- 5.3.4 > 3.5 MW - 5 MW
- 5.3.5 > 5 MW - 7.5 MW
- 5.3.6 > 7.5 MW
- 5.4 Dual fuel
- 5.4.1 0.5 MW - 1 MW
- 5.4.2 > 1 MW - 2 MW
- 5.4.3 > 2 MW - 3.5 MW
- 5.4.4 > 3.5 MW - 5 MW
- 5.4.5 > 5 MW - 7.5 MW
- 5.4.6 > 7.5 MW
- 5.5 Others
- 5.5.1 0.5 MW - 1 MW
- 5.5.2 > 1 MW - 2 MW
- 5.5.3 > 2 MW - 3.5 MW
- 5.5.4 > 3.5 MW - 5 MW
- 5.5.5 > 5 MW - 7.5 MW
- 5.5.6 > 7.5 MW
Chapter 6 Market Size and Forecast, By Rated Power, 2022 - 2035 (USD Million, MW & Units)
- 6.1 Key trends
- 6.2 0.5 MW - 1 MW
- 6.3 > 1 MW - 2 MW
- 6.4 > 2 MW - 3.5 MW
- 6.5 > 3.5 MW - 5 MW
- 6.6 > 5 MW - 7.5 MW
- 6.7 > 7.5 MW
Chapter 7 Market Size and Forecast, By Application, 2022 - 2035 (USD Million, MW & Units)
- 7.1 Key trends
- 7.2 Industrial
- 7.3 CHP
- 7.4 Energy & utility
- 7.5 Landfill & biogas
- 7.6 Oil & gas
- 7.7 Others
Chapter 8 Market Size and Forecast, By End Use, 2022 - 2035 (USD Million, MW & Units)
- 8.1 Key trends
- 8.2 Backup
- 8.2.1 0.5 MW - 1 MW
- 8.2.2 > 1 MW - 2 MW
- 8.2.3 > 2 MW - 3.5 MW
- 8.2.4 > 3.5 MW - 5 MW
- 8.2.5 > 5 MW - 7.5 MW
- 8.2.6 > 7.5 MW
- 8.3 Prime power
- 8.3.1 0.5 MW - 1 MW
- 8.3.2 > 1 MW - 2 MW
- 8.3.3 > 2 MW - 3.5 MW
- 8.3.4 > 3.5 MW - 5 MW
- 8.3.5 > 5 MW - 7.5 MW
- 8.3.6 > 7.5 MW
Chapter 9 Market Size and Forecast, By Region, 2022 - 2035 (USD Million, MW & Units)
- 9.1 Key trends
- 9.2 North America
- 9.2.1 U.S.
- 9.2.2 Canada
- 9.2.3 Mexico
- 9.3 Europe
- 9.3.1 UK
- 9.3.2 France
- 9.3.3 Germany
- 9.3.4 Russia
- 9.3.5 Italy
- 9.3.6 Spain
- 9.3.7 Netherlands
- 9.3.8 Denmark
- 9.3.9 Norway
- 9.4 Asia Pacific
- 9.4.1 China
- 9.4.2 India
- 9.4.3 Japan
- 9.4.4 South Korea
- 9.4.5 Australia
- 9.4.6 Thailand
- 9.4.7 Singapore
- 9.4.8 Indonesia
- 9.4.9 Malaysia
- 9.4.10 Philippines
- 9.5 Middle East & Africa
- 9.5.1 UAE
- 9.5.2 Saudi Arabia
- 9.5.3 Qatar
- 9.5.4 Oman
- 9.5.5 Kuwait
- 9.5.6 Iran
- 9.5.7 Egypt
- 9.5.8 Turkey
- 9.5.9 Jordan
- 9.5.10 South Africa
- 9.6 Latin America
- 9.6.1 Brazil
- 9.6.2 Argentina
- 9.6.3 Chile
- 9.6.4 Peru
Chapter 10 Company Profiles
- 10.1 Ashok Leyland
- 10.2 Briggs & Stratton
- 10.3 Caterpillar
- 10.4 Cummins
- 10.5 Deere & Company
- 10.6 Deutz AG
- 10.7 Enerflex
- 10.8 Escorts Kubota Limited
- 10.9 GE Vernova
- 10.10 Guascor Energy
- 10.11 Kawasaki Heavy Industries
- 10.12 Kirloskar
- 10.13 MAN Energy Solutions
- 10.14 Mitsubishi Heavy Industries
- 10.15 Rehlko
- 10.16 Rolls-Royce
- 10.17 Scania
- 10.18 TRITON DURO
- 10.19 Wartsila
- 10.20 Yanmar Holdings
- 10.21 Honda Motor
- 10.22 IHI Corporation