
|
시장보고서
상품코드
2083273
기계용 진동 모니터링 시스템 시장 기회, 성장요인, 업계 동향 분석 및 예측(2026-2035년)Vibrational Monitoring System for Machinery Market Opportunity, Growth Drivers, Industry Trend Analysis, and Forecast 2026 - 2035 |
||||||

세계의 기계용 진동 모니터링 시스템 시장은 2025년에 23억 달러로 평가되었고, CAGR 7.9%로 성장하여 2035년까지 49억 달러에 달할 것으로 추정되고 있습니다.
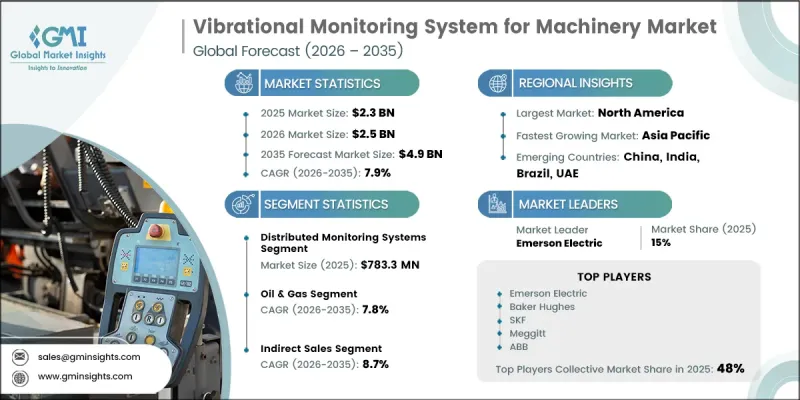
이러한 성장은 산업 환경 전반에 걸쳐 설비의 수명 연장, 자본 집약적 자산의 보호, 그리고 가동 시간 극대화에 대한 인식이 높아짐에 따라 주도되고 있습니다. 제조업체와 자산 소유주들은 상태 기반 유지보수를 핵심 운영 전략으로 우선시하고 있으며, 이로 인해 첨단 진동 모니터링 솔루션에 대한 수요가 지속적으로 증가하고 있습니다. 또한, 업계 전반에 걸쳐 기술력을 강화하고 솔루션 포트폴리오를 확대하고 있는 가운데, 제휴 및 인수를 포함한 지속적인 통합 활동 역시 시장의 성장세를 뒷받침하고 있습니다. 반면, 기존 방식의 점검 기법은 그 유효성의 한계와 확장성 부족으로 인해, 생산성이 높은 산업 환경에서 그 중요성을 점차 잃어가고 있습니다. 끊임없는 기술 발전으로 인해 진동 모니터링은 무선 센싱, 지능형 진단, 그리고 커넥티드 분석 플랫폼을 기반으로 하는 데이터 주도형 분야로 진화했습니다. 이러한 혁신을 통해 조직은 예기치 못한 가동 중단 시간을 대폭 줄이고, 에너지 효율을 높이며, 자재 손실을 최소화할 수 있게 됩니다. 산업 운영의 자동화가 진전되고 가동 시간의 중요성이 점점 더 커지는 가운데, 진동 모니터링 시스템은 전 세계의 현대적인 유지보수 체계에서 필수적인 요소로 자리 잡고 있습니다.
| 시장 범위 | |
|---|---|
| 개시 연도 | 2025년 |
| 예측 기간 | 2026-2035년 |
| 초기 시장 규모 | 23억 달러 |
| 예측액 | 49억 달러 |
| CAGR | 7.9% |
휴대용 모니터링 시스템 부문은 54.9%의 점유율을 차지했으며, 2025년에는 5억 670만 달러 시장 규모를 기록했습니다. 이 부문은 합리적인 가격, 도입의 용이성, 그리고 영구적인 설치가 경제적으로 타당하지 않은 광범위한 보조 및 비주요 기계에 대한 적용성 덕분에 계속해서 성장세를 보이고 있습니다.
하드웨어 부문은 58.5%의 점유율을 차지했으며, 2025년에는 5억 3,950만 달러에 달했습니다. 정확한 기계 상태 데이터를 확보하기 위해서는 여전히 물리적 센싱 부품이 필수적이지만, 소형화와 무선 통신 기술의 발전으로 인해 성능, 내구성 및 실시간 응답성이 향상되고 있습니다. 신뢰성이 높은 센싱 인프라에 대한 강력한 수요는 커넥티드 팩토리 및 지속적인 설비 진단으로의 광범위한 전환을 반영하고 있습니다.
2025년, 미국의 기계용 진동 모니터링 시스템 시장은 75.6%의 점유율을 차지했습니다. 이러한 선도적 지위는 디지털 제조, 예측 유지보수 프로그램, 그리고 산업 및 에너지 자산 확장에 대한 막대한 투자를 바탕으로 하고 있습니다. 전미의 기업들은 예방적 모니터링 방식을 통해 기계의 수명을 연장하고 가동 중단을 줄이는 데 점점 더 주력하고 있습니다.
자주 묻는 질문
목차
제1장 조사 방법과 범위
제2장 주요 요약
제3장 업계 인사이트
제4장 경쟁 구도
제5장 시장 추산 및 예측 : 시스템 유형별, 2022년-2035년
제6장 시장 추산 및 예측 : 모니터링 목적별, 2022년-2035년
제7장 시장 추산 및 예측 : 센서 기술별, 2022년-2035년
제8장 시장 추산 및 예측 : 도입 모드별, 2022년-2035년
제9장 시장 추산 및 예측 : 최종 사용 산업별, 2022년-2035년
제10장 시장 추산 및 예측 : 유통 채널별, 2022년-2035년
제11장 시장 추산 및 예측 : 지역별, 2022년-2035년
제12장 기업 개요
LSH 26.07.14The Global Vibrational Monitoring System for Machinery Market was valued at USD 2.3 billion in 2025 and is estimated to grow at a CAGR of 7.9% to reach USD 4.9 billion by 2035.
The growth is shaped by rising awareness around extending equipment life, protecting capital-intensive assets, and maximizing operational uptime across industrial environments. Manufacturers and asset owners are prioritizing condition-based maintenance as a core operational strategy, which continues to drive demand for advanced vibration monitoring solutions. Market momentum is also supported by ongoing consolidation activities, including collaborations and acquisitions, which are strengthening technological capabilities and expanding solution portfolios across the industry. At the same time, legacy inspection approaches are losing relevance in high-output industrial settings due to their limited effectiveness and lack of scalability. Continuous technological progress has elevated vibration monitoring into a data-driven discipline supported by wireless sensing, intelligent diagnostics, and connected analytics platforms. These innovations allow organizations to significantly reduce unexpected downtime, improve energy efficiency, and minimize material losses. As industrial operations become increasingly automated and uptime-sensitive, vibration monitoring systems are becoming an essential component of modern maintenance frameworks worldwide.
| Market Scope | |
|---|---|
| Start Year | 2025 |
| Forecast Year | 2026-2035 |
| Start Value | $2.3 Billion |
| Forecast Value | $4.9 Billion |
| CAGR | 7.9% |
The portable monitoring systems segment held 54.9% share, generating USD 506.7 million in 2025. This segment continues to gain traction due to its affordability, ease of deployment, and adaptability across a wide range of secondary and non-critical machinery where permanent installations are not economically justified.
The hardware segment held 58.5% share, reaching USD 539.5 million in 2025. Physical sensing components remain essential for capturing accurate machine condition data, while advances in miniaturization and wireless communication are enhancing performance, durability, and real-time responsiveness. Strong demand for reliable sensing infrastructure reflects the broader shift toward connected factories and continuous equipment diagnostics.
U.S. Vibrational Monitoring System for Machinery Market held 75.6% share in 2025. This leadership is driven by substantial investments in digital manufacturing, predictive maintenance programs, and expanding industrial and energy assets. Companies across the country are increasingly focused on extending machinery lifespan and reducing operational disruptions through proactive monitoring practices.
Key companies operating in the Global Vibrational Monitoring System for Machinery Market include SKF AB, Emerson Electric Co., ABB Ltd., Schaeffler AG, Rockwell Automation, Inc., Baker Hughes Company (Bently Nevada), Honeywell International Inc., Analog Devices, Inc., Bruel & Kjaer (HBK), SPM Instrument AB, National Instruments Corp., PCB Piezotronics, Fluke Corporation, Pruftechnik, and Waites Wireless Sensor Technologies. Companies in the vibrational monitoring system for machinery market are reinforcing their competitive position through continuous technology innovation, portfolio expansion, and strategic alliances. Many players are investing heavily in smart sensors, advanced analytics, and AI-driven diagnostics to deliver more accurate and actionable insights. Emphasis is also placed on integrating monitoring solutions with broader industrial IoT ecosystems to support predictive and prescriptive maintenance models. Firms are expanding service offerings, including remote monitoring, system integration, and lifecycle support, to deepen customer relationships. Geographic expansion and targeted acquisitions are being used to access new industrial sectors and regional markets.
Table of Contents
Chapter 1 Methodology and scope
- 1.1 Research approach
- 1.2 Quality Commitments
- 1.2.1 GMI AI policy & data integrity commitment
- 1.2.1.1 Source consistency protocol
- 1.2.1 GMI AI policy & data integrity commitment
- 1.3 Research Trail & Confidence Scoring
- 1.3.1 Research Trail Components
- 1.3.2 Scoring Components
- 1.4 Data Collection
- 1.4.1 Partial list of primary sources
- 1.5 Data mining sources
- 1.5.1 Paid sources
- 1.5.1.1 Sources, by region
- 1.5.1 Paid sources
- 1.6 Base estimates and calculations
- 1.6.1 Base year calculation for any one approach
- 1.7 Forecast model
- 1.7.1 Quantified market impact analysis
- 1.7.1.1 Mathematical impact of growth parameters on forecast
- 1.7.1 Quantified market impact analysis
- 1.8 Research transparency addendum
- 1.8.1 Source attribution framework
- 1.8.2 Quality assurance metrics
- 1.8.3 Our commitment to trust
Chapter 2 Executive summary
- 2.1 Industry 360° synopsis
- 2.2 Key market trends
- 2.2.1 Regional
- 2.2.2 System type
- 2.2.3 Monitoring purpose
- 2.2.4 Sensor technology
- 2.2.5 Deployment mode
- 2.2.6 End use industry
- 2.2.7 Distribution channel
Chapter 3 Industry insights
- 3.1 Industry ecosystem analysis
- 3.1.1 Raw material suppliers
- 3.1.2 Manufacturers
- 3.1.3 Value addition at each stage
- 3.1.4 Factor affecting the value chain
- 3.2 Industry impact forces
- 3.2.1 Growth drivers
- 3.2.1.1 IIoT & Industry 4.0 Adoption Acceleration
- 3.2.1.2 AI/ML-Powered VMS Adoption
- 3.2.1.3 MEMS Sensor Cost Reduction (SME Market Expansion)
- 3.2.1.4 Energy Transition & Regulatory Mandates
- 3.2.2 Industry pitfalls & challenges
- 3.2.2.1 High Upfront Capital Expenditure (Centralized Systems)
- 3.2.2.2 Skilled Workforce Shortage for VMS Data Interpretation
- 3.2.2.3 Cybersecurity & Data Privacy Concerns in Connected VMS
- 3.2.2.4 Market Consolidation & Intensifying Price Competition
- 3.2.3 Market opportunities
- 3.2.1 Growth drivers
- 3.3 Growth potential analysis
- 3.4 Pricing analysis, 2025 (driven by primary research)
- 3.4.1 Historical price trend analysis
- 3.4.2 Pricing strategy by player type
- 3.5 Regulatory landscape
- 3.5.1 Global Regulatory Framework
- 3.5.2 North America - OSHA, API Standards for Machinery Safety
- 3.5.3 Europe - Machinery Directive, CE Marking Requirements
- 3.5.4 Energy Sector-Specific Regulations (ISO 10816, ISO 20816 for Vibration Monitoring)
- 3.5.5 Aerospace Certification Standards (DO-160, AS9100)
- 3.5.6 Emerging Cybersecurity Regulations for Industrial IoT Systems
- 3.6 Porter's analysis
- 3.7 PESTEL analysis
- 3.8 Technological and innovation landscape
- 3.8.1 Current technological trends
- 3.8.2 Emerging technologies
- 3.9 Future market trends
- 3.10 Trade data analysis (driven by paid database) (HS Code: 85446090)
- 3.10.1 Import/export volume & value trends
- 3.10.2 Key trade corridors & tariff impact
- 3.11 Impact of AI & generative AI on the market
- 3.11.1 AI-driven disruption of existing business models
- 3.11.2 GenAI use cases & adoption roadmap by segment
- 3.11.3 Risks, limitations & regulatory considerations
- 3.12 Distribution infrastructure & channel penetration landscape (driven by primary research)
- 3.12.1 Channel coverage by region & format (modern vs. traditional trade)
- 3.12.2 Last-mile infrastructure gaps & emerging channel shifts
Chapter 4 Competitive landscape, 2025
- 4.1 Introduction
- 4.2 Company market share analysis
- 4.2.1 North America
- 4.2.2 Europe
- 4.2.3 Asia Pacific
- 4.2.4 Latin America
- 4.2.5 MEA
- 4.3 Company matrix analysis
- 4.4 Competitive analysis of major market players
- 4.5 Competitive positioning matrix
- 4.6 Key developments
- 4.6.1 Mergers & acquisitions
- 4.6.2 Partnerships & collaborations
- 4.6.3 New product launches
- 4.6.4 Expansion plans
Chapter 5 Market Estimates & Forecast, By System Type, 2022 - 2035 ($Billion, Thousand Units)
- 5.1 Key trends
- 5.2 Centralized monitoring systems
- 5.3 Distributed monitoring systems
- 5.3.1 Wired distributed systems
- 5.3.2 Wireless distributed systems
- 5.3.3 Hybrid distributed systems
- 5.4 Portable/handheld monitoring systems
Chapter 6 Market Estimates & Forecast, By Monitoring Purpose, 2022 - 2035 ($Billion, Thousand Units)
- 6.1 Key trends
- 6.2 Protection systems
- 6.3 Condition monitoring systems
Chapter 7 Market Estimates & Forecast, By Sensor Technology, 2022 - 2035 ($Billion, Thousand Units)
- 7.1 Key trends
- 7.2 Eddy current sensors
- 7.3 Piezoelectric accelerometers
- 7.4 Electromagnetic velocity sensors
- 7.5 Micro electromechanical systems (MEMS)
- 7.6 Strain gauge accelerometers
- 7.7 Piezoresistive accelerometers
- 7.8 Optical sensors
Chapter 8 Market Estimates & Forecast, By Deployment Mode, 2022 - 2035 ($Billion, Thousand Units)
- 8.1 Key trends
- 8.2 On premises
- 8.3 Cloud-based
- 8.4 Hybrid
Chapter 9 Market Estimates & Forecast, By End Use Industry, 2022 - 2035 ($Billion, Thousand Units)
- 9.1 Key trends
- 9.2 Oil & gas
- 9.2.1 Upstream
- 9.2.2 Midstream
- 9.2.3 Downstream
- 9.3 Power generation
- 9.3.1 Thermal power plants
- 9.3.2 Nuclear power plants
- 9.3.3 Renewable energy
- 9.4 Aerospace & defense
- 9.4.1 Commercial aviation
- 9.4.2 Military aviation
- 9.4.3 Spacecraft & satellites
- 9.5 Manufacturing & heavy industry
- 9.5.1 Steel & metals
- 9.5.2 Paper & pulp
- 9.5.3 Cement
- 9.5.4 Others
- 9.6 Mining & minerals
- 9.7 Marine & shipping
- 9.8 Automotive
- 9.9 Others (food & beverage, pharmaceuticals etc.)
Chapter 10 Market Estimates & Forecast, By Distribution Channel, 2022 - 2035 ($Billion, Thousand Units)
- 10.1 Key trends
- 10.2 Direct sales
- 10.3 Indirect sales
Chapter 11 Market Estimates & Forecast, By Region, 2022 - 2035 ($Billion, Thousand Units)
- 11.1 Key trends
- 11.2 North America
- 11.2.1 U.S.
- 11.2.2 Canada
- 11.3 Europe
- 11.3.1 Germany
- 11.3.2 UK
- 11.3.3 France
- 11.3.4 Spain
- 11.3.5 Italy
- 11.3.6 Netherlands
- 11.4 Asia Pacific
- 11.4.1 China
- 11.4.2 Japan
- 11.4.3 India
- 11.4.4 Australia
- 11.4.5 South Korea
- 11.5 Latin America
- 11.5.1 Brazil
- 11.5.2 Mexico
- 11.5.3 Argentina
- 11.6 MEA
- 11.6.1 South Africa
- 11.6.2 Saudi Arabia
- 11.6.3 UAE
Chapter 12 Company Profiles
- 12.1 Global Key Players
- 12.1.1 Alfa Laval
- 12.1.2 ABB Group
- 12.1.3 Baker Hughes
- 12.1.4 Emerson Electric
- 12.1.5 Honeywell International
- 12.1.6 Rockwell Automation
- 12.1.7 SKF Group
- 12.2 Regional Players
- 12.2.1 Bosch Rexroth
- 12.2.2 Bruel & Kjaer
- 12.2.3 Hansford Sensors
- 12.2.4 Kistler Group
- 12.2.5 Meggitt Sensing Systems
- 12.2.6 TE Connectivity
- 12.2.7 Wilcoxon Sensing Technologies
- 12.3 Emerging/Niche Specialists
- 12.3.1 Augury
- 12.3.2 BeanAir GmbH
- 12.3.3 ifm electronic GmbH
- 12.3.4 Monnit Corporation
- 12.3.5 Nanoprecise Sci-Corp
- 12.3.6 Petasense (Cognex)
- 12.3.7 Sushi Sensor (Yokogawa)