

|
시장보고서
상품코드
2101654
전기화학적 암모니아 합성 시장 기회, 성장 촉진요인, 업계 동향 분석 및 예측(2026-2035년)Electrochemical Ammonia Synthesis (Green NH3) Market Opportunity, Growth Drivers, Industry Trend Analysis, and Forecast 2026 - 2035 |
||||||

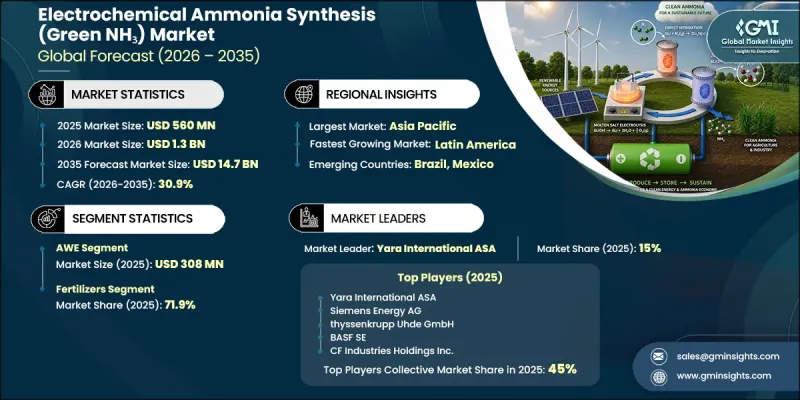
세계의 전기화학적 암모니아 합성(그린 NH3) 시장은 2025년에 5억 6,000만 달러 규모에 달하고, 2035년까지 CAGR 30.9%로 성장하여 147억 달러에 달할 것으로 추정됩니다.
이러한 성장은 해운 분야의 전 세계적 탈탄소화 노력, 유럽의 재생 가능 수소 의무화, 그리고 산업 전기화 목표의 가속화 등 여러 정책적 요인이 복합적으로 작용하여 이루어지고 있습니다. 동시에, 전해조의 효율이 급속히 향상되고 재생에너지 발전 비용이 하락함에 따라, 기존 암모니아 제조 방식과 비교한 ‘그린 프리미엄’은 꾸준히 축소되고 있습니다. 공공 자금에 의한 지원 프로그램은 상용화 일정을 대폭 앞당기는 동시에 초기 단계의 프로젝트 리스크를 낮추고 있습니다. 미국에서는 청정 수소 개발 및 전기화학적 질소 고정을 지원하는 연방 정부의 노력이 실증 프로젝트 확대에 기여하고 있으며, 수십억 달러 규모의 수소 허브 투자가 지역 생산 생태계를 강화하고 있습니다. 유럽에서는 주요 에너지 전환 프로그램에 기반한 장기적인 재생 수소 수입 및 생산 목표가 장거리 운송용 수소 운반체로서의 암모니아 수요를 뒷받침하고 있습니다. 이러한 동향들이 맞물리면서, 전기화학적 암모니아 합성은 파일럿 규모의 실험 단계에서 초기 상업화 단계로 전환되고 있으며, 에너지 개발 사업자, 화학 제조사 및 통합형 수소 생산 사업자의 참여도 증가하고 있습니다.
| 시장 범위 | |
|---|---|
| 시작 연도 | 2025년 |
| 예측 기간 | 2026-2035년 |
| 개시 금액 | 5억 6,000만 달러 |
| 예측 금액 | 147억 달러 |
| CAGR | 30.9% |
알칼리 수전해(AWE)는 2025년에 3억 800만 달러를 차지했으며, 이는 다른 전해 기술에 비해 높은 상업적 성숙도와 자금 조달 가능성을 반영합니다. AWE 시스템은 일반적으로 200-400 mA/cm²의 전류 밀도 범위에서 가동되며, 비교적 저비용인 니켈계 전극 재료를 채택하고 있습니다. 산업 분야 도입 실적을 통해 8만 시간을 넘는 가동 수명이 입증되었으며, 이러한 검증된 신뢰성 프로필과 새로운 경쟁 시스템에 비해 인식되는 실행 위험이 낮다는 점으로 인해 프로젝트 자금 제공자들에게 이 기술의 매력이 높아지고 있습니다.
비료 용도 부문은 2025년 4억 300만 달러에서 2035년까지 73억 5,000만 달러로 성장할 것으로 예상됩니다. 이 부문은 예측 기간 동안 시장 총매출에서 가장 큰 비중을 차지할 것으로 보입니다. 수요 증가는 규제 시장 및 고급 식품 공급망에서 저탄소 농업 투입재의 채택 확대와 밀접한 관련이 있습니다. 이러한 시장에서는 지속가능성 목표 달성 및 질소계 비료 생산 시 생애주기 배출량 감축을 위해 인증된 재생 가능 암모니아가 점점 더 선호되고 있습니다.
북미의 전기화학적 암모니아 합성(그린 NH3) 시장은 2025년에 1억 100만 달러 규모에 달했으며, 미국이 대부분의 점유율을 차지하는 반면, 캐나다는 신흥 재생에너지 관련 암모니아 프로젝트를 통해 기여하고 있습니다. 이 지역의 정책 환경은 2022년 이후, 특히 전기화학적 암모니아 합성 과정에서 수소 투입 비용을 직접 절감하는 연방 정부의 청정 수소 생산 인센티브를 통해 대폭 강화되었습니다. 이러한 인센티브는 전력 조달 원천 및 탄소 강도에 따라 암모니아 1톤당 생산 비용을 절감함으로써 프로젝트의 경제성을 효과적으로 향상시킵니다.
자주 묻는 질문
목차
제1장 조사 방법과 범위
제2장 주요 요약
제3장 업계 인사이트
제4장 경쟁 구도
제5장 시장 추정 및 예측 : 전해 기술별, 2022-2035년
제6장 시장 추정 및 예측 : 생산 규모별, 2022-2035년
제7장 시장 추정 및 예측 : 용도별, 2022-2035년
제8장 시장 추정 및 예측 : 최종 이용 산업별, 2022-2035년
제9장 시장 추정 및 예측 : 지역별, 2022-2035년
제10장 기업 개요
KSM 26.08.05The Global Electrochemical Ammonia Synthesis (Green NH3) Market was valued at USD 560 million in 2025 and is estimated to grow at a CAGR of 30.9% to reach USD 14.7 billion by 2035.
The expansion is shaped by overlapping policy frameworks, including global decarbonization commitments in shipping, renewable hydrogen mandates in Europe, and accelerating industrial electrification targets. At the same time, rapid improvements in electrolyzer efficiency and declining renewable power costs are steadily reducing the green premium versus conventional ammonia production routes. Public funding programs are significantly accelerating commercialization timelines and lowering early-stage project risk. In the United States, federal initiatives supporting clean hydrogen development and electrochemical nitrogen fixation are helping scale demonstration projects, while multi-billion-dollar hydrogen hub investments are strengthening regional production ecosystems. In Europe, long-term renewable hydrogen import and production targets under major energy transition programs are reinforcing demand for ammonia as a hydrogen carrier for long-distance transport. Collectively, these dynamics are pushing electrochemical ammonia synthesis from pilot-scale experimentation toward early commercial deployment, with increasing participation from energy developers, chemical manufacturers, and integrated hydrogen producers.
| Market Scope | |
|---|---|
| Start Year | 2025 |
| Forecast Year | 2026-2035 |
| Start Value | $560 Million |
| Forecast Value | $14.7 Billion |
| CAGR | 30.9% |
Alkaline water electrolysis (AWE) accounted for USD 308 million in 2025, reflecting its strong commercial maturity and bankability compared with alternative electrolysis technologies. AWE systems typically operate within current density ranges of 200-400 mA/cm2 and utilize comparatively low-cost nickel-based electrode materials. Industrial deployments have demonstrated operational lifetimes exceeding 80,000 hours, making the technology more attractive to project financiers due to its proven reliability profile and reduced perceived execution risk relative to newer competing systems.
The fertilizers application segment is expected to grow from USD 403 million in 2025 to USD 7,350 million by 2035. It continues to account for the largest share of total market revenue throughout the forecast period. Demand growth is closely tied to rising adoption of low-carbon agricultural inputs across regulated markets and premium food supply chains, where certified renewable ammonia is increasingly favored to meet sustainability targets and reduce lifecycle emissions in nitrogen-based fertilizer production.
North America Electrochemical Ammonia Synthesis (Green NH3) Market accounted for USD 101 million in 2025, with the United States holding the majority share and Canada contributing through emerging renewable energy-linked ammonia projects. The region's policy landscape has strengthened significantly since 2022, particularly through federal clean hydrogen production incentives that directly reduce hydrogen input costs for electrochemical ammonia synthesis. These incentives effectively improve project economics by lowering production costs per tonne of ammonia, depending on electricity sourcing and carbon intensity.
Major companies operating in the global electrochemical ammonia synthesis (green NH3) market include: BASF SE, FuelPositive Corporation, CF Industries Holdings Inc., Siemens Energy AG, McPhy Energy S.A., Air Products & Chemicals Inc., AM Green (formerly Greenko ZeroC), Fertiglobe, Casale SA, Topsoe A/S, thyssenkrupp Uhde GmbH, First Ammonia, ITM Power plc, Starfire Energy, Uniper SE, ACME Group, Enapter S.r.l., Yara International ASA, Green Hydrogen Systems, Nel ASA, Fortescue Future Industries (FFI), MAN Energy Solutions, and Technip Energies N.V. Electrochemical ammonia synthesis companies are prioritizing long-term offtake agreements with fertilizer producers and industrial gas buyers to secure predictable revenue streams and reduce project financing risk. Many players are integrating vertically with renewable energy developers to ensure low-cost green electricity supply, which is critical for improving production economics. Strategic partnerships with electrolyzer manufacturers are also being formed to optimize system efficiency and scale up capacity. Firms are investing heavily in pilot and demonstration plants to validate technology performance under real operating conditions and build bankability.
Table of Contents
Chapter 1 Methodology & Scope
- 1.1 Research approach
- 1.2 Quality Commitments
- 1.2.1 GMI AI policy & data integrity commitment
- 1.2.1.1 Source consistency protocol
- 1.2.1 GMI AI policy & data integrity commitment
- 1.3 Research Trail & Confidence Scoring
- 1.3.1 Research Trail Components
- 1.3.2 Scoring Components
- 1.4 Data Collection
- 1.4.1 Partial list of primary sources
- 1.5 Data mining sources
- 1.5.1 Paid sources
- 1.5.1.1 Sources, by region
- 1.5.1 Paid sources
- 1.6 Base estimates and calculations
- 1.6.1 Base year calculation for any one approach
- 1.7 Forecast model
- 1.7.1 Quantified market impact analysis
- 1.7.1.1 Mathematical impact of growth parameters on forecast
- 1.7.1 Quantified market impact analysis
- 1.8 Research transparency addendum
- 1.8.1 Source attribution framework
- 1.8.2 Quality assurance metrics
- 1.8.3 Our commitment to trust
Chapter 2 Executive Summary
- 2.1 Industry 360° synopsis
- 2.2 Key market trends
- 2.2.1 Regional
- 2.2.2 Electrolysis Technology
- 2.2.3 Production Scale
- 2.2.4 Application
- 2.2.5 End-User Industry
- 2.3 TAM Analysis, 2026-2035
- 2.4 CXO perspectives: Strategic imperatives
Chapter 3 Industry Insights
- 3.1 Industry ecosystem analysis
- 3.1.1 Supplier landscape
- 3.1.2 Profit margin
- 3.1.3 Value addition at each stage
- 3.1.4 Factor affecting the value chain
- 3.1.5 Disruptions
- 3.2 Industry impact forces
- 3.2.1 Growth drivers
- 3.2.2 Industry pitfalls and challenges
- 3.2.3 Market opportunities
- 3.3 Growth potential analysis
- 3.4 Regulatory landscape
- 3.4.1 North America
- 3.4.2 Europe
- 3.4.3 Asia Pacific
- 3.4.4 Latin America
- 3.4.5 Middle East & Africa
- 3.5 Porter’s analysis
- 3.6 PESTEL analysis
- 3.7 Price trends
- 3.7.1 By region
- 3.7.2 By product type
- 3.8 Future market trends
- 3.9 Technology and Innovation landscape
- 3.9.1 Current technological trends
- 3.9.2 Emerging technologies
- 3.10 Patent Landscape
- 3.11 Trade statistics (HS code)
- 3.11.1 Major importing countries
- 3.11.2 Major exporting countries
- 3.12 Sustainability and environmental aspects
- 3.12.1 Sustainable practices
- 3.12.2 Waste reduction strategies
- 3.12.3 Energy efficiency in production
- 3.12.4 Eco-friendly initiatives
- 3.13 Carbon footprint consideration
Chapter 4 Competitive Landscape, 2025
- 4.1 Introduction
- 4.2 Company market share analysis
- 4.2.1 By region
- 4.2.1.1 North America
- 4.2.1.2 Europe
- 4.2.1.3 Asia Pacific
- 4.2.1.4 LATAM
- 4.2.1.5 MEA
- 4.2.1 By region
- 4.3 Company matrix analysis
- 4.4 Competitive analysis of major market players
- 4.5 Competitive positioning matrix
- 4.6 Key developments
- 4.6.1 Mergers & acquisitions
- 4.6.2 Partnerships & collaborations
- 4.6.3 New Product Launches
- 4.6.4 Expansion Plans
Chapter 5 Market Estimates and Forecast, By Electrolysis Technology, 2022–2035 (USD Million)
- 5.1 Key trends
- 5.2 Alkaline Water Electrolysis (AWE)
- 5.3 Proton Exchange Membrane (PEM) Electrolysis
- 5.4 Solid Oxide Electrolyzer Cells (SOEC)
- 5.5 Others
Chapter 6 Market Estimates and Forecast, By Production Scale, 2022–2035 (USD Million)
- 6.1 Key trends
- 6.2 Large-Scale Stick-Built Plants (>600 MTPD)
- 6.3 Small-to-Medium Modular Plants (≤ 600 MTPD)
Chapter 7 Market Estimates and Forecast, By Application, 2022–2035 (USD Million)
- 7.1 Key trends
- 7.2 Fertilizers
- 7.3 Energy Storage & Hydrogen Carrier
- 7.4 Transportation Fuel
- 7.5 Industrial Feedstock
- 7.6 Power Generation & Fuel Cells
- 7.7 Others
Chapter 8 Market Estimates and Forecast, By End-User Industry, 2022–2035 (USD Million)
- 8.1 Key trends
- 8.2 Agriculture
- 8.3 Energy & Power
- 8.4 Transportation & Marine
- 8.5 Chemicals & Petrochemicals
- 8.6 Industrial Manufacturing
- 8.7 Others
Chapter 9 Market Estimates and Forecast, By Region, 2022–2035 (USD Million)
- 9.1 Key trends
- 9.2 North America
- 9.2.1 U.S.
- 9.2.2 Canada
- 9.3 Europe
- 9.3.1 Germany
- 9.3.2 UK
- 9.3.3 France
- 9.3.4 Spain
- 9.3.5 Italy
- 9.3.6 Rest of Europe
- 9.4 Asia Pacific
- 9.4.1 China
- 9.4.2 India
- 9.4.3 Japan
- 9.4.4 Australia
- 9.4.5 South Korea
- 9.4.6 Rest of Asia Pacific
- 9.5 Latin America
- 9.5.1 Brazil
- 9.5.2 Mexico
- 9.5.3 Argentina
- 9.5.4 Rest of Latin America
- 9.6 Middle East and Africa
- 9.6.1 Saudi Arabia
- 9.6.2 South Africa
- 9.6.3 UAE
- 9.6.4 Rest of Middle East and Africa
Chapter 10 Company Profiles
- 10.1 Yara International ASA
- 10.2 Siemens Energy AG
- 10.3 thyssenkrupp Uhde GmbH
- 10.4 BASF SE
- 10.5 CF Industries Holdings Inc.
- 10.6 Topsoe A/S
- 10.7 Nel ASA
- 10.8 Air Products & Chemicals Inc.
- 10.9 Fertiglobe
- 10.10 Uniper SE
- 10.11 ITM Power plc
- 10.12 ACME Group
- 10.13 AM Green (formerly Greenko ZeroC)
- 10.14 Fortescue Future Industries (FFI)
- 10.15 First Ammonia
- 10.16 Starfire Energy
- 10.17 FuelPositive Corporation
- 10.18 Casale SA
- 10.19 Green Hydrogen Systems
- 10.20 McPhy Energy S.A.
- 10.21 Enapter S.r.l.
- 10.22 Technip Energies N.V.
- 10.23 MAN Energy Solutions


