|
시장보고서
상품코드
2122433
암모니아 : 시장 점유율 분석, 업계 동향과 통계, 성장 예측(2026-2031년)Ammonia - Market Share Analysis, Industry Trends & Statistics, Growth Forecasts (2026 - 2031) |
||||||
 Mordor Intelligence
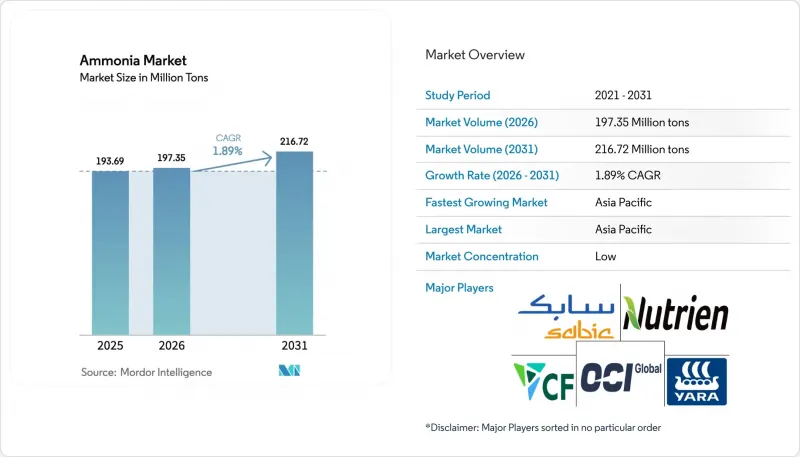
Mordor Intelligence에 의하면, 암모니아 시장 규모는 2025년에 1억 9,369만 톤으로 평가되었고, 2026년 1억 9,735만 톤에서 2031년까지 2억 1,672만 톤에 이를 것으로 예측되며, 예측 기간(2026-2031년) CAGR은 1.89%를 기록할 전망입니다.
본 보고서는 유형(액체 및 기체), 최종 사용자 산업(농업, 광업 및 금속, 섬유, 제약, 산업용 냉동, 발전, 기타 최종 사용자 산업), 지역(아시아태평양, 북미, 유럽, 남미, 중동 및 아프리카)별로 분류되어 있습니다. 시장 예측은 수량(톤) 기준으로 제시되어 있습니다.
세계 암모니아 시장 동향 및 인사이트
아시아 전역에서 저탄소 비료 수요의 급증
아시아태평양의 각국 정부는 보조금 지급을 탄소 집약도와 연계하는 방침을 내놓고 있으며, 이에 따라 대형 비료 제조업체들은 기존 암모니아 생산 거점에 전해 장치를 통합하도록 촉진되고 있습니다. 인도의 ‘직접 지급 제도(DBT)’에서는 그린 암모니아 5% 혼합이 의무화되어, 2027년까지 98만 톤의 추가 수요가 예상됩니다. 한편, 인도네시아 국영 기업 푸푸크 인도네시아(Pupuk Indonesia)는 페트로키미아 그레식(Petrokimia Gresik)을 재생 가능 수소 대응 시설로 개조하기 위해 12억 달러의 자금을 확보했습니다. 중국의 ‘제14차 5개년 계획’에서는 석탄을 연료로 하는 신규 생산 능력에 상한선을 설정하고, 연간 50만 톤을 초과하는 생산에 대해서는 이산화탄소 포집 및 저장(CCS) 준비를 의무화하고 있어, 생산은 효율적인 국영 복합 시설에 집중되고 있습니다. 이러한 조치로 인해 암모니아 시장에 새로운 공급량이 유입되고, 비료가 부족한 경제권에서의 수입 의존도가 높아지면서 중동 전역에서 새로운 그린 암모니아 상업 프로젝트가 촉진되고 있습니다.
선박 연료 및 수소 운반체로서의 채택
암모니아는 상온·상압 조건에서 1입방미터당 4.3 MWh의 에너지를 축적할 수 있어, 극저온 시스템을 필요로 하지 않으면서도 선박용 디젤 연료와 동등한 에너지 밀도를 실현합니다. 일본의 해운사인 일본우편선(NYK)은 2024년에 암모니아 연료 벌크선 12척을 발주했으며, 유럽해상안전청(EMSA)은 이중벽 배관과 증기 회수를 표준화하는 취급 지침을 발표하여 운영상의 위험에 대한 우려를 완화했습니다. 싱가포르는 2030년까지 연간 50만 톤을 목표로 하는 3건의 벙커링 라이선스를 발급했습니다. 이는 태평양 컨테이너 항로의 초기 수요 기반이 될 것입니다. 이러한 노력들이 합쳐져 2031년까지 연간 300만 톤을 흡수할 수 있는 전용 벙커링 네트워크가 구축되어 암모니아 시장의 확대로 이어질 것입니다.
천연가스 가격 변동이 전 세계 현금 비용을 상승시켜
천연가스는 그레이 암모니아 생산 비용의 최대 80%를 차지하기 때문에 원료 가격 변동에 따라 손익분기점에 있는 플랜트가 가동을 중단하게 됩니다. 유럽의 생산자들은 2025년에 평균 TTF 가격이 1MWh당 42유로에 달하면서, 이에 따라 현금 비용이 톤당 600유로를 초과하게 되어 그루파 아조티(Grupa Azoty)사는 18만 톤의 생산 능력을 4개월 동안 중단할 수밖에 없었습니다. 미국의 사업자들은 헨리 허브 가격이 1MMBtu당 3달러 미만으로 하락한 혜택을 누리고 있지만, LNG 수출로 인해 공급이逼迫하고 여름철 피크 수요가 증가함에 따라 이익 마진이 압박받고 있습니다. 아시아의 수입업체들은 현물 화물에 대해 1MMBtu당 12-14달러를 지불하고 있으며, 이로 인해 현지 암모니아는 경쟁력을 상실하고 중동산 암모니아에 대한 의존도가 높아지고 있습니다.
부문별 분석
2025년, 액체 암모니아는 전 세계 총량의 91.28%를 차지하며, 무수 암모니아를 파이프라인을 통해 비료 공장으로 수송하고 해상 무역용으로 가압 탱커에 적재하는 등 확고한 물류 체제를 뒷받침하고 있습니다. 대량 저장 및 냉동 비용은 납품 비용의 약 30%를 차지하지만, 투입된 자본으로 인해 급격한 전환이 어려워 액체 부문은 암모니아 시장에서 여전히 매우 중요한 위치를 차지하고 있습니다. 북아프리카 및 중동의 수출업체들은 천연가스 가격 급등으로 현지 생산이 억제되는 가운데, 탱커 선단을 활용하여 유럽 및 아시아 시장 진출을 모색하고 있는 반면, 멕시코만 연안의 수출업체들은 인접한 석유화학 인프라를 활용하여 라틴아메리카 시장에 공급하고 있습니다.
기상 암모니아 시장은 2031년까지 연평균 성장률(CAGR) 4.18%로 확대될 것으로 예측됩니다. 국제 암모니아 냉동 협회(IIAR)에 따르면, 식품 소매업 및 제약 업계의 산업용 냉동 설비 개조를 통해 합성 냉매가 현장에서 생성되는 기상 암모니아로 대체되면서 전력 소비량이 18% 감소했습니다. 중국의 나일론 및 아크릴 수지 제조업체들은 인접한 석탄 가스화 시설에서 기체 암모니아를 파이프라인을 통해 공급받아 반응 속도를 높이고 정제 공정을 줄이고 있습니다. 이러한 최종 용도에서의 효율성 향상으로 인해, 이 부문 시장 규모는 작지만 기체 형태의 매력은 높아지고 있습니다.
지역별 분석
아시아태평양은 2025년에 전 세계 총 생산량의 39.16%를 차지할 것으로 예상되며, 2031년까지 연평균 3.76%의 성장률을 기록하며 확대될 것으로 전망됩니다. 중국에서는 1톤당 31 GJ라는 에너지 효율 기준을 충족하지 못하는 소규모 석탄 가스화 플랜트를 폐쇄하고, 생산을 효율적인 국영 복합 시설로 집약함으로써 수입되는 그린 가스에 대한 수요 증가의 여지를 창출하고 있습니다. 인도에서는 국내 천연가스 공급 제약이 지속되는 가운데도, 혼합 의무화 및 보조금 제도 개혁을 통해 수요 증가가 예상됩니다. 일본과 한국은 비용이 높은 국내 생산에서 철수하고, 2030년까지 600만 톤의 수입에 대응할 수 있도록 항만 인프라를 재구축함으로써, 암모니아 시장에서 아시아의 생산자이자 소비자로서의 이중 역할을 강화하고 있습니다.
북미는 풍부한 셰일가스와 CO₂ 1톤당 최대 85달러에 달하는 ‘인플레이션 감축법(Inflation Reduction Act)’에 따른 인센티브의 혜택을 받고 있으며, 이는 멕시코만 연안 주변의 블루 암모니아 클러스터를 활성화시켜 멕시코의 암모니아 시장을 뒷받침하고 있습니다. CF 인더스트리즈, 뉴트리엔, 콕 비료 등 각사는 회수 설비 및 파이프라인 연결을 확충하여 톤당 320달러 미만공급 비용을 확보하고 있습니다. 캐나다의 수력 발전이 풍부한 주에서는 대서양 연안의 항구를 통해 수출 가능한 그린 암모니아 프로젝트를 위해 탄소 제로 수력 발전을 제안하고 있으며, 비료 분야를 넘어 지역적 영향력을 확대되고 있습니다.
유럽에서는 2024년부터 2025년에 걸쳐 가스 가격이 1MWh당 50유로를 돌파함에 따라 생산 능력이 제한되고 있어, 북아프리카 및 중동으로부터의 수입 의존도가 높아지고 있습니다. 유럽연합 집행위원회는 현재 ‘중요 원자재법’에 따라 암모니아를 ‘전략적’으로 분류하고, 국내 저탄소 프로젝트에 대한 인허가 절차를 효율화하고 있습니다. 한편, 카타르, 사우디아라비아, 아랍에미리트(UAE)는 1MMBtu당 2달러의 가스 가격을 활용하여 유럽과 아시아로 저탄소 화물을 수출하고 있습니다. 또한 이집트와 오만은 톤당 400달러 미만의 수출 패리티를 목표로 풍력·태양광 발전소 건설을 급속도로 추진하고 있습니다. 남미에서는 칠레 마가야네스 주에 풍력 발전 시설이, 브라질 페셈에 태양광 발전 프로젝트가 건설되고 있어 대서양 무역 흐름에 새로운 경쟁을 불러일으키고 있습니다.
기타 혜택:
- 엑셀 형식 시장 예측(ME) 시트
- 3개월간의 애널리스트 지원
자주 묻는 질문
목차
제1장 서론
제2장 조사 방법
제3장 주요 요약
제4장 시장 구도
제5장 시장 규모와 성장 예측
제6장 경쟁 구도
제7장 시장 기회와 향후 전망
LSH 26.09.03According to Mordor Intelligence, the ammonia market size was valued at 193.69 Million tons in 2025 and is estimated to grow from 197.35 Million tons in 2026 to reach 216.72 Million tons by 2031, at a CAGR of 1.89% during the forecast period (2026-2031).

This report is Segmented by Type (Liquid and Gas), End-User Industry (Agriculture, Mining and Metals, Textiles, Pharmaceutical, Industrial Refrigeration, Power Generation, and Other End-User Industries), and Geography (Asia-Pacific, North America, Europe, South America, and Middle East and Africa). The Market Forecasts are Provided in Terms of Volume (Tons).
Global Ammonia Market Trends and Insights
Surge in Low-Carbon Fertilizer Demand Across Asia
Asia-Pacific governments are linking subsidy disbursements to carbon intensity, prompting fertilizer majors to integrate electrolyzers at legacy ammonia sites. India's Direct Benefit Transfer scheme added a 5% green-ammonia blending requirement that opens 980,000 tons of incremental demand by 2027, while Indonesia's state-owned Pupuk Indonesia secured USD 1.2 billion to retrofit Petrokimia Gresik with renewable hydrogen. China's 14th Five-Year Plan caps new coal-based capacity and mandates capture readiness above 500,000 tons per year, crowding production into efficient state-owned complexes. These measures funnel fresh volume into the ammonia market, deepen import dependence in fertilizer-short economies, and underpin new merchant green-ammonia projects across the Middle East.
Adoption as Hydrogen Carrier for Maritime Bunkering
Ammonia stores 4.3 MWh per cubic meter at ambient conditions, matching marine-diesel energy density without cryogenic systems. Japanese shipper NYK ordered 12 ammonia-fueled bulk carriers in 2024 and the European Maritime Safety Agency published handling guidelines that standardize double-walled piping and vapor recovery, trimming perceived operational risk. Singapore granted three bunkering licenses targeting 500,000 tons per year by 2030, an early demand anchor for Pacific container routes. Together these actions seed a dedicated bunkering network that could absorb 3 million tons annually before 2031, widening the ammonia market.
Volatile Natural-Gas Prices Inflating Global Cash Costs
Natural gas forms up to 80% of grey-ammonia production cost, so feedstock swings shutter marginal plants. European producers faced average TTF prices of EUR 42 per MWh in 2025, pushing cash costs beyond EUR 600 per ton and forcing Grupa Azoty to idle 180,000 tons of capacity for four months. U.S. operators enjoy Henry Hub below USD 3 per MMBtu, yet LNG exports are tightening supply and lifting summer peaks, squeezing the margin cushion. Asian importers pay USD 12-14 per MMBtu for spot cargoes, making local ammonia uncompetitive and reinforcing reliance on Middle Eastern volumes.
Other drivers and restraints analyzed in the detailed report include:
- Rising Investments in Green-Ammonia Export Hubs
- Rising Usage in Explosive Production
- Safety and Toxicity Concerns Limiting Industrial Substitution
For complete list of drivers and restraints, kindly check the Table Of Contents.
Segment Analysis
Liquid retained 91.28% of global volume in 2025, underscoring entrenched logistics that pipe anhydrous ammonia into fertilizer plants and load pressurized tankers for ocean trade. Bulk storage and refrigeration account for about 30% of delivered cost, yet the sunk capital discourages rapid switching, keeping the liquid segment pivotal to the ammonia market. North African and Middle Eastern exporters leverage tanker fleets to penetrate Europe and Asia as high natural-gas prices curtail local output, while Gulf Coast exporters exploit contiguous petrochemical infrastructure to reach Latin America.
Gas-phase is projected to expand at a 4.18% CAGR through 2031. Industrial refrigeration retrofits in food retail and pharmaceuticals substitute synthetic refrigerants with on-site gaseous ammonia, shrinking power consumption by 18% according to the International Institute of Ammonia Refrigeration. China's nylon and acrylic producers pipe gaseous ammonia from adjacent coal-gasification units to boost reaction kinetics and trim purification steps. These end-use efficiencies widen the appeal of gaseous formats despite the segment's smaller base.
Complete Report Scope:
- By Type
- Liquid
- Gas
- By End-user Industry
- Agriculture
- Mining and Metals
- Textiles
- Pharmaceutical
- Industrial Refrigeration
- Power Generation
- Other End-user Industries (Water-treatment, Rubber, Petroleum, Pulp and Paper)
- By Geography
- Asia-Pacific
- China
- India
- Japan
- South Korea
- ASEAN Countries
- Rest of Asia-Pacific
- North America
- United States
- Canada
- Mexico
- Europe
- Germany
- United Kingdom
- France
- Italy
- NORDIC Countries
- Rest of Europe
- South America
- Brazil
- Argentina
- Rest of South America
- Middle East and Africa
- Saudi Arabia
- South Africa
- Rest of Middle East and Africa
- Asia-Pacific
Geography Analysis
Asia-Pacific captured 39.16% of global tonnage in 2025 and is forecast to compound at 3.76% through 2031. China is closing sub-scale coal units that fail to meet 31 GJ per ton energy benchmarks, channeling production to efficient state-owned complexes and opening space for imported green volumes. India's blending mandate and subsidy reforms lift incremental demand even as domestic natural-gas constraints persist. Japan and South Korea are retreating from high-cost local production and re-engineering port infrastructure for 6 million tons of imports by 2030, reinforcing Asia's dual role as producer and consumer of the ammonia market.
North America benefits from plentiful shale gas and Inflation Reduction Act incentives worth up to USD 85 per ton of CO2 sequestered, catalyzing blue-ammonia clusters around the Gulf Coast, supporting the Mexico ammonia market. CF Industries, Nutrien, and Koch Fertilizer are adding capture units and pipeline tie-ins, locking in sub-USD 320 per ton delivered costs. Canada's hydro-rich provinces pitch zero-carbon hydropower for green-ammonia projects that could export through Atlantic ports, extending regional influence beyond fertilizer.
In Europe, capacity is restricted in 2024-2025 as gas prices breached EUR 50 per MWh, reinforcing reliance on imports from North Africa and the Middle East. The European Commission now labels ammonia "strategic" under its Critical Raw Materials Act, intending to streamline permitting for domestic low-carbon projects. Meanwhile, Qatar, Saudi Arabia, and the UAE exploit USD 2 per MMBtu gas to ship low-carbon cargoes into Europe and Asia, while Egypt and Oman fast-track wind-and-solar-based plants that target sub-USD 400 per ton export parity. South America is building wind-powered facilities in Chile's Magallanes and solar-driven projects in Brazil's Pecem and injecting fresh competition into Atlantic trade flows.
- Acron Group
- BASF
- CF Industries Holdings, Inc.
- CSBP
- Dyno Nobel
- EuroChem Group
- Group DF
- Grupa Azoty S.A.
- IFFCO
- Industries Qatar
- JSC Togliattiazot
- Koch Fertilizer, LLC
- LSB Industries
- Nutrien
- OCI
- Orica Limited
- PetroChina Company Limited
- PT Pupuk Sriwidjaja Palembang
- Rashtriya Chemicals & Fertilisers
- SABIC
- The Mosaic Company
- Yara
Additional Benefits:
- The market estimate (ME) sheet in Excel format
- 3 months of analyst support
TABLE OF CONTENTS
1 Introduction
- 1.1 Study Assumptions and Market Definition
- 1.2 Scope of the Study
2 Research Methodology
3 Executive Summary
4 Market Landscape
- 4.1 Market Overview
- 4.2 Market Drivers
- 4.2.1 Surge in Low-Carbon Fertiliser Demand Across Asia
- 4.2.2 Adoption As a Hydrogen Carrier for Maritime Bunkering
- 4.2.3 Rising Investments in Green-Ammonia Export Hubs
- 4.2.4 Rising Usage in Explosive Production
- 4.2.5 India's Fertiliser-Subsidy Pivot Towards Green Blends
- 4.3 Market Restraints
- 4.3.1 Volatile Natural-Gas Prices Inflating Global Cash Costs
- 4.3.2 Safety and Toxicity Concerns Limiting Industrial Substitution
- 4.3.3 Electrolyser Supply-Chain Bottlenecks
- 4.4 Value Chain Analysis
- 4.5 Technological Outlook
- 4.6 Porter's Five Forces
- 4.6.1 Bargaining Power of Suppliers
- 4.6.2 Bargaining Power of Buyers
- 4.6.3 Threat of New Entrants
- 4.6.4 Threat of Substitutes
- 4.6.5 Degree of Competition
5 Market Size and Growth Forecasts (Volume)
- 5.1 By Type
- 5.1.1 Liquid
- 5.1.2 Gas
- 5.2 By End-user Industry
- 5.2.1 Agriculture
- 5.2.2 Mining and Metals
- 5.2.3 Textiles
- 5.2.4 Pharmaceutical
- 5.2.5 Industrial Refrigeration
- 5.2.6 Power Generation
- 5.2.7 Other End-user Industries (Water-treatment, Rubber, Petroleum, Pulp and Paper)
- 5.3 By Geography
- 5.3.1 Asia-Pacific
- 5.3.1.1 China
- 5.3.1.2 India
- 5.3.1.3 Japan
- 5.3.1.4 South Korea
- 5.3.1.5 ASEAN Countries
- 5.3.1.6 Rest of Asia-Pacific
- 5.3.2 North America
- 5.3.2.1 United States
- 5.3.2.2 Canada
- 5.3.2.3 Mexico
- 5.3.3 Europe
- 5.3.3.1 Germany
- 5.3.3.2 United Kingdom
- 5.3.3.3 France
- 5.3.3.4 Italy
- 5.3.3.5 NORDIC Countries
- 5.3.3.6 Rest of Europe
- 5.3.4 South America
- 5.3.4.1 Brazil
- 5.3.4.2 Argentina
- 5.3.4.3 Rest of South America
- 5.3.5 Middle East and Africa
- 5.3.5.1 Saudi Arabia
- 5.3.5.2 South Africa
- 5.3.5.3 Rest of Middle East and Africa
- 5.3.1 Asia-Pacific
6 Competitive Landscape
- 6.1 Market Concentration
- 6.2 Strategic Moves
- 6.3 Market Share(%)/Ranking Analysis
- 6.4 Company Profiles (includes Global Level Overview, Market Level Overview, Core Segments, Financials, Strategic Information, Market Rank/Share, Products and Services, Recent Developments)
- 6.4.1 Acron Group
- 6.4.2 BASF
- 6.4.3 CF Industries Holdings, Inc.
- 6.4.4 CSBP
- 6.4.5 Dyno Nobel
- 6.4.6 EuroChem Group
- 6.4.7 Group DF
- 6.4.8 Grupa Azoty S.A.
- 6.4.9 IFFCO
- 6.4.10 Industries Qatar
- 6.4.11 JSC Togliattiazot
- 6.4.12 Koch Fertilizer, LLC
- 6.4.13 LSB Industries
- 6.4.14 Nutrien
- 6.4.15 OCI
- 6.4.16 Orica Limited
- 6.4.17 PetroChina Company Limited
- 6.4.18 PT Pupuk Sriwidjaja Palembang
- 6.4.19 Rashtriya Chemicals & Fertilisers
- 6.4.20 SABIC
- 6.4.21 The Mosaic Company
- 6.4.22 Yara
7 Market Opportunities and Future Outlook
- 7.1 Ammonia Refrigeration Retro-fits in Food Retail
- 7.2 CCS Integration for Blue-Ammonia Clusters
- 7.3 White-Space and Unmet-Need Assessment