|
시장보고서
상품코드
1516468
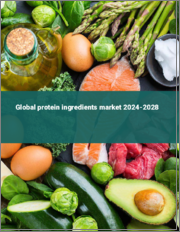
단백질 원료 시장(2024-2028년)Global protein ingredients market 2024-2028 |
||||||
단백질 원료 시장은 2023-20281년에 270억 2,560만 달러, 예측 기간 중 CAGR은 10.03%로 성장할 것으로 예측됩니다.
단백질 원료 시장의 전체적인 분석, 시장 규모·예측, 동향, 성장 촉진요인, 과제, 약 25개 벤더를 다룬 벤더 분석 등을 게재하고 있습니다.
현재 시장 시나리오, 최신 동향과 촉진요인, 시장 환경 전체에 관한 최신 분석을 제공하고 있습니다. 유아용 조제분유 시장의 성장, 대두 단백질의 수요 증가, 스포츠 영양 제품의 수요 증가가 시장을 촉진하고 있습니다.
| 시장 범위 | |
|---|---|
| 기준년 | 2024 |
| 종료년 | 2028 |
| 예측 기간 | 2024-2028 |
| 성장 모멘텀 | 가속 |
| 전년대비 2024년 | 8.88% |
| CAGR | 10.03% |
| 증분액 | 270억 2,560만 달러 |
본 조사에서는 향후 수년간 단백질 원료 시장의 성장을 촉진하는 주요 요인의 하나로 판촉 및 마케팅 구상의 증가를 들고 있습니다. 또한 식품 및 음료 업계의 성장과 유청의 건강 효과에 대한 의식의 향상은 시장의 큰 수요로 연결됩니다.
목차
제1장 개요
- 시장 개요
제2장 시장 구도
- 시장 에코시스템
- 시장의 특징
- 밸류체인 분석
제3장 시장 규모 평가
- 시장의 정의
- 시장 부문 분석
- 시장 규모 2023
- 시장 전망 2023-2028
제4장 시장 규모 실적
- 세계의 단백질 원료 시장 2018-2022
- 소스별 부문 분석 2018-2022
- 지역별 부문 분석 2018-2022
- 국가별 부문 분석 2018-2022
제5장 Five Forces 분석
- Five Forces 요약
- 바이어의 교섭력
- 공급 기업의 교섭력
- 신규 진출업체의 위협
- 대체품의 위협
- 경쟁의 위협
- 시장 현황
제6장 시장 세분화 : 소스별
- 시장 세분화
- 비교 : 소스별
- 동물성 단백질 : 시장 규모와 예측 2023-2028
- 식물성 단백질 : 시장 규모와 예측 2023-2028
- 시장 기회 : 소스별
제7장 고객 상황
- 고객 상황 개요
제8장 지역별 상황
- 지역별 세분화
- 지역별 비교
- 유럽 : 시장 규모와 예측 2023-2028
- 북미 : 시장 규모와 예측 2023-2028
- 아시아태평양 : 시장 규모와 예측 2023-2028
- 남미 : 시장 규모와 예측 2023-2028
- 중동 및 아프리카 : 시장 규모와 예측 2023-2028
- 미국 : 시장 규모와 예측 2023-2028
- 영국 : 시장 규모와 예측 2023-2028
- 중국 : 시장 규모와 예측 2023-2028
- 일본 : 시장 규모와 예측 2023-2028
- 독일 : 시장 규모와 예측 2023-2028
- 시장 기회 : 지역별
제9장 촉진요인·과제·기회·억제요인
- 시장 성장 촉진요인
- 시장이 해결해야 할 과제
- 촉진요인과 과제의 영향
- 시장의 기회·억제요인
제10장 경쟁 구도
- 개요
- 경쟁 구도
- 혼란 상황
- 업계의 리스크
제11장 경쟁 분석
- 기업 개요
- 기업의 시장 포지셔닝
- Archer Daniels Midland Co.
- Burcon NutraScience Corp
- Cargill Inc.
- CHS Inc
- Darling Ingredients Inc.
- DuPont de Nemours Inc.
- Fonterra Cooperative Group Ltd.
- Mead Johnson and Co. LLC
- Roquette Freres SA
- Sotexpro
제12장 부록
KSA 24.07.31The protein ingredients market is forecasted to grow by USD 27025.6 mn during 2023-2028, accelerating at a CAGR of 10.03% during the forecast period. The report on the protein ingredients market provides a holistic analysis, market size and forecast, trends, growth drivers, and challenges, as well as vendor analysis covering around 25 vendors.
The report offers an up-to-date analysis regarding the current market scenario, the latest trends and drivers, and the overall market environment. The market is driven by growing infant formula market, increase in demand for soy proteins, and growing demand for sports nutrition products.
Technavio's protein ingredients market is segmented as below:
| Market Scope | |
|---|---|
| Base Year | 2024 |
| End Year | 2028 |
| Series Year | 2024-2028 |
| Growth Momentum | Accelerate |
| YOY 2024 | 8.88% |
| CAGR | 10.03% |
| Incremental Value | $27025.6mn |
By Source
- Animal based protein
- Plant-based protein
By Geography
- Europe
- North America
- APAC
- South America
- Middle East and Africa
This study identifies the increase in promotional and marketing initiatives as one of the prime reasons driving the protein ingredients market growth during the next few years. Also, growth in food and beverages industry and rising awareness of health benefits of whey will lead to sizable demand in the market.
The report on the protein ingredients market covers the following areas:
- Protein ingredients market sizing
- Protein ingredients market forecast
- Protein ingredients market industry analysis
The robust vendor analysis is designed to help clients improve their market position, and in line with this, this report provides a detailed analysis of several leading protein ingredients market vendors that include Archer Daniels Midland Co., Axiom Foods Inc., Burcon NutraScience Corp, Cargill Inc., CHS Inc, Darling Ingredients Inc., DuPont de Nemours Inc., Farbest Brands, Fonterra Cooperative Group Ltd., Ingenza Ltd., Kewpie Corp., Mead Johnson and Co. LLC, Perfect Day Inc., Proeon, Protera, Roquette Freres SA, Rousselot SDN. BHD., Sotexpro, The Peterson Company, Victory Hemp Foods, and Ynsect SAS. Also, the protein ingredients market analysis report includes information on upcoming trends and challenges that will influence market growth. This is to help companies strategize and leverage all forthcoming growth opportunities.
The study was conducted using an objective combination of primary and secondary information including inputs from key participants in the industry. The report contains a comprehensive market and vendor landscape in addition to an analysis of the key vendors.
The publisher presents a detailed picture of the market by the way of study, synthesis, and summation of data from multiple sources by an analysis of key parameters such as profit, pricing, competition, and promotions. It presents various market facets by identifying the key industry influencers. The data presented is comprehensive, reliable, and a result of extensive research - both primary and secondary. The market research reports provide a complete competitive landscape and an in-depth vendor selection methodology and analysis using qualitative and quantitative research to forecast the accurate market growth.
Table of Contents
1 Executive Summary
- 1.1 Market overview
- Executive Summary - Chart on Market Overview
- Executive Summary - Data Table on Market Overview
- Executive Summary - Chart on Global Market Characteristics
- Executive Summary - Chart on Market by Geography
- Executive Summary - Chart on Market Segmentation by Source
- Executive Summary - Chart on Incremental Growth
- Executive Summary - Data Table on Incremental Growth
- Executive Summary - Chart on Company Market Positioning
2 Market Landscape
- 2.1 Market ecosystem
- Parent Market
- Data Table on - Parent Market
- 2.2 Market characteristics
- Market characteristics analysis
- 2.3 Value chain analysis
- Value Chain Analysis
3 Market Sizing
- 3.1 Market definition
- Offerings of companies included in the market definition
- 3.2 Market segment analysis
- Market segments
- 3.3 Market size 2023
- 3.4 Market outlook: Forecast for 2023-2028
- Chart on Global - Market size and forecast 2023-2028 ($ million)
- Data Table on Global - Market size and forecast 2023-2028 ($ million)
- Chart on Global Market: Year-over-year growth 2023-2028 (%)
- Data Table on Global Market: Year-over-year growth 2023-2028 (%)
4 Historic Market Size
- 4.1 Global Protein Ingredients Market 2018 - 2022
- Historic Market Size - Data Table on Global Protein Ingredients Market 2018 - 2022 ($ million)
- 4.2 Source segment analysis 2018 - 2022
- Historic Market Size - Source Segment 2018 - 2022 ($ million)
- 4.3 Geography segment analysis 2018 - 2022
- Historic Market Size - Geography Segment 2018 - 2022 ($ million)
- 4.4 Country segment analysis 2018 - 2022
- Historic Market Size - Country Segment 2018 - 2022 ($ million)
5 Five Forces Analysis
- 5.1 Five forces summary
- Five forces analysis - Comparison between 2023 and 2028
- 5.2 Bargaining power of buyers
- Bargaining power of buyers - Impact of key factors 2023 and 2028
- 5.3 Bargaining power of suppliers
- Bargaining power of suppliers - Impact of key factors in 2023 and 2028
- 5.4 Threat of new entrants
- Threat of new entrants - Impact of key factors in 2023 and 2028
- 5.5 Threat of substitutes
- Threat of substitutes - Impact of key factors in 2023 and 2028
- 5.6 Threat of rivalry
- Threat of rivalry - Impact of key factors in 2023 and 2028
- 5.7 Market condition
- Chart on Market condition - Five forces 2023 and 2028
6 Market Segmentation by Source
- 6.1 Market segments
- Chart on Source - Market share 2023-2028 (%)
- Data Table on Source - Market share 2023-2028 (%)
- 6.2 Comparison by Source
- Chart on Comparison by Source
- Data Table on Comparison by Source
- 6.3 Animal based protein - Market size and forecast 2023-2028
- Chart on Animal based protein - Market size and forecast 2023-2028 ($ million)
- Data Table on Animal based protein - Market size and forecast 2023-2028 ($ million)
- Chart on Animal based protein - Year-over-year growth 2023-2028 (%)
- Data Table on Animal based protein - Year-over-year growth 2023-2028 (%)
- 6.4 Plant-based protein - Market size and forecast 2023-2028
- Chart on Plant-based protein - Market size and forecast 2023-2028 ($ million)
- Data Table on Plant-based protein - Market size and forecast 2023-2028 ($ million)
- Chart on Plant-based protein - Year-over-year growth 2023-2028 (%)
- Data Table on Plant-based protein - Year-over-year growth 2023-2028 (%)
- 6.5 Market opportunity by Source
- Market opportunity by Source ($ million)
- Data Table on Market opportunity by Source ($ million)
7 Customer Landscape
- 7.1 Customer landscape overview
- Analysis of price sensitivity, lifecycle, customer purchase basket, adoption rates, and purchase criteria
8 Geographic Landscape
- 8.1 Geographic segmentation
- Chart on Market share by geography 2023-2028 (%)
- Data Table on Market share by geography 2023-2028 (%)
- 8.2 Geographic comparison
- Chart on Geographic comparison
- Data Table on Geographic comparison
- 8.3 Europe - Market size and forecast 2023-2028
- Chart on Europe - Market size and forecast 2023-2028 ($ million)
- Data Table on Europe - Market size and forecast 2023-2028 ($ million)
- Chart on Europe - Year-over-year growth 2023-2028 (%)
- Data Table on Europe - Year-over-year growth 2023-2028 (%)
- 8.4 North America - Market size and forecast 2023-2028
- Chart on North America - Market size and forecast 2023-2028 ($ million)
- Data Table on North America - Market size and forecast 2023-2028 ($ million)
- Chart on North America - Year-over-year growth 2023-2028 (%)
- Data Table on North America - Year-over-year growth 2023-2028 (%)
- 8.5 APAC - Market size and forecast 2023-2028
- Chart on APAC - Market size and forecast 2023-2028 ($ million)
- Data Table on APAC - Market size and forecast 2023-2028 ($ million)
- Chart on APAC - Year-over-year growth 2023-2028 (%)
- Data Table on APAC - Year-over-year growth 2023-2028 (%)
- 8.6 South America - Market size and forecast 2023-2028
- Chart on South America - Market size and forecast 2023-2028 ($ million)
- Data Table on South America - Market size and forecast 2023-2028 ($ million)
- Chart on South America - Year-over-year growth 2023-2028 (%)
- Data Table on South America - Year-over-year growth 2023-2028 (%)
- 8.7 Middle East and Africa - Market size and forecast 2023-2028
- Chart on Middle East and Africa - Market size and forecast 2023-2028 ($ million)
- Data Table on Middle East and Africa - Market size and forecast 2023-2028 ($ million)
- Chart on Middle East and Africa - Year-over-year growth 2023-2028 (%)
- Data Table on Middle East and Africa - Year-over-year growth 2023-2028 (%)
- 8.8 US - Market size and forecast 2023-2028
- Chart on US - Market size and forecast 2023-2028 ($ million)
- Data Table on US - Market size and forecast 2023-2028 ($ million)
- Chart on US - Year-over-year growth 2023-2028 (%)
- Data Table on US - Year-over-year growth 2023-2028 (%)
- 8.9 UK - Market size and forecast 2023-2028
- Chart on UK - Market size and forecast 2023-2028 ($ million)
- Data Table on UK - Market size and forecast 2023-2028 ($ million)
- Chart on UK - Year-over-year growth 2023-2028 (%)
- Data Table on UK - Year-over-year growth 2023-2028 (%)
- 8.10 China - Market size and forecast 2023-2028
- Chart on China - Market size and forecast 2023-2028 ($ million)
- Data Table on China - Market size and forecast 2023-2028 ($ million)
- Chart on China - Year-over-year growth 2023-2028 (%)
- Data Table on China - Year-over-year growth 2023-2028 (%)
- 8.11 Japan - Market size and forecast 2023-2028
- Chart on Japan - Market size and forecast 2023-2028 ($ million)
- Data Table on Japan - Market size and forecast 2023-2028 ($ million)
- Chart on Japan - Year-over-year growth 2023-2028 (%)
- Data Table on Japan - Year-over-year growth 2023-2028 (%)
- 8.12 Germany - Market size and forecast 2023-2028
- Chart on Germany - Market size and forecast 2023-2028 ($ million)
- Data Table on Germany - Market size and forecast 2023-2028 ($ million)
- Chart on Germany - Year-over-year growth 2023-2028 (%)
- Data Table on Germany - Year-over-year growth 2023-2028 (%)
- 8.13 Market opportunity by geography
- Market opportunity by geography ($ million)
- Data Tables on Market opportunity by geography ($ million)
9 Drivers, Challenges, and Opportunity/Restraints
- 9.1 Market drivers
- 9.2 Market challenges
- 9.3 Impact of drivers and challenges
- Impact of drivers and challenges in 2023 and 2028
- 9.4 Market opportunities/restraints
10 Competitive Landscape
- 10.1 Overview
- 10.2 Competitive Landscape
- Overview on criticality of inputs and factors of differentiation
- 10.3 Landscape disruption
- Overview on factors of disruption
- 10.4 Industry risks
- Impact of key risks on business
11 Competitive Analysis
- 11.1 Companies profiled
- Companies covered
- 11.2 Market positioning of companies
- Matrix on companies position and classification
- 11.3 Archer Daniels Midland Co.
- Archer Daniels Midland Co. - Overview
- Archer Daniels Midland Co. - Business segments
- Archer Daniels Midland Co. - Key news
- Archer Daniels Midland Co. - Key offerings
- Archer Daniels Midland Co. - Segment focus
- 11.4 Burcon NutraScience Corp
- Burcon NutraScience Corp - Overview
- Burcon NutraScience Corp - Product / Service
- Burcon NutraScience Corp - Key offerings
- 11.5 Cargill Inc.
- Cargill Inc. - Overview
- Cargill Inc. - Product / Service
- Cargill Inc. - Key news
- Cargill Inc. - Key offerings
- 11.6 CHS Inc
- CHS Inc - Overview
- CHS Inc - Business segments
- CHS Inc - Key offerings
- CHS Inc - Segment focus
- 11.7 Darling Ingredients Inc.
- Darling Ingredients Inc. - Overview
- Darling Ingredients Inc. - Business segments
- Darling Ingredients Inc. - Key news
- Darling Ingredients Inc. - Key offerings
- Darling Ingredients Inc. - Segment focus
- 11.8 DuPont de Nemours Inc.
- DuPont de Nemours Inc. - Overview
- DuPont de Nemours Inc. - Business segments
- DuPont de Nemours Inc. - Key news
- DuPont de Nemours Inc. - Key offerings
- DuPont de Nemours Inc. - Segment focus
- 11.9 Fonterra Cooperative Group Ltd.
- Fonterra Cooperative Group Ltd. - Overview
- Fonterra Cooperative Group Ltd. - Business segments
- Fonterra Cooperative Group Ltd. - Key news
- Fonterra Cooperative Group Ltd. - Key offerings
- Fonterra Cooperative Group Ltd. - Segment focus
- 11.10 Mead Johnson and Co. LLC
- Mead Johnson and Co. LLC - Overview
- Mead Johnson and Co. LLC - Product / Service
- Mead Johnson and Co. LLC - Key offerings
- 11.11 Roquette Freres SA
- Roquette Freres SA - Overview
- Roquette Freres SA - Product / Service
- Roquette Freres SA - Key offerings
- 11.12 Sotexpro
- Sotexpro - Overview
- Sotexpro - Product / Service
- Sotexpro - Key offerings
12 Appendix
- 12.1 Scope of the report
- 12.2 Inclusions and exclusions checklist
- Inclusions checklist
- Exclusions checklist
- 12.3 Currency conversion rates for US$
- Currency conversion rates for US$
- 12.4 Research methodology
- Research methodology
- 12.5 Data procurement
- Information sources
- 12.6 Data validation
- Data validation
- 12.7 Validation techniques employed for market sizing
- Validation techniques employed for market sizing
- 12.8 Data synthesis
- Data synthesis
- 13.9 360 degree market analysis
- 360 degree market analysis
- 12.10 List of abbreviations
- List of abbreviations