


|
시장보고서
상품코드
1441696
세계 화물 및 물류 시장 : 점유율 분석, 업계 동향과 통계, 성장 예측(2024-2029년)Freight and Logistics - Market Share Analysis, Industry Trends & Statistics, Growth Forecasts (2024 - 2029) |
||||||
■ 보고서에 따라 최신 정보로 업데이트하여 보내드립니다. 배송일정은 문의해 주시기 바랍니다.
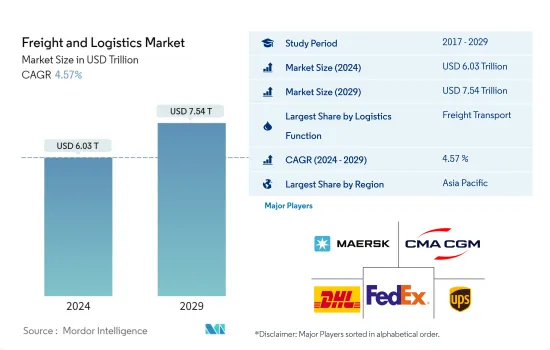
화물 및 물류시장 규모는 2024년 6조300억 달러로 추정되며, 2029년까지 7조5400억 달러에 이를 것으로 예측되며, 예측기간(2024-2029년) 동안 4.57%의 연평균 복합 성장률(CAGR)로 성장할 전망입니다.
아시아태평양은 세계 공항 인프라 투자를 선도하고 유럽과 미국이 이어지는
- 2020년에는 중국이 세계 인프라 지출을 이끌고 있었지만, 2022년 5월까지 현재 진행 중인 가장 고액의 인프라 프로젝트에 관해서는 유럽과 미국이 주도권을 잡았습니다. 2021년 현재 미국은 러시아, 중국, 인도를 넘어 6만 킬로미터를 넘는 세계에서 가장 긴 철도망을 자랑하고 있습니다.
- 2022년 5월 시점에서 인도는 진행 중 또는 계획 중인 인프라 프로젝트의 건수가 2,500만 달러에 이르러 세계 최고가 되었습니다. 이에 비해 미국에는 1,866건의 프로젝트가 있었고 중국에는 1,175건의 프로젝트가 있었습니다. 미국 캘리포니아의 고속철도 프로젝트는 세계에서 가장 가치 있는 인프라 프로젝트 중 하나로 인식되고 있으며, 2022년 10월 현재의 가치는 1,130억 달러로 추정됩니다. 철도 라인은 주요 인프라 프로젝트의 상당 부분을 차지합니다. 일본뿐만 아니라 노르웨이, 스웨덴, 영국, 미국, 아시아, 동남아시아의 다양한 지역을 망라하여 개발 중입니다.
- 2022년 3월 현재, 아시아태평양은 건설 중인 공항 인프라 프로젝트의 수로 1위를 차지했으며, 활주로 및 터미널과 같은 다양한 구성 요소를 포함하여 총 230개의 프로젝트가 진행되었습니다. 이 프로젝트의 총액은 2,275억 달러에 달했습니다. 이에 약간 차이가 계속되는 것이 유럽에서 건설중인 공항 인프라 프로젝트의 수가 두 번째로 많아 진행중인 프로젝트는 178건, 총액 1,090억 달러에 이르고 있습니다. 그러나 세계 공항 건설에 대한 전반적인 지출을 고려하면 북미 총 투자액은 1,175억 달러가 되었고, 다른 지역을 약간 웃돌았습니다.
불확실성에서 강한 가능성
- 아시아태평양, 북미, 유럽은 남미와 걸프 국가와 함께 세계 화물 및 물류 시장을 독점하고 있습니다. 2022년 세계 트럭 운송량은 전년 대비 3.6% 증가했으나 공급망 병목 현상은 계속해서 도로화물 운송에 영향을 미치고 있습니다. 아시아태평양과 유럽에 대한 대규모 투자 덕분에 세계 철도 산업은 2020년과 2022년 각각 1.6%와 4.1%의 성장을 기록했습니다. 철도 산업은 2027년까지 3%의 연평균 복합 성장률(CAGR)을 나타낼 것으로 예상되고 있습니다. 세계 성장에 영향을 미치는 우크라이나 전쟁과 인플레이션 상승은 세계 무역 운송의 80%를 차지하는 세계 해운에 영향을 미칠 수 있습니다. 전 세계 항공화물 수요는 2022년 10월 전년 대비 13.6% 감소했지만, 같은 달에는 전월 대비 3.5% 증가했습니다. 따라서 경제적 불확실성은 예측 기간 동안 항공화물 수요에 영향을 미칠 것으로 예상됩니다.
- 전자상거래 및 제조 부문에 의해 견인되며, 창고 및 물류 재고는 2030년까지 두 배로 증가하여 7억 평방 피트를 초과할 수 있습니다. 이 부문의 임대활동은 2022년 3분기에 전분기 대비 40% 증가하여 920만 평방피트에 달했습니다. 또한 전자상거래 붐으로 인해 2021년 주요 13개국의 수하물 양은 전년 대비 21% 증가했습니다. 2022년부터 2027년까지 8.5%의 연평균 복합 성장률(CAGR)을 나타낼 것으로 예상됩니다. 2021년에 가장 높은 수익을 올린 것은 미국으로 중국은 1,080억개의 소포를 낳았습니다.
- 2021년에 개설된 바레인의 세계해 대공물류 허브와 같은 물류 허브는 비용 효율적이고 더 빠른 화물 운송을 제공할 수 있습니다. 창고 보관을 업그레이드하고 현대화하기 위해 아시아태평양 창고 운영자의 90%가 차세대 자동화 기술에 투자하고 있으며 향후 5년간 세계적으로 시장이 확대될 것으로 예상됩니다.
세계 화물 및 물류 시장 동향
북미 운송 및 보관 시장은 투자 촉진으로 2022년 21.35%, 총 6,426억 달러로 증가했습니다.
- 아시아태평양에서는 세계 해상 무역의 상당 부분을 담당하는 해운을 중심으로 수송 수요가 증가하고 있습니다. 이 지역에는 세계에서 가장 이용객이 많은 컨테이너 항구가 9개 있으며, 세계 육상화물 운송의 40% 이상을 차지하고 있습니다. 2050년까지 이 지역의 화물 수송 수요는 3배로 증가할 것으로 예상됩니다. 한편 독일은 운송 및 창고 부문의 리더가 되어 프랑스와 영국을 뛰어넘어 수출입으로 세계 3위를 차지하고 있습니다. 교통 인프라를 개선하기 위해 독일 정부는 2022년 연방 고속도로에 120억 유로(128억 1,000만 달러) 이상, 수로에 약 18억 1,000만 달러를 투자할 예정입니다.
- 2022년 세계 해외직접투자(FDI) 흐름은 24% 감소했으며 총액 1조 2,860억 달러로 룩셈부르크를 제외하면 전년 대비 5% 감소했습니다. 미국은 여전히 최대 FDI 유입처로 3,180억 달러를 받아들인 다음 중국은 1,800억 달러였지만, 수준은 낮았습니다. 국경을 넘은 합병·인수(M&A) 활동은 거래 건수의 감소에 의해 감속했지만, 그린필드 투자의 전망은 계속 밝습니다.
- 북미 운송 및 보관은 전자상거래 창고 및 배송 센터 수요 증가로 2021년 전년 대비 14.31%에서 2022년 전년 대비 21.35%로 크게 성장했습니다. 이 성장은 수송의 다양한 측면을 포괄했으며 총액은 6,426억 달러에 달했습니다. 2022년 미국 교통부는 항만 인프라 개발 프로그램을 도입하고 항만 기능을 개선하고 공급망 신뢰성을 높이고 고용 기회를 창출하기 위해 22개 주 41개 프로젝트에 7억 300만 달러 이상을 할당했습니다.
1년 이상에 걸쳐 러시아 우크라이나 침공으로 세계 원유 및 석유 제품 시장이 혼란
- 2022년 세계 평균 가솔린 가격은 1리터당 1.22달러로 전년 대비 19% 상승하여 신형 코로나 바이러스 감염 이전 수준을 넘어섰습니다. 경기 회복 속에서 2021년 회복에 이어 2022년 가격은 전쟁으로 인한 공급 중단 위험으로 인한 원유 상승에 따라 상승했습니다. 유럽 가솔린 가격은 다른 지역에 비해 가장 높습니다. 아이슬란드, 노르웨이, 덴마크, 그리스, 핀란드, 네덜란드에서는 휘발유가 특히 높으며 갤런당 USD 7.6입니다.
- 브렌트 원유 가격은 2022년 상반기에 크게 상승했지만 하반기에는 전반적으로 하락했습니다. 브렌트 원유의 스팟 가격은 2022년 배럴당 평균 100달러였습니다. OPEC 원유 총 생산량은 2022년 3분기 일일 평균 2,920만 배럴에서 2022년 4분기에는 일량 2,860만 배럴로 감소했습니다. 2023년 OPEC 원유 생산량은 일일 평균 2,890만 배럴로 예상됩니다. 세계 수요가 기록적인 수준에 가까운 수준까지 계속 상승하고 있음에도 불구하고 러시아와 사우디아라비아가 총 일일 130만 배럴의 감산을 계속하고 있기 때문에 원유 가격은 지난해 11월 이후 최고점에 달했습니다.
- 디젤은 원유에서 생산되기 때문에 원유 가격은 디젤 가격과 밀접한 관련이 있습니다. 세계 디젤 공급에 대한 우려로 미국과 세계의 디젤 가격은 2022년 봄에 빠르게 상승했습니다. 원유가격은 2022년 하반기에 하락했지만, 미국의 디젤 선물 가격은 계절 수요와 유럽용 디젤 공급 우려로 2022년 10월 다시 상승해 1갤런당 3.95달러가 됐습니다. 러시아는 유럽에서 가장 큰 디젤 공급국입니다. 2023년에는 유럽이 러시아에서 수입해야 했던 대부분의 디젤을 다른 지역의 수입으로 대체할 수 있었기 때문에 유럽과 미국 모두에서 디젤 가격이 하락했습니다.
화물 및 물류 산업 개요
화물 및 물류 시장은 세분화되어 있으며 상위 5개 기업이 8.53%를 차지합니다. 이 시장의 주요 기업은 AP Moller-Maersk, CMA CGM, Deutsche Post DHL Group, FedEx, United Parcel Service(알파벳순)입니다.
기타 혜택
- 엑셀 형식 시장 예측(ME) 시트
- 3개월의 애널리스트 서포트
목차
제1장 주요 요약과 주요 조사 결과
제2장 보고서 제공
제3장 소개
- 조사의 전제조건과 시장의 정의
- 조사 범위
- 조사 방법
제4장 주요 업계 동향
- 인구동태
- 경제 활동별 GDP 분포
- 경제활동별 GDP 성장률
- 인플레이션
- 경제적 실적과 프로파일
- 전자상거래 업계 동향
- 제조업의 동향
- 운수 및 창고 부문의 GDP
- 수출 동향
- 수입 동향
- 연료 가격
- 트럭 운송 운영 비용
- 유형별 트럭 수송대의 규모
- 물류 실적
- 주요 트럭 공급업체
- 모달 점유율
- 해상함대의 내하중 능력
- 정기선 수송의 접속
- 포트콜과 퍼포먼스
- 화물 가격 동향
- 화물 톤수의 동향
- 인프라
- 규제 프레임워크(도로와 철도)
- 아르헨티나
- 호주
- 브라질
- 캐나다
- 칠레
- 중국
- 이집트
- 프랑스
- 독일
- 인도
- 인도네시아
- 이탈리아
- 일본
- 말레이시아
- 멕시코
- 네덜란드
- 나이지리아
- 북유럽인
- 카타르
- 러시아
- 사우디아라비아
- 남아프리카
- 스페인
- 태국
- 아랍에미리트(UAE)
- 영국
- 미국
- 베트남
- 규제 프레임워크(바다와 하늘)
- 아르헨티나
- 호주
- 브라질
- 캐나다
- 칠레
- 중국
- 이집트
- 프랑스
- 독일
- 인도
- 인도네시아
- 이탈리아
- 일본
- 말레이시아
- 멕시코
- 네덜란드
- 나이지리아
- 북유럽인
- 카타르
- 러시아
- 사우디아라비아
- 남아프리카
- 스페인
- 태국
- 아랍에미리트(UAE)
- 영국
- 미국
- 베트남
- 밸류체인과 유통채널 분석
제5장 시장 세분화(1. 모든 부문의 달러에서 시장 가치 2. 일부 부문 시장 규모, 화물 운송, CEP(택배, 신속 및 소포), 창고 보관 및 보관 3. 2029년까지 예측 및 분석 성장 전망)
- 최종 사용자 업계
- 농업, 어업, 임업
- 건설
- 제조업
- 석유 및 가스, 광업과 채석업
- 도소매업
- 기타
- 물류 기능
- 택배우편, 속달, 소포
- 받는 사람 유형별
- 국내
- 국제
- 화물 수송
- 수송수단별
- 항공
- 바다와 내륙 수로
- 기타
- 화물 수송
- 수송수단별
- 항공
- 파이프라인
- 철도
- 길
- 바다와 내륙의 수로
- 창고와 보관
- 온도 제어
- 비온도 관리
- 온도 관리
- 기타 서비스
- 택배우편, 속달, 소포
- 지역
- 아프리카
- 국가별
- 이집트
- 나이지리아
- 남아프리카
- 기타
- 아시아태평양
- 국가별
- 호주
- 중국
- 인도
- 인도네시아
- 일본
- 말레이시아
- 태국
- 베트남
- 기타
- 유럽
- 국가별
- 덴마크
- 핀란드
- 프랑스
- 독일
- 아이슬란드
- 이탈리아
- 네덜란드
- 노르웨이
- 러시아
- 스페인
- 스웨덴
- 영국
- 기타
- GCC
- 국가별
- 카타르
- 사우디아라비아
- 아랍에미리트(UAE)
- 기타
- 북미
- 국가별
- 캐나다
- 멕시코
- 미국
- 기타
- 남미
- 국가별
- 아르헨티나
- 브라질
- 칠레
- 기타 남미
- 세계 기타 지역
- 아프리카
제6장 경쟁 구도
- 주요 전략적 움직임
- 시장 점유율 분석
- 회사의 정세
- 기업 프로파일(세계 수준 개요, 시장 수준 개요, 핵심 비즈니스 부문, 재무, 직원 수, 주요 정보, 시장 순위, 시장 점유율, 제품 및 서비스 및 최근 동향 분석 포함).
- AP Moller-Maersk
- AllCargo Logistics Ltd
- Americold
- Aramex
- Bollore logistics
- CH Robinson
- CJ Logistics
- CMA CGM
- CTS Logistics Group
- Culina Group
- Dachser
- DB Schenker
- Deutsche Post DHL Group
- DP World
- DSV A/S(De Sammensluttede Vognmand af Air and Sea)
- Expeditors International
- FedEx
- GEODIS
- GXO Logistics
- Hellmann Worldwide Logistics
- Hub Group Inc
- International Distributions Services
- JBHunt Transport Services Inc.
- Japan Post Holdings Co., Ltd.
- JD Logistics
- Kerry Logistics
- Kintetsu World Express
- Kuehne Nagel
- La Poste Group
- Landstar System Inc.
- LOGWIN
- LX International Corp
- Mainfreight
- NFI Industries
- Nippon Yusen Kabushiki Kaisha(NYK Line)
- Orient Overseas Container Line(OOCL Logistics)
- Penske Logistics
- Poste Italiane
- Ryder Systems
- Savino Del Bene
- SF Express
- Sinotrans Limited
- TIBA Group
- Total Quality Logistics
- Uber Technologies Inc
- United Parcel Service
- XPO Logistics
- Yamato Holdings
제7장 CEO에 대한 주요 전략적 질문
제8장 부록
- 세계의 개요
- 출처와 참고문헌
- 표와 다이어그램 목록
- 주요 인사이트
- 데이터 팩
- 용어집
- 환율
The Freight and Logistics Market size is estimated at USD 6.03 trillion in 2024, and is expected to reach USD 7.54 trillion by 2029, growing at a CAGR of 4.57% during the forecast period (2024-2029).

Asia-pacific leading the investment in airport infrastructure worldwide followed by Europe and United States
- In 2020, China led global infrastructure spending, but by May 2022, Europe and the United States had taken the lead in terms of the most costly infrastructure projects currently in progress. As of 2021, the United States boasted the world's longest railway network, surpassing Russia, China, and India, spanning over 60,000 kilometers.
- In May 2022, India led the global count with the highest number of ongoing or planned infrastructure projects, amounting to USD 25 million. Comparatively, the United States had 1,866 projects, while China had 1,175 projects. The project of the High-Speed Rail Line in California, USA, was identified as one of the most valuable infrastructure endeavors worldwide, with an estimated worth of USD 113 billion as of October 2022. Railway lines constituted a significant portion of the major infrastructure projects under development, encompassing countries such as Norway, Sweden, the United Kingdom, the United States, various regions in Asia and Southeast Asia, as well as Japan.
- In March 2022, the Asia-Pacific region led in terms of the number of airport infrastructure projects being constructed, with a total of 230 projects encompassing various components like runways and terminals. The combined value of these projects amounted to USD 227.5 billion. Following closely behind, Europe had the second-highest number of airport infrastructure projects under construction, with 178 ongoing projects valued at USD 109 billion. However, when considering the overall expenditure on airport construction worldwide, North America slightly surpassed the other regions, with a total investment of USD 117.5 billion.
Strong potential amidst uncertainties
- Asia-Pacific, North America, and Europe dominate the global freight and logistics market, along with South America and GCC. While global trucking volumes witnessed an increase of 3.6% YoY in 2022, supply chain bottlenecks continue to impact road freight transportation. Owing to significant investments in Asia-Pacific and Europe, the global rail industry witnessed a growth of 1.6% and 4.1%, respectively, in 2020 and 2022. The rail industry is expected to record a CAGR of 3% through 2027. The Russia-Ukraine war and soaring inflation impacting global growth can affect global shipping, which accounts for 80% of global trade transport. The demand for global air cargo fell by 13.6% YoY in October 2022 but recorded a 3.5% MoM increase in the same month. Hence, economic uncertainties are expected to impact the demand for air cargo during the forecast period.
- Driven by the e-commerce and manufacturing sectors, warehousing and logistics stock will likely double by 2030 to cross 700 million square feet. Leasing activity in the segment grew by 40% QoQ in Q3 2022 to amount to 9.2 million square feet. The e-commerce boom also fueled parcel volumes by 21% YoY in 2021 in 13 major economies. It is expected to record a CAGR of 8.5% through 2022-2027. The United States generated the highest revenue, while China generated 108 billion parcels in 2021.
- Logistics hubs, like Bahrain's Global Sea-to-Air Logistics Hub, launched in 2021, could provide cost-effective and faster freight transportation. In order to upgrade and modernize warehousing, 90% of Asia-Pacific warehouse operators are investing in next-gen automation tech, which is anticipated to boost the market globally in the next five years.
Global Freight and Logistics Market Trends
The North American transportation and storage market increased to 21.35% in 2022, valued at USD 642.60 billion, with investment boost
- Asia Pacific is experiencing increased demand for transportation, especially in shipping, which handles a significant portion of global seaborne trade. This region boasts nine of the world's busiest container ports and accounts for more than 40% of global surface freight transport. By 2050, freight transport demand in the region is projected to triple. Meanwhile, Germany has become a leader in the transportation and warehousing sector, surpassing France and the United Kingdom, ranking third globally in imports and exports. To improve transportation infrastructure, the German government plans to invest over EUR 12 billion (USD 12.81 billion) in federal highways and about USD 1.81 billion in waterways in 2022.
- Global foreign direct investment (FDI) flows in 2022 fell by 24%, totaling USD 1,286 billion, or a 5% decrease when excluding Luxembourg, compared to the previous year. The United States remained the top destination for FDI inflows, receiving USD 318 billion, followed by China with USD 180 billion, although at lower levels. Cross-border merger and acquisition (M&A) activity slowed down with fewer deals, while the outlook for greenfield investment remained positive.
- Transportation and storage in North America saw a significant growth boost, rising from 14.31% YoY in 2021 to 21.35% YoY in 2022, driven by increased demand for e-commerce warehousing and distribution centers. This growth encompassed various transportation facets, reaching a total value of USD 642.60 billion. In 2022, the US Department of Transportation introduced the Port Infrastructure Development Program, allocating more than USD 703 million for 41 projects in 22 states to improve port capabilities, enhance supply chain reliability, and create job opportunities.
For over a year, Russia's invasion of Ukraine, has disrupted global crude oil and petroleum product markets
- In 2022, the global average price of gasoline at the pump was 1.22 USD per litre, a 19% increase from the previous year, exceeding pre-COVID-19 levels. Following the 2021 rebound amid economic recovery, 2022 prices hiked following crude oil increase as a result of supply disruption risk amid war. Gasoline prices in Europe are the highest compared to other regions. Gasoline is particularly expensive in Iceland, Norway, Denmark, Greece, Finland, and the Netherlands at 7.6 USD per gallon.
- The Brent crude oil price rose significantly in the first half of 2022 but generally declined in the second half of the year. The Brent crude oil spot price averaged USD 100 per barrel in 2022. Total OPEC crude oil production fell from an average of 29.2 million b/d in Q3 2022 to 28.6 million b/d in Q4 2022. In 2023, OPEC crude oil production is expected to average 28.9 million barrels per day. Oil prices have peaked since last November as Russia and Saudi Arabia continue to cut a total of 1.3 million barrels a day from their output, even as global demand continues to rise to near-record levels.
- Diesel is produced from crude oil, so crude oil prices are closely linked to diesel prices. Diesel prices in the United States and globally increased rapidly in the spring of 2022 because of concerns about global diesel supply. Although crude oil prices declined in the second half of 2022, United States diesel futures prices rose again in October 2022 to USD 3.95 per gallon due to seasonal demand and diesel supply concerns for Europe. Russia has been Europe's largest supplier of diesel. In 2023, diesel prices have declined in both Europe and the United States as Europe has been able to replace most of the diesel it would have imported from Russia with imports from other regions.
Freight and Logistics Industry Overview
The Freight and Logistics Market is fragmented, with the top five companies occupying 8.53%. The major players in this market are A.P. Moller - Maersk, CMA CGM, Deutsche Post DHL Group, FedEx and United Parcel Service (sorted alphabetically).
Additional Benefits:
- The market estimate (ME) sheet in Excel format
- 3 months of analyst support
TABLE OF CONTENTS
1 EXECUTIVE SUMMARY & KEY FINDINGS
2 REPORT OFFERS
3 INTRODUCTION
- 3.1 Study Assumptions & Market Definition
- 3.2 Scope of the Study
- 3.3 Research Methodology
4 KEY INDUSTRY TRENDS
- 4.1 Demographics
- 4.2 GDP Distribution By Economic Activity
- 4.3 GDP Growth By Economic Activity
- 4.4 Inflation
- 4.5 Economic Performance And Profile
- 4.5.1 Trends in E-Commerce Industry
- 4.5.2 Trends in Manufacturing Industry
- 4.6 Transport And Storage Sector GDP
- 4.7 Export Trends
- 4.8 Import Trends
- 4.9 Fuel Price
- 4.10 Trucking Operational Costs
- 4.11 Trucking Fleet Size By Type
- 4.12 Logistics Performance
- 4.13 Major Truck Suppliers
- 4.14 Modal Share
- 4.15 Maritime Fleet Load Carrying Capacity
- 4.16 Liner Shipping Connectivity
- 4.17 Port Calls And Performance
- 4.18 Freight Pricing Trends
- 4.19 Freight Tonnage Trends
- 4.20 Infrastructure
- 4.21 Regulatory Framework (Road and Rail)
- 4.21.1 Argentina
- 4.21.2 Australia
- 4.21.3 Brazil
- 4.21.4 Canada
- 4.21.5 Chile
- 4.21.6 China
- 4.21.7 Egypt
- 4.21.8 France
- 4.21.9 Germany
- 4.21.10 India
- 4.21.11 Indonesia
- 4.21.12 Italy
- 4.21.13 Japan
- 4.21.14 Malaysia
- 4.21.15 Mexico
- 4.21.16 Netherlands
- 4.21.17 Nigeria
- 4.21.18 Nordics
- 4.21.19 Qatar
- 4.21.20 Russia
- 4.21.21 Saudi Arabia
- 4.21.22 South Africa
- 4.21.23 Spain
- 4.21.24 Thailand
- 4.21.25 UAE
- 4.21.26 United Kingdom
- 4.21.27 United States
- 4.21.28 Vietnam
- 4.22 Regulatory Framework (Sea and Air)
- 4.22.1 Argentina
- 4.22.2 Australia
- 4.22.3 Brazil
- 4.22.4 Canada
- 4.22.5 Chile
- 4.22.6 China
- 4.22.7 Egypt
- 4.22.8 France
- 4.22.9 Germany
- 4.22.10 India
- 4.22.11 Indonesia
- 4.22.12 Italy
- 4.22.13 Japan
- 4.22.14 Malaysia
- 4.22.15 Mexico
- 4.22.16 Netherlands
- 4.22.17 Nigeria
- 4.22.18 Nordics
- 4.22.19 Qatar
- 4.22.20 Russia
- 4.22.21 Saudi Arabia
- 4.22.22 South Africa
- 4.22.23 Spain
- 4.22.24 Thailand
- 4.22.25 UAE
- 4.22.26 United Kingdom
- 4.22.27 United States
- 4.22.28 Vietnam
- 4.23 Value Chain & Distribution Channel Analysis
5 MARKET SEGMENTATION (includes 1. Market value in USD for all segments 2. Market volume for select segments viz. freight transport, CEP (courier, express, and parcel) and warehousing & storage 3.Forecasts up to 2029 and analysis of growth prospects)
- 5.1 End User Industry
- 5.1.1 Agriculture, Fishing and Forestry
- 5.1.2 Construction
- 5.1.3 Manufacturing
- 5.1.4 Oil and Gas, Mining and Quarrying
- 5.1.5 Wholesale and Retail Trade
- 5.1.6 Others
- 5.2 Logistics Function
- 5.2.1 Courier, Express and Parcel
- 5.2.1.1 By Destination Type
- 5.2.1.1.1 Domestic
- 5.2.1.1.2 International
- 5.2.2 Freight Forwarding
- 5.2.2.1 By Mode Of Transport
- 5.2.2.1.1 Air
- 5.2.2.1.2 Sea and Inland Waterways
- 5.2.2.1.3 Others
- 5.2.3 Freight Transport
- 5.2.3.1 By Mode Of Transport
- 5.2.3.1.1 Air
- 5.2.3.1.2 Pipelines
- 5.2.3.1.3 Rail
- 5.2.3.1.4 Road
- 5.2.3.1.5 Sea and Inland Waterways
- 5.2.4 Warehousing and Storage
- 5.2.4.1 By Temperature Control
- 5.2.4.1.1 Non-Temperature Controlled
- 5.2.4.1.2 Temperature Controlled
- 5.2.5 Other Services
- 5.2.1 Courier, Express and Parcel
- 5.3 Region
- 5.3.1 Africa
- 5.3.1.1 By Country
- 5.3.1.1.1 Egypt
- 5.3.1.1.2 Nigeria
- 5.3.1.1.3 South Africa
- 5.3.1.1.4 Rest of Africa
- 5.3.2 Asia Pacific
- 5.3.2.1 By Country
- 5.3.2.1.1 Australia
- 5.3.2.1.2 China
- 5.3.2.1.3 India
- 5.3.2.1.4 Indonesia
- 5.3.2.1.5 Japan
- 5.3.2.1.6 Malaysia
- 5.3.2.1.7 Thailand
- 5.3.2.1.8 Vietnam
- 5.3.2.1.9 Rest of Asia Pacific
- 5.3.3 Europe
- 5.3.3.1 By Country
- 5.3.3.1.1 Denmark
- 5.3.3.1.2 Finland
- 5.3.3.1.3 France
- 5.3.3.1.4 Germany
- 5.3.3.1.5 Iceland
- 5.3.3.1.6 Italy
- 5.3.3.1.7 Netherlands
- 5.3.3.1.8 Norway
- 5.3.3.1.9 Russia
- 5.3.3.1.10 Spain
- 5.3.3.1.11 Sweden
- 5.3.3.1.12 United Kingdom
- 5.3.3.1.13 Rest of Europe
- 5.3.4 GCC
- 5.3.4.1 By Country
- 5.3.4.1.1 Qatar
- 5.3.4.1.2 Saudi Arabia
- 5.3.4.1.3 UAE
- 5.3.4.1.4 Rest of GCC
- 5.3.5 North America
- 5.3.5.1 By Country
- 5.3.5.1.1 Canada
- 5.3.5.1.2 Mexico
- 5.3.5.1.3 United States
- 5.3.5.1.4 Rest of North America
- 5.3.6 South America
- 5.3.6.1 By Country
- 5.3.6.1.1 Argentina
- 5.3.6.1.2 Brazil
- 5.3.6.1.3 Chile
- 5.3.6.1.4 Rest of South America
- 5.3.7 Rest of the World
- 5.3.1 Africa
6 COMPETITIVE LANDSCAPE
- 6.1 Key Strategic Moves
- 6.2 Market Share Analysis
- 6.3 Company Landscape
- 6.4 Company Profiles (includes Global Level Overview, Market Level Overview, Core Business Segments, Financials, Headcount, Key Information, Market Rank, Market Share, Products and Services, and Analysis of Recent Developments).
- 6.4.1 A.P. Moller - Maersk
- 6.4.2 AllCargo Logistics Ltd
- 6.4.3 Americold
- 6.4.4 Aramex
- 6.4.5 Bollore logistics
- 6.4.6 C.H Robinson
- 6.4.7 CJ Logistics
- 6.4.8 CMA CGM
- 6.4.9 CTS Logistics Group
- 6.4.10 Culina Group
- 6.4.11 Dachser
- 6.4.12 DB Schenker
- 6.4.13 Deutsche Post DHL Group
- 6.4.14 DP World
- 6.4.15 DSV A/S (De Sammensluttede Vognmand af Air and Sea)
- 6.4.16 Expeditors International
- 6.4.17 FedEx
- 6.4.18 GEODIS
- 6.4.19 GXO Logistics
- 6.4.20 Hellmann Worldwide Logistics
- 6.4.21 Hub Group Inc
- 6.4.22 International Distributions Services
- 6.4.23 J.B.Hunt Transport Services Inc.
- 6.4.24 Japan Post Holdings Co., Ltd.
- 6.4.25 JD Logistics
- 6.4.26 Kerry Logistics
- 6.4.27 Kintetsu World Express
- 6.4.28 Kuehne + Nagel
- 6.4.29 La Poste Group
- 6.4.30 Landstar System Inc.
- 6.4.31 LOGWIN
- 6.4.32 LX International Corp
- 6.4.33 Mainfreight
- 6.4.34 NFI Industries
- 6.4.35 Nippon Yusen Kabushiki Kaisha (NYK Line)
- 6.4.36 Orient Overseas Container Line (OOCL Logistics)
- 6.4.37 Penske Logistics
- 6.4.38 Poste Italiane
- 6.4.39 Ryder Systems
- 6.4.40 Savino Del Bene
- 6.4.41 SF Express
- 6.4.42 Sinotrans Limited
- 6.4.43 TIBA Group
- 6.4.44 Total Quality Logistics
- 6.4.45 Uber Technologies Inc
- 6.4.46 United Parcel Service
- 6.4.47 XPO Logistics
- 6.4.48 Yamato Holdings
7 KEY STRATEGIC QUESTIONS FOR FREIGHT AND LOGISTICS CEOS
8 APPENDIX
- 8.1 Global Overview
- 8.1.1 Overview
- 8.1.2 Porter's Five Forces Framework
- 8.1.3 Global Value Chain Analysis
- 8.1.4 Market Dynamics (Market Drivers, Restraints & Opportunities)
- 8.1.5 Technological Advancements
- 8.2 Sources & References
- 8.3 List of Tables & Figures
- 8.4 Primary Insights
- 8.5 Data Pack
- 8.6 Glossary of Terms
- 8.7 Currency Exchange Rate


샘플 요청 목록