


|
시장보고서
상품코드
1637847
아시아태평양의 소매 분석 시장 : 점유율 분석, 산업 동향, 성장 예측(2025-2030년)Asia Pacific Retail Analytics - Market Share Analysis, Industry Trends & Statistics, Growth Forecasts (2025 - 2030) |
||||||
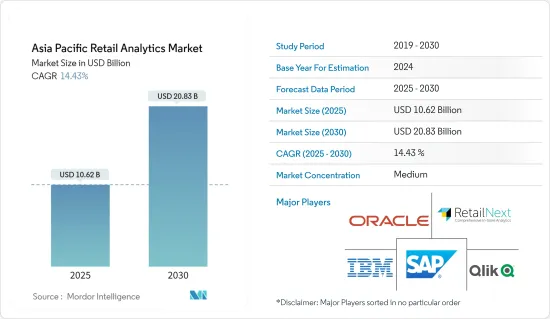
아시아태평양의 소매 분석 시장 규모는 2025년 106억 2,000만 달러, 2030년 208억 3,000만 달러로 추정되며, 예측 기간(2025-2030년)중 CAGR은 14.43%에 달할 것으로 예측됩니다.
주요 하이라이트
- 소매업체가 사물인터넷을 자주 이용하고 애널리틱스 도구를 신속하게 도입함으로써 시장이 급속히 확대되고 있습니다.
- 소매 분석은 재고 수준, 공급망 움직임, 소비자 수요, 판매 등에 대한 분석 데이터를 제공하며 마케팅 및 조달 의사 결정에 필수적입니다. 소매 분석은 소매 사업에서 생성된 데이터를 분석하고 수익성을 높이는 비즈니스 의사 결정을 내리는 것입니다. 수급에 대한 데이터 분석은 조달 수준 유지 및 마케팅 의사 결정에 적용될 수 있습니다.
- 여기에는 소매업 업무 절차, 판매 동향, 소비자 행동, 전체 성과를 파악하고 개선하기 위한 통찰력 제공도 포함됩니다. 오늘날 소매업에 대한 소비자의 기준이 높기 때문에 기업은 옴니채널에 맞는 제안, 실용적인 절차, 새로운 동향에 대한 신속한 조정으로 증가하는 수요를 충족해야 합니다. 이러한 모든 활동에는 소매 분석이 필요합니다. 중국, 일본, 인도, 기타 신흥 국가 등에서 소매점포가 늘어남에 따라 시장이 확대될 것으로 예상됩니다.
- 예를 들면, Reliance Retail은 2023년 2월, 이 나라의 미드 프리미엄 의류 시장을 시야에 넣어 내년 Gap를 복수 점포 오픈할 계획을 발표했습니다. Reliance Retail은 지난해 미국 캐주얼웨어 브랜드 Gap의 인도 판매권을 취득했습니다. 이 소매업체는 내년 전체 50개 점포의 신규 출점을 계획하고 있습니다. 이러한 출점은 소매업용 분석 솔루션에 대한 수요가 높아질 것으로 보입니다.
- 애널리틱스는 소매 기업이 더 나은 마케팅 의사 결정을 내리고 비즈니스 프로세스를 개선하고 개선하고 최적화해야 할 영역을 파악하여 전반적인 고객 경험을 제공하는 데 도움이 됩니다. 이 분야의 분석 솔루션에 대한 수요는 모든 국가에서 소매 업계의 급속한 확대와 함께 증가할 것으로 예상됩니다. 예를 들어 일본의 2023년 2월 소매 매출액은 전년 동월 대비 6.6% 증가했고, 시장 예상 5.8% 증가를 웃돌아 1월 개정치 5% 증가로 가속했습니다. 소매업 매출은 12개월 연속 증가했으며 2021년 5월 이후 가장 빠른 속도를 기록했습니다.
- 또한 소매 부문의 Industry 4.0 도입 확대가 시장 확대에 크게 기여하고 있습니다. 소매 애널리틱스 시장은 스마트폰과 전자상거래의 인기가 높아짐에 따라 확대되고 있습니다. 예측 기간 동안 소득 수준 상승, 빅데이터 및 애널리틱스에 대한 정부 지출, 자동화된 소매 기반 서비스에 대한 수요가 지역 소매 애널리틱스 시장을 자극할 것으로 예상됩니다.
- 소매 애널리틱스 시장의 성장은 소매 애널리틱스 툴과 관련된 설치, 유지보수, 테스트, 라이선싱 및 기타 기술적 인건비에 필요한 자본 지출이 높은 것이 큰 제약이 되고 있습니다. 또한 조직이 아닌 소매 부문은 기술에 대한 접근이 제한되어 있으며, 예산이 엄격하다는 점도 시장에 영향을 미치는 요인입니다.
아시아태평양의 소매 분석 시장 동향
솔루션 부문이 주요 시장 점유율을 차지할 것으로 예측
- 소매 업계는 경쟁이 치열해지고 있기 때문에 비즈니스 프로세스를 최적화하고 고객의 기대에 부응하는 것이 중요합니다. 모든 단계에는 데이터 분석 솔루션의 도입이 포함됩니다. 고객 히트 맵핑은 오퍼 및 상품 배치 최적화에도 사용할 수 있습니다. 게다가 소매 업계에서는 클라우드 서비스의 이용이 확대되고 있어 아시아태평양의 소매 애널리틱스 시장에도 곧 기회가 찾아올 것으로 보입니다.
- 또한 데이터 관리 솔루션이 이 지역의 소매 분석 분야를 지배할 것으로 예상됩니다. 소매업에서 데이터를 가장 자주 사용하는 방법 중 하나는 개인화된 마케팅입니다. 소매업체가 데이터 관리 측면에 더 많은 관심을 기울이면 그 노력이 크게 개선될 수 있습니다. 예를 들어, 제3자 정보에 타사 데이터를 추가하여 고객 타겟을 보다 정확하게 필터링할 수 있습니다.
- 또한 데이터 관리 솔루션의 중요성은 소매 및 전자상거래 분야에서도 높아지고 있습니다. 기술의 발달과 풍부한 정보를 통해 기업은 데이터를 활용하여 업무를 강화하고 더 나은 고객 서비스를 제공할 수 있게 되었습니다. 더 나은 데이터 관리는 그렇지 않으면 엄청나게 관리할 수 없는 데이터 세트를 통합하고 구조화함으로써 전체 소매 프로세스의 가시성을 높입니다.
- 아시아태평양의 소매 분석 업계를 견인하는 요인 중 하나는 데이터 분석 솔루션입니다. 데이터 애널리틱스는 소매업이 프로세스를 간소화하고 고객 경험을 향상시키고 매출을 늘릴 수 있는 강력한 도구를 제공하는 소매 부문의 게임 체인저 기술로 부상하고 있습니다. 소매업체는 데이터 분석을 활용하여 구매 내역, 브라우징 행동, 소셜 미디어 상담 등의 고객 데이터를 분석하여 개인에 맞는 추천 상품, 오퍼, 프로모션을 작성할 수 있습니다.
- 아시아태평양의 소매 부문은 끊임없이 변화하고 있으며 데이터 분석은 소매의 미래 발전에 크게 영향을 미칩니다. 또한 소매업에서의 디지털화의 진전과 함께 소매 매출의 성장은 아시아태평양의 신흥국 소매 기업에서 소매 분석 솔루션의 채용을 촉진하고 있습니다. 예를 들어 인도 소매업 협회(RAI)의 데이터에 따르면 2021년 2월부터 2022년 2월까지 소매 업계에서 인도 전역의 매출 성장률은 10%였습니다. 마찬가지로 2021년 2월부터 2022년 2월까지 북인도 매출 성장률은 17%, 서인도 매출 성장률은 16%였습니다.
일본은 아시아태평양의 소매 애널리틱스 시장에서 큰 견인역이 될 전망
- 일본의 리테일 애널리틱스 시장은 소매업에서의 데이터 애널리틱스 수요 증가와 함께 소매업의 매출 증가와 기술적 진보로 향후 수년간 대폭적인 성장을 이룰 것으로 분석되고 있습니다. 게다가 국내 소매 부문에서의 디지털 변혁의 진전은 앞으로 수년간 소매 애널리틱스 솔루션의 도입에 큰 성장 기회를 가져왔습니다.
- 또한 소매 분석은 마케팅 전략을 크게 향상시킬 수 있습니다. 현재 및 과거 고객의 위치, 연령, 선호도, 구매 패턴 및 기타 중요한 요소에 대해 수집한 정보를 활용하여 이상적인 고객을 파악하여 고객 타겟팅을 지원할 수 있습니다. 데이터 관리가 개선되면 데이터의 잠재력을 극대화하고 다양한 측면에서 소매업 업무를 개선하고 소매업체의 전자상거래 사이트의 기능을 향상시킬 수 있습니다. 따라서 예측 기간 동안 일본에서 소매 분석 솔루션 수요가 높아집니다.
- 향후, 실시간 분석, 인공지능, 머신러닝 등의 솔루션이 더욱 중요해질 것으로 예상됩니다. 이를 통해 소매업체가 매출을 늘리고 마케팅 계획을 간소화하고 고객에게 원활한 경험을 제공할 수 있습니다. 이러한 솔루션은 데이터 분석 솔루션의 일부로 소매 비즈니스에서 더 자주 사용될 것으로 예상됩니다.
- 게다가 편의점과 슈퍼마켓 등 소매업체와 조직이 일본 소매 업계의 소매 매출 증가를 배경으로 소매 애널리틱스 솔루션을 도입하기 때문에 수요가 급성장할 것으로 예상됩니다. 예를 들어 경제산업성의 데이터에 따르면 일본 소매 업계의 매출액은 150조엔(103조5,000억 달러)을 넘어, 그 중 슈퍼마켓이 단독 점포 유형으로서 15조1,500억엔(10조4,500억 달러)의 최대 점유율을 차지하고 있습니다. 이어 편의점이 12조 2,000억엔(8조 4,100억 달러)을 판매하고 있습니다.
아시아태평양의 소매 분석 업계 개요
아시아태평양의 소매 자동화 시장은 다수의 대기업들이 업계를 지배하고 있으며, 반통합적인 양상을 보이고 있습니다. 이 시장의 주요 진출기업에는 Oracle, IBM, SAP SE, Zoho, Adobe Systems Incorporated 등이 포함됩니다. 이러한 기업들은 인수, 제품 투입, 제휴 등 다양한 전략적 이니셔티브를 통해 시장에서의 존재감을 지속적으로 높이고 있으며, 시장 성장에 크게 기여하고 있습니다. 이 분야의 최근 동향을 몇 가지 소개하겠습니다.
2022년 11월, Qlik은 "Qlik Cloud Data Integration"으로 알려진 혁신적인 제품을 발표했습니다. 이 eiPaaS(Enterprise Integration Platform as a Service)는 기업 데이터 전략을 강화하도록 설계되었습니다. 이는 모든 기업 용도과 데이터 소스를 클라우드에 연결하는 실시간 데이터 통합 패브릭을 구축함으로써 실현됩니다. 클라우드 기능을 활용하고 다양한 데이터 소스, 대상 및 대상 간의 실시간 데이터 연결을 구축함으로써 Qlik Cloud Data Integration은 기업의 모든 구성원이 자신감을 갖고 데이터 중심의 의사 결정을 내릴 수 있도록 합니다.
2022년 3월, 유명한 엔터프라이즈 데이터 관리 공급업체인 Infomatica는 'Intelligent Data Management Cloud'(IDMC)의 첫 번째 소매업용 버전을 발표했습니다. Intelligent Data Management Cloud for Retail”로 명명된 이 전문 플랫폼은 Informatica의 머신러닝 기능을 갖춘 도구를 활용하여 분석 및 AI 용도에서 사용하는 데이터를 카탈로그화, 수집, 통합 및 준비하는 데 소매업체를 지원합니다. 이 맞춤형 솔루션은 소매업 특유의 데이터 관리 요구를 해결하고 기능을 더욱 강화합니다.
기타 혜택
- 엑셀 형식 시장 예측(ME) 시트
- 3개월간의 애널리스트 서포트
목차
제1장 서론
- 조사의 전제조건과 시장 정의
- 조사 범위
제2장 조사 방법
제3장 주요 요약
제4장 시장 인사이트
- 시장 개요
- 업계의 매력 Porter's Five Forces 분석
- 구매자의 협상력
- 공급기업의 협상력
- 신규 참가업체의 위협
- 대체품의 위협
- 구매자의 협상력
- 산업 밸류체인 분석
- 시장에 대한 COVID-19의 영향 평가
제5장 시장 역학
- 시장 성장 촉진요인
- 예측 분석 중시의 고조
- 데이터량의 지속적 증가
- 매출 예측에 대한 수요 증가
- 시장 성장 억제요인
- 신흥 지역에서의 일반적인 인식과 전문 지식의 부족
- 표준화와 통합 문제
제6장 시장 세분화
- 전개 모드별
- 온프레미스
- 온디맨드
- 유형별
- 솔루션(분석, 시각화 툴, 데이터 관리 등)
- 서비스(통합, 지원 및 컨설팅)
- 모듈 유형별
- 전략 및 계획(매크로 동향, KPI, 가치 분석)
- 마케팅(가격 설정, 로열티, 부문 분석)
- 재무관리(회계관리)
- 점포 오퍼레이션(부정 검지, 노동력 분석)
- 머천다이징(구색 최적화, 쇼퍼 패스 분석)
- 공급망 관리(재고, 벤더, 수급 모델링)
- 기타 모듈 유형
- 비즈니스 유형별
- 중소기업
- 대규모 조직
- 지역별
- 중국
- 인도
- 일본
- 한국
제7장 경쟁 구도
- 기업 프로파일
- SAP SE
- Oracle Corporation
- Qlik Technologies, Inc.
- Zoho Corporation
- IBM Corporation
- Retail Next, Inc.
- Alteryx, Inc.
- Tableau Software, Inc.
- Adobe Systems Incorporated
- Microstrategy, Inc.
- Prevedere Software, Inc.
- Targit
- Pentaho Corporation
- ZAP Business Intelligence
- Fuzzy Logix
제8장 투자 분석
제9장 시장 기회와 앞으로의 동향
JHS 25.02.12The Asia Pacific Retail Analytics Market size is estimated at USD 10.62 billion in 2025, and is expected to reach USD 20.83 billion by 2030, at a CAGR of 14.43% during the forecast period (2025-2030).

Key Highlights
- The market is expanding quickly due to retailers using the Internet of Things more frequently and adopting analytics tools faster.
- Retail analytics provides analytical data on inventory levels, supply chain movement, consumer demand, sales, etc., essential for marketing and procurement decisions. Retail analytics is the analysis of data generated by retail operations to make business decisions that drive profitability. Data analytics on supply and demand can be applied to maintain procurement levels and make marketing decisions.
- This includes offering insights to comprehend and improve the retail business's operational procedures, sales trends, consumer behavior, and overall performance. Because of consumers' high standards for retail today, companies must satisfy these growing demands with tailored omnichannel offers, practical procedures, and prompt adjustments to emerging trends. All of these activities require retail analytics. The market is expected to expand as more retail establishments open in countries such as China, Japan, India, and other developing nations.
- For instance, Reliance Retail announced in February 2023 that it planned to open multiple Gap stores next year with an eye toward the country's mid-premium apparel market. Reliance Retail acquired the rights to sell American casual wear brand Gap in India last year. The retailer plans to open 50 new locations overall in the upcoming year. The opening of such stores will increase demand for retail analytical solutions.
- Analytics can help retailers make better marketing decisions, improve business processes, and provide better overall customer experiences by identifying areas for improvement and optimization. The demand for analytical solutions in the sector is anticipated to increase with the rapid expansion of the retail industry across all countries. For instance, retail sales in Japan rose by 6.6% YoY in February 2023, exceeding market expectations of 5.8% and accelerating from a revised 5% growth in January. Retail trade increased for the 12th month, running the fastest since May 2021.
- Additionally, the retail sector's growing adoption of Industry 4.0 has significantly aided the market's expansion. The market for retail analytics is expanding due to the rising popularity of smartphones and e-commerce. During the forecast period, it is also anticipated that increasing income levels, government spending on big data and analytics, and demand for automated retail-based services will stimulate the regional retail analytics market.
- Retail analytics market growth is significantly constrained by the high capital expenditures required for installation, maintenance, testing, licensing, and other technical labor costs associated with retail analytics tools. Another factor impacting the market is the unorganized retail sectors' limited access to technology and tight budgets.
APAC Retail Analytics Market Trends
Solutions Segment is Anticipated to Hold Major Market Share
- The retail industry is becoming more competitive, so optimizing business processes and satisfying customer expectations is crucial. Every step includes the implementation of data analytical solutions. Customer heat mapping can also be used to optimize offers and product placement. Additionally, the retail industry's growing use of cloud services will soon open up opportunities in the Asia Pacific retail analytics market.
- Moreover, data management solutions are anticipated to dominate the region's retail analytic sector. One of the ways data is used in retail most frequently is for personalized marketing. If retailers focused more on the management side of data, their efforts could be significantly improved. For instance, adding data from third-party sources to their first-party information can help them target customers more precisely.
- Furthermore, the importance of data management solutions has grown within the retail and e-commerce sectors. Businesses can use data to enhance operations and provide better customer service as a result of the development of technology and the abundance of information now at their disposal. Better data management increases visibility across retail processes by compiling and structuring otherwise enormous, unmanageable data sets.
- One of the factors propelling the Asia-Pacific retail analytic industry is data analytical solutions. Data analytics has emerged as a game-changing technology in the retail sector that gives retailers strong tools to streamline their processes, enhance customer experiences, and boost sales. Retailers can use data analytics to create individualized recommendations, offers, and promotions by analyzing customer data such as purchase history, browsing behavior, and social media interactions.
- The retail sector in Asia-Pacific is constantly changing, and data analytics significantly impacts how retail will develop in the future. Moreover, the growth in retail sales coupled with increasing digitization in the retail sector is driving the adoption of retail analytics solutions among retail businesses in the emerging countries in Asia Pacific. For instance, according to the data from the Retailers Association of India (RAI), Pan India sales growth in the retail industry from February 2021 to February 2022 was 10%. Similarly, the sales growth in North India and Western India was 17% and 16% from February 2021 to February 2022.
Japan is Expected to Witness Significant Traction in APAC Retail Analytics Market
- The retail analytics market in Japan is analyzed to witness substantial growth in the coming years owing to the growth in retail sales and technological advancements in the retail sector coupled with the growing demand for data analytics in retail businesses. Moreover, the growing digital transformation in the country's retail sector is further offering substantial growth opportunities for the adoption of retail analytics solutions in the coming years.
- Additionally, retail analytics can significantly enhance marketing strategies. It can assist in customer targeting by identifying the ideal customer using information gathered on the location, age, preferences, buying patterns, and other significant factors of current and previous customers. Better data management will unlock data's full potential, improving retail operations on many fronts and enhancing the functionality of retailers' e-commerce sites. Thus propelling the demand for retail analytics solutions in Japan over the forecast period.
- Furthermore, it is anticipated that in the future, solutions like real-time analytics, artificial intelligence, and machine learning will become even more significant. These can aid retailers in increasing sales, streamlining their marketing plans, and giving customers a seamless experience. These solutions are anticipated to be used more frequently in retail businesses as part of data analytics solutions.
- Moreover, the demand is expected to grow at a rapid pace as more retail businesses and organizations, such as convenience stores, supermarkets, etc., adopt retail analytics solutions owing to growth in retail sales in the Japanese retail industry. For instance, according to the data from METI (Japan), the sales value of the retail industry in Japan exceeded JPY 150 trillion (USD 103.5 Trillion), out of which supermarkets accounted for the largest share of JPY 15.15 trillion (USD 10.45 trillion) as a standalone store type. Convenience stores followed as the second strongest retail type, with the sales of goods and services generating JPY 12.2 trillion (USD 8.41 trillion).
APAC Retail Analytics Industry Overview
The Asia Pacific Retail Automation Market exhibits semiconsolidated, with several major players dominating the industry. Key participants in this market include Oracle, IBM, SAP SE, Zoho, and Adobe Systems Incorporated, among others. These companies are continuously fortifying their market presence through various strategic initiatives, including acquisitions, product launches, and partnerships, which significantly contribute to the market's growth. Here are some recent developments within this sector:
In November 2022, Qlik introduced a transformative product known as "Qlik Cloud Data Integration." This Enterprise Integration Platform as a Service (eiPaaS) offering is designed to empower enterprise data strategies. It achieves this by creating a real-time data integration fabric connecting all enterprise applications and data sources to the cloud. By harnessing the capabilities of the cloud and establishing real-time data connections between diverse data sources, targets, and destinations, Qlik Cloud Data Integration enables all members of the enterprise to make data-driven decisions with confidence.
In March 2022, Informatica, a renowned enterprise data management vendor, unveiled the first retail-specific version of its "Intelligent Data Management Cloud" (IDMC). This specialized platform, known as "Intelligent Data Management Cloud for Retail," leverages Informatica's suite of machine learning-powered tools to assist retailers in cataloging, ingesting, integrating, and preparing data for use in analytical and AI applications. This tailored solution caters to the unique data management needs of the retail sector, further enhancing its capabilities.
Additional Benefits:
- The market estimate (ME) sheet in Excel format
- 3 months of analyst support
TABLE OF CONTENTS
1 INTRODUCTION
- 1.1 Study Assumptions and Market Definition
- 1.2 Scope of the Study
2 RESEARCH METHODOLOGY
3 EXECUTIVE SUMMARY
4 MARKET INSIGHTS
- 4.1 Market Overview
- 4.2 Industry Attractiveness Porter's Five Forces Analysis
- 4.2.1 Bargaining power of Buyers
- 4.2.2 Bargaining power of Suppliers
- 4.2.3 Threat of New Entrants
- 4.2.4 Threat of Substitute Products
- 4.2.5 Bargaining power of Buyers
- 4.3 Industry Value Chain Analysis
- 4.4 Assessment of COVID-19 impact on the Market
5 MARKET DYNAMICS
- 5.1 Market Drivers
- 5.1.1 Increased Emphasis on Predictive Analysis
- 5.1.2 Sustained increase in volume of data
- 5.1.3 Growing demand for sales forecasting
- 5.2 Market Restraints
- 5.2.1 Lack of general awareness and expertise in emerging regions
- 5.2.2 Standardization and Integration issues
6 MARKET SEGMENTATION
- 6.1 By Mode of Deployment
- 6.1.1 On-Premise
- 6.1.2 On-Demand
- 6.2 By Type
- 6.2.1 Solutions (Analytics, Visualization Tools, Data Management, etc.)
- 6.2.2 Services (Integration, Support & Consulting)
- 6.3 By Module Type
- 6.3.1 Strategy & Planning (Macro Trends, KPI, Value Analysis)
- 6.3.2 Marketing (Pricing, Loyalty and Segment Analysis)
- 6.3.3 Financial Management (Accounts Management)
- 6.3.4 Store Operations (Fraud Detection, Workforce Analytics)
- 6.3.5 Merchandising (Assortment Optimization, Shopper Path Analytics)
- 6.3.6 Supply Chain Management (Inventory, Vendor and Supply-Demand Modelling)
- 6.3.7 Other Module Types
- 6.4 By Business Type
- 6.4.1 Small and Medium Enterprises
- 6.4.2 Large-scale Organizations
- 6.5 Geography
- 6.5.1 China
- 6.5.2 India
- 6.5.3 Japan
- 6.5.4 South Korea
7 COMPETITIVE LANDSCAPE
- 7.1 Company Profiles
- 7.1.1 SAP SE
- 7.1.2 Oracle Corporation
- 7.1.3 Qlik Technologies, Inc.
- 7.1.4 Zoho Corporation
- 7.1.5 IBM Corporation
- 7.1.6 Retail Next, Inc.
- 7.1.7 Alteryx, Inc.
- 7.1.8 Tableau Software, Inc.
- 7.1.9 Adobe Systems Incorporated
- 7.1.10 Microstrategy, Inc.
- 7.1.11 Prevedere Software, Inc.
- 7.1.12 Targit
- 7.1.13 Pentaho Corporation
- 7.1.14 ZAP Business Intelligence
- 7.1.15 Fuzzy Logix
