|
시장보고서
상품코드
1851562
재생에너지 : 시장 점유율 분석, 산업 동향, 통계, 성장 예측(2025-2030년)Renewable Energy - Market Share Analysis, Industry Trends & Statistics, Growth Forecasts (2025 - 2030) |
||||||
재생에너지 시장 규모는 2025년 5,080기가와트에서 2030년에는 7,040기가와트로 확대되고, 예측 기간(2025-2030년)의 CAGR은 8.94%를 나타낼 것으로 예상됩니다.

기술 비용 급락, 정부 지원 정책, 기업 수요 증가가 이 확대를 지원하고 있습니다. 2024년 재생에너지 시장은 태양광 발전이 용량의 42%를 차지했으며, 2030년까지 연평균 복합 성장률(CAGR)은 13%를 나타낼 전망입니다. 유틸리티 규모의 프로젝트가 성장의 기간임에 변함은 없지만, 기업이 불안정한 화석연료가격을 헤지하고 지속가능성 목표를 강화함에 따라 상업 및 산업용(C&I)의 설치가 기세를 늘리고 있습니다. 아시아태평양이 가장 큰 점유율을 차지하고 있지만 남미는 투자 촉진 개혁과 풍부한 풍력·태양광 자원을 배경으로 가장 빠르게 성장하고 있습니다.
세계의 재생에너지 시장 동향과 인사이트
북미와 유럽에서 전력구매계약에 의한 대규모 발전소 건설 가속
기업용 전력구매계약(CPPA)은 하이테크 기업과 제조업이 AI, 클라우드, 중산업업무를 위해 깨끗한 전력을 확보하기 위해 현재 재생가능 에너지 조달의 중심이 되고 있습니다. 예를 들어, ENGIE가 2024년에 체결한 4.3GW를 커버하는 85건의 CPPA는 136TWh공급에 해당합니다. 기업의 자발적인 오프 테이크 계약은 이미 미국의 신규 전력 사업 규모의 약 절반을 지원하고 있으며 개발자에게 은행 소득을 제공하고 자본 비용을 낮추고 있습니다. 유연한 '가상' PPA는 구매자가 물리적인수를 받지 않고 가격 위험을 헤지할 수 있게 하지만, 그리드 수수료의 상승과 복잡한 계약은 여전히 중소기업의 발판이 되고 있습니다.
하이퍼스케일 데이터센터 수요가 북유럽과 아일랜드의 태양광·풍력 조달을 뒷받침
데이터센터의 전력 수요는 2024년 415TWh에서 2030년 945TWh에 이를 것으로 예상됩니다. 사업자는 냉량한 기후와 풍부한 자연에너지를 찾아 북유럽과 아일랜드를 선택합니다. Microsoft는 2024년 5월 아일랜드 레날레아 풍력 발전소에서 30메가와트의 풍력 발전을 추가하는 장기 CPPA에 서명했습니다. 워크로드 변화를 통해 데이터센터는 잉여 풍력을 흡수하는 유연한 부하 역할을 하며, 억제를 줄이고 재생에너지 시장의 통합 능력을 높일 수 있습니다.
ERCOT(미국)와 내부 몽골(중국)의 송전망의 혼잡과 억제 위험
ERCOT에 있어서 태양광과 풍력의 억제는 2024년에 29% 증가해 340만 MWh가 되었습니다. 텍사스주 서부의 자원과 섬세한 송전이 병목이 되고, 유사한 제약이 재생에너지 시장을 정체시키고 있는 중국의 내몽골을 반영하고 있습니다. 축전지와 계통 증강 장치는 실행 가능한 해결책이지만, 도입이 용량 추가에 늦어지기 때문에 개발자의 수익이 악화되어 미래의 프로젝트가 억제되고 있습니다.
부문 분석
2024년 발전 용량은 태양광 발전이 42%를 차지했고 2030년까지의 CAGR은 13%를 나타낼 전망입니다. 유틸리티 규모의 태양광 발전은 현재 많은 국가에서 가장 저렴한 신규 발전의 선택이 되고 있습니다. 페로브스카이트 실리콘 탠덤 셀이 31.6%의 실험실 효율을 달성했기 때문에 재생에너지 시장 규모는 2030년까지 80% 확대될 것으로 예측됩니다. 그러나 모듈공급 과잉은 생산자의 이익을 압박하고 있으며 중국에서 수입품에 대한 의존도를 낮추기 위해 미국과 유럽에서 국내 생산에 다각화를 촉구하고 있습니다.
중국 사막지역의 태양광 발전기지와 인도의 울트라메가 파크 등 대규모 설비는 기존 전력과의 비용 패리티를 추진하는 규모의 경제를 보여줍니다. 주택용 지붕으로의 도입도 제3자 소유와 가상 넷 미터링에 의해 개선되어, 가정의 초기 비용을 경감하고 있습니다. 이러한 동향은 재생에너지 시장용량에 있어서 태양광발전의 주요 공헌자로서의 역할을 확고하게 하고 있습니다.
육상 풍력과 해상 풍력은 재생에너지 시장에 다양성을 가져오며 연간 약 8%를 나타낼 전망입니다. 해상풍력발전 터빈의 정격출력은 18MW를 넘어 기초당 에너지 획득량이 증가하고 있습니다. 그러나 인플레이션과 공급망의 스트레스로 인해 비용은 입찰 수준을 넘어서고 전력 구매 계약의 재협상, 때로는 해지해야 합니다. 해상풍력발전의 재생에너지 시장 규모는 2025년까지 두배로 될 것으로 예측되고 있지만, 사업자는 자본배분의 리스크를 경감하기 때문에 보다 예측하기 쉬운 정책을 요구하고 있습니다.
유럽에서 사용한 블레이드의 재활용 의무와 인도의 현지 컨텐츠 규정은 공급망이 늦어지면 정책이 비용을 늘리는 방법을 보여줍니다. 저비용 아시아 터빈과의 경쟁으로 서유럽 제조업체는 시장에서의 존재감을 유지하기 위해 서비스 계약, 디지털 최적화 및 모듈 설계에 힘을 쏟고 있습니다.
재생에너지 시장 보고서는 기술별(태양에너지, 풍력에너지, 수력발전, 바이오에너지, 지열, 해양에너지), 최종사용자별(유틸리티, 상업 및 산업, 주택), 지역별(북미, 아시아태평양, 유럽, 남미, 중동 및 아프리카)으로 분류되어 있습니다. 시장 규모와 예측은 설치 용량(GW)으로 제공됩니다.
지역별 분석
아시아태평양은 재생에너지 시장 용량의 55%를 차지하고 2024년 세계 신규 추가 용량의 64%를 중국이 차지했습니다. 인도의 재생에너지 시장 규모는 인센티브 제도에 따라 2030년까지 4배의 62GW로 확대되었으며, 동남아시아 국가들은 축전과 송전망의 제약에 임하고 있습니다. 해외로부터의 직접투자는 2024년 580억 달러를 넘어 정책의 변동에도 불구하고 투자자의 신뢰를 뒷받침했습니다.
남미는 CAGR 16%로 가장 빠른 성장을 이룹니다. 브라질은 2024년 태양광 발전과 풍력 발전의 증설을 기록했지만, 송전 요금의 상승과 허가의 지연이 투자자의 의욕을 깎고 있습니다. 칠레와 콜롬비아는 또한 스팟 시장의 유동성을 높이는 데 도움이되어 상용 태양광 발전 프로젝트를 확대하고 있습니다.
북미는 인플레이션 감소법에서 미국 세금 공제의 혜택을 받고 있습니다. 태양광 발전 용량은 2025년까지 35% 증가하지만, 송전망의 혼잡이 프로젝트의 가동을 늦추고 있습니다. 텍사스 주와 중서부에서는 데이터센터의 요구와 풍부한 풍력·태양광 자원을 합치시키기 위해 기업용 PPA가 조달의 주류가 되고 있습니다.
유럽에서는 REPowerEU를 통해 2030년까지 1,200만kW의 자연 에너지를 목표로 하고 있습니다. 스페인은 송전망의 병목에도 불구하고 재생에너지 용량을 두배로 늘리고 이탈리아는 유연성을 보완하는 용량 시장 개혁을 시험적으로 실시했습니다. 유럽의 풍력 발전 부문에서는 저비용 중국 제조업체와공급망 경쟁이 과제가 되고 있지만, 허가 규칙의 개정에 의해 리드 타임은 단축되고 있습니다.
중동·북아프리카에서는 저렴한 태양열을 이용한 그린 수소의 개발이 진행되고 있습니다. 사우디아라비아는 2024년 입찰로 200만kW의 알 사다위 프로젝트를 포함한 370만kW의 태양광 발전을 후보로 꼽았습니다. 이집트의 Benban 복합 단지와 UAE의 Al Dhafra 공장은 국내 송전망과 미래 수소 수출 허브에 공급하는 대규모 건설을 보여줍니다.
기타 혜택 :
- 엑셀 형식 시장 예측(ME) 시트
- 3개월간의 애널리스트 지원
목차
제1장 서론
- 조사 전제조건과 시장 정의
- 조사 범위
제2장 조사 방법
제3장 주요 요약
제4장 시장 상황
- 시장 개요
- 재생에너지 믹스(2024년)
- 시장 성장 촉진요인
- 기업의 전력 구입 계약에 의해 북미와 유럽에서 전력 규모의 확대가 가속
- 하이퍼스케일 데이터센터 수요가 북유럽과 아일랜드의 태양 풍력 조달을 뒷받침
- 그린 수소의 기가와트 파이프라인이 중동·북아프리카와 호주의 용량 증가를 견인
- EU의 「REPowerEU」, 남유럽의 육상 풍력 발전의 리드 타임을 단축(12개월 미만)하는 고속 허가 제도
- 시장 성장 억제요인
- ERCOT(미국)와 내몽골 자치구(중국)에 있어서 송전망의 혼잡과 정지 리스크
- 독일과 프랑스에서 비용이 상승하는 사용된 풍력 터빈 블레이드 폐기물 규제
- 장기저장 부족이 동남아시아 VRE 보급 저하
- 인도와 브라질의 해상 풍력 발전 설비 투자를 밀어 올리는 현지 조달 의무
- 공급망 분석
- 규제 전망
- 기술 전망
- 최근 동향
- Porter's Five Forces
- 공급기업의 협상력
- 소비자의 협상력
- 신규 참가업체의 위협
- 대체품의 위협
- 경쟁 기업 간 경쟁 관계
제5장 시장 규모와 성장 예측
- 기술별
- 태양에너지(PV 및 CSP)
- 풍력에너지(육상 및 해상)
- 수력 발전(소형, 대형, PSH)
- 바이오에너지
- 지열
- 해양 에너지(조력 및 파력)
- 최종 사용자별
- 유틸리티
- 상업 및 산업
- 주택
- 지역별
- 북미
- 미국
- 캐나다
- 멕시코
- 유럽
- 영국
- 독일
- 프랑스
- 스페인
- 북유럽 국가
- 러시아
- 기타 유럽
- 아시아태평양
- 중국
- 인도
- 일본
- 한국
- 말레이시아
- 태국
- 인도네시아
- 베트남
- 호주
- 기타 아시아태평양
- 남미
- 브라질
- 아르헨티나
- 콜롬비아
- 기타 남미
- 중동 및 아프리카
- 아랍에미리트(UAE)
- 사우디아라비아
- 남아프리카
- 이집트
- 기타 중동 및 아프리카
- 북미
제6장 경쟁 구도
- 시장 집중도
- 전략적 움직임(M&A, JV, 자금 조달, PPA)
- 시장 점유율 분석(주요 기업의 시장 순위/점유율)
- 기업 프로파일
- EPC 개발자/운영자/소유자
- NextEra Energy, Inc.
- Orsted A/S
- Iberdrola, SA
- EDF Renewables(EDF SA)
- Duke Energy Corporation
- Berkshire Hathaway Energy
- Acciona Energia SA
- Engie SA
- China Three Gorges Corporation
- Enel Green Power SpA
- Statkraft AS
- Pattern Energy Group
- Invenergy LLC
- RWE Renewables GmbH
- ACWA Power
- EDP Renovaveis SA
- Brookfield Renewable Partners LP
- ReNew Energy Global PLC
- Scatec ASA
- 장비 공급자
- First Solar, Inc.
- Vestas Wind Systems A/S
- Siemens Gamesa Renewable Energy SA
- GE Vernova(General Electric)
- JinkoSolar Holding Co. Ltd.
- Canadian Solar Inc.
- Longi Green Energy Technology Co., Ltd.
- Goldwind Science & Technology Co., Ltd.
- Trina Solar Co., Ltd.
- Enphase Energy, Inc.
- Sungrow Power Supply Co., Ltd.
- Mitsubishi Power, Ltd.
- Nordex SE
- MHI Vestas Offshore Wind A/S
- Shanghai Electric Group Co., Ltd.
- Hitachi Energy Ltd.
- ABB Ltd.
- Climeon AB
- Pelamis Wave Power Ltd.(in Administration)
- Ocean Power Technologies, Inc.
- EPC 개발자/운영자/소유자
제7장 시장 기회와 향후 전망
KTH 25.11.21The Renewable Energy Market size in terms of installed base is expected to grow from 5.08 Thousand gigawatt in 2025 to 7.04 Thousand gigawatt by 2030, at a CAGR of 8.94% during the forecast period (2025-2030).
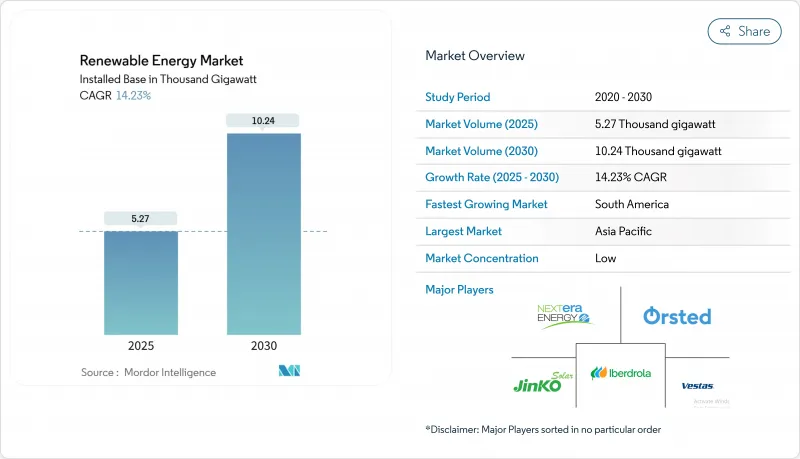
A sharp fall in technology costs, supportive government policies, and rising corporate demand underpin this expansion. Solar power led the renewable energy market in 2024 with 42% of capacity and is forecast to grow at a 13% CAGR through 2030. Utility-scale projects remain the backbone of growth, but commercial and industrial (C&I) installations are gaining momentum as companies hedge against volatile fossil-fuel prices and tighten sustainability targets. Asia-Pacific holds the largest regional share, while South America is advancing the fastest on the back of pro-investment reforms and plentiful wind and solar resources.
Global Renewable Energy Market Trends and Insights
Corporate power-purchase agreements accelerating utility-scale builds in North America & Europe
Corporate power-purchase agreements (CPPAs) are now central to renewable energy procurement as tech firms and manufacturers lock in clean electricity for AI, cloud, and heavy-industry operations. An example is ENGIE's 85 CPPAs covering 4.3 GW signed in 2024, equal to 136 TWh of supply. Voluntary corporate offtake deals already support around half of new US utility-scale projects, providing developers with bankable revenue and lowering the cost of capital. Flexible "virtual" PPAs let buyers hedge price risk without physical delivery, although rising grid tariffs and complex contracting still deter smaller firms.
Hyperscale data-centre demand boosting solar-wind procurement in the Nordics & Ireland
Data-centre electricity demand is projected to reach 945 TWh by 2030, up from 415 TWh in 2024. Operators gravitate to the Nordics and Ireland for cool climates and abundant renewables. In May 2024 Microsoft signed a long-term CPPA that adds 30 MW of wind power from Lenalea Wind Farm in Ireland sse.com. Workload-shifting lets data centres act as flexible loads that absorb surplus wind power, reducing curtailment and increasing the renewable energy market's integration capability.
Grid congestion & curtailment risks in ERCOT (US) and Inner Mongolia (CN)
Solar and wind curtailment in ERCOT rose 29% in 2024 to 3.4 million MWh. West Texas resources and sparse transmission create bottlenecks that mirror China's Inner Mongolia, where similar constraints slow the renewable energy market. Battery storage and grid-enhancing devices are viable fixes, but deployment lags capacity additions, eroding developer revenue and deterring future projects.
Other drivers and restraints analyzed in the detailed report include:
- Green-hydrogen gigawatt pipelines driving capacity additions in MENA & Australia
- EU 'REPowerEU' fast-track permitting cutting onshore-wind lead times (<12 months) in Southern Europe
- End-of-life blade-waste regulations raising costs in Germany & France
For complete list of drivers and restraints, kindly check the Table Of Contents.
Segment Analysis
Solar commanded 42% of capacity in 2024 and will rise at 13% CAGR to 2030. Utility-scale solar is now the cheapest new generation option in many countries. The renewable energy market size for solar installations is forecast to expand by 80% by 2030, aided by perovskite-silicon tandem cells achieving 31.6% lab efficiencies. Module oversupply, however, is squeezing producer margins, prompting diversification into domestic manufacturing in the United States and Europe to trim reliance on Chinese imports.
Massive installations such as China's desert solar bases and India's ultramega parks illustrate economies of scale that drive cost parity with conventional power. Residential rooftop uptake is also improving through third-party ownership and virtual net metering, easing upfront costs for households. These trends cement solar's role as the leading contributor to renewable energy market capacity.
Onshore and offshore wind add diversity to the renewable energy market, growing at roughly 8% annually. Turbine ratings now exceed 18 MW offshore, lifting energy capture per foundation. Yet inflation and supply-chain stress lifted costs above bid levels, forcing renegotiation and, in some cases, cancellation of power-purchase agreements. The renewable energy market size for offshore wind is forecast to double by 2025, but developers seek greater policy predictability to de-risk capital allocation.
End-of-life blade recycling mandates in Europe and local-content rules in India illustrate how policy can inflate costs if supply chains lag. Competition from low-cost Asian turbines is pushing Western manufacturers to focus on service contracts, digital optimisation, and modular designs to retain market presence.
The Renewable Energy Market Report is Segmented by Technology (Solar Energy, Wind Energy, Hydropower, Bioenergy, Geothermal, and Ocean Energy), End-User (Utility, Commercial and Industrial, and Residential), and Geography (North America, Asia-Pacific, Europe, South America, and Middle East and Africa). The Market Sizes and Forecasts are Provided in Terms of Installed Capacity (GW).
Geography Analysis
Asia-Pacific owns 55% of the renewable energy market capacity, led by China's 64% share of new global additions in 2024. India's renewable energy market size is set to quadruple to 62 GW by 2030 under incentive schemes, while Southeast Asian nations tackle storage and grid constraints. Foreign direct investment topped USD 58 billion in 2024, underlining investor confidence despite policy variability.
South America posts the fastest growth at 16% CAGR. Brazil recorded solar and wind additions in 2024, though rising transmission charges and permitting delays temper investor enthusiasm. Chile and Colombia are also scaling up merchant solar projects, helped by growing spot-market liquidity.
North America benefits from US tax credits within the Inflation Reduction Act. Solar capacity will climb 35% by 2025, though grid congestion slows project energisation. Corporate PPAs now dominate procurement in Texas and the Midwest, aligning data-centre needs with abundant wind and solar resources.
Europe is targeting 1,200 GW of renewables by 2030 through REPowerEU. Spain doubled its renewable capacity despite grid bottlenecks, and Italy is piloting capacity-market reforms that reward flexibility. Supply-chain competition with low-cost Chinese manufacturers challenges the European wind sector, though revamped permitting rules are shortening lead times.
MENA leverages cheap solar irradiation for green hydrogen. Saudi Arabia shortlisted 3.7 GW of solar in its 2024 tender round, including the 2 GW Al Sadawi project. Egypt's Benban complex and the UAE's Al Dhafra plant showcase large-scale builds that feed domestic grids and future hydrogen export hubs.
- EPC Developers / Operators / Owners
- Equipment Suppliers
Additional Benefits:
- The market estimate (ME) sheet in Excel format
- 3 months of analyst support
TABLE OF CONTENTS
1 Introduction
- 1.1 Study Assumptions & Market Definition
- 1.2 Scope of the Study
2 Research Methodology
3 Executive Summary
4 Market Landscape
- 4.1 Market Overview
- 4.2 Renewable Energy Mix, 2024
- 4.3 Market Drivers
- 4.3.1 Corporate Power-Purchase Agreements Accelerating Utility-scale Builds in North America & Europe
- 4.3.2 Hyperscale Data-Centre Demand Boosting Solar-Wind Procurement in the Nordics & Ireland
- 4.3.3 Green-Hydrogen Gigawatt Pipelines Driving Capacity Additions in MENA & Australia
- 4.3.4 EU 'REPowerEU' Fast-Track Permitting Cutting Onshore-Wind Lead-Times (<12 Months) in Southern Europe
- 4.4 Market Restraints
- 4.4.1 Grid Congestion & Curtailment Risks in ERCOT (US) and Inner Mongolia (CN)
- 4.4.2 End-of-Life Blade Waste Regulations Raising Costs in Germany & France
- 4.4.3 Lack of Long-Duration Storage Slowing High VRE Penetration in SE-Asia
- 4.4.4 Local-Content Mandates Inflating Offshore-Wind CAPEX in India & Brazil
- 4.5 Supply-Chain Analysis
- 4.6 Regulatory Outlook
- 4.7 Technological Outlook
- 4.8 Recent Trends & Developments
- 4.9 Porter's Five Forces
- 4.9.1 Bargaining Power of Suppliers
- 4.9.2 Bargaining Power of Consumers
- 4.9.3 Threat of New Entrants
- 4.9.4 Threat of Substitute Products & Services
- 4.9.5 Intensity of Competitive Rivalry
5 Market Size & Growth Forecasts
- 5.1 By Technology
- 5.1.1 Solar Energy (PV and CSP)
- 5.1.2 Wind Energy (Onshore and Offshore)
- 5.1.3 Hydropower (Small, Large, PSH)
- 5.1.4 Bioenergy
- 5.1.5 Geothermal
- 5.1.6 Ocean Energy (Tidal and Wave)
- 5.2 By End-User
- 5.2.1 Utility
- 5.2.2 Commercial and Industrial
- 5.2.3 Residential
- 5.3 By Geography
- 5.3.1 North America
- 5.3.1.1 United States
- 5.3.1.2 Canada
- 5.3.1.3 Mexico
- 5.3.2 Europe
- 5.3.2.1 United Kingdom
- 5.3.2.2 Germany
- 5.3.2.3 France
- 5.3.2.4 Spain
- 5.3.2.5 Nordic Countries
- 5.3.2.6 Russia
- 5.3.2.7 Rest of Europe
- 5.3.3 Asia-Pacific
- 5.3.3.1 China
- 5.3.3.2 India
- 5.3.3.3 Japan
- 5.3.3.4 South Korea
- 5.3.3.5 Malaysia
- 5.3.3.6 Thailand
- 5.3.3.7 Indonesia
- 5.3.3.8 Vietnam
- 5.3.3.9 Australia
- 5.3.3.10 Rest of Asia-Pacific
- 5.3.4 South America
- 5.3.4.1 Brazil
- 5.3.4.2 Argentina
- 5.3.4.3 Colombia
- 5.3.4.4 Rest of South America
- 5.3.5 Middle East and Africa
- 5.3.5.1 United Arab Emirates
- 5.3.5.2 Saudi Arabia
- 5.3.5.3 South Africa
- 5.3.5.4 Egypt
- 5.3.5.5 Rest of Middle East and Africa
- 5.3.1 North America
6 Competitive Landscape
- 6.1 Market Concentration
- 6.2 Strategic Moves (M&A, JVs, Funding, PPAs)
- 6.3 Market Share Analysis (Market Rank/Share for key companies)
- 6.4 Company Profiles (includes Global-level Overview, Market-level Overview, Core Segments, Financials, Strategic Information, Products & Services, Recent Developments)
- 6.4.1 EPC Developers / Operators / Owners
- 6.4.1.1 NextEra Energy, Inc.
- 6.4.1.2 Orsted A/S
- 6.4.1.3 Iberdrola, S.A.
- 6.4.1.4 EDF Renewables (EDF S.A.)
- 6.4.1.5 Duke Energy Corporation
- 6.4.1.6 Berkshire Hathaway Energy
- 6.4.1.7 Acciona Energia S.A.
- 6.4.1.8 Engie S.A.
- 6.4.1.9 China Three Gorges Corporation
- 6.4.1.10 Enel Green Power S.p.A.
- 6.4.1.11 Statkraft A.S.
- 6.4.1.12 Pattern Energy Group
- 6.4.1.13 Invenergy LLC
- 6.4.1.14 RWE Renewables GmbH
- 6.4.1.15 ACWA Power
- 6.4.1.16 EDP Renovaveis S.A.
- 6.4.1.17 Brookfield Renewable Partners L.P.
- 6.4.1.18 ReNew Energy Global PLC
- 6.4.1.19 Scatec ASA
- 6.4.2 Equipment Suppliers
- 6.4.2.1 First Solar, Inc.
- 6.4.2.2 Vestas Wind Systems A/S
- 6.4.2.3 Siemens Gamesa Renewable Energy S.A.
- 6.4.2.4 GE Vernova (General Electric)
- 6.4.2.5 JinkoSolar Holding Co. Ltd.
- 6.4.2.6 Canadian Solar Inc.
- 6.4.2.7 Longi Green Energy Technology Co., Ltd.
- 6.4.2.8 Goldwind Science & Technology Co., Ltd.
- 6.4.2.9 Trina Solar Co., Ltd.
- 6.4.2.10 Enphase Energy, Inc.
- 6.4.2.11 Sungrow Power Supply Co., Ltd.
- 6.4.2.12 Mitsubishi Power, Ltd.
- 6.4.2.13 Nordex SE
- 6.4.2.14 MHI Vestas Offshore Wind A/S
- 6.4.2.15 Shanghai Electric Group Co., Ltd.
- 6.4.2.16 Hitachi Energy Ltd.
- 6.4.2.17 ABB Ltd.
- 6.4.2.18 Climeon AB
- 6.4.2.19 Pelamis Wave Power Ltd. (in Administration)
- 6.4.2.20 Ocean Power Technologies, Inc.
- 6.4.1 EPC Developers / Operators / Owners
7 Market Opportunities & Future Outlook
- 7.1 White-space & Unmet-Need Assessment