
|
시장보고서
상품코드
1911421
북미의 국경 간 도로화물 운송 : 시장 점유율 분석, 업계 동향과 통계, 성장 예측(2026-2031년)North America Cross Border Road Freight Transport - Market Share Analysis, Industry Trends & Statistics, Growth Forecasts (2026 - 2031) |
||||||
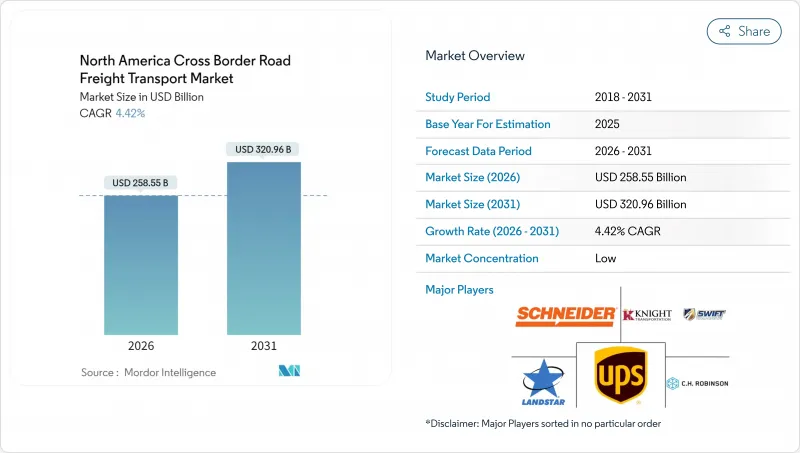
북미의 국경 간 도로화물 운송 시장은 2025년 2,476억 달러에서 2026년 2,585억 5,000만 달러에 이를 것으로 예측됩니다. 2026-2031년에 걸쳐 CAGR 4.42%로 성장을 지속하여 2031년까지 3,209억 6,000달러에 달할 전망입니다.

미국-멕시코-캐나다 협정(USMCA)에 따른 무역 통합과 멕시코로의 근거리 아웃소싱 가속화는 화물 운송 경로를 재조정하며, 태평양 횡단 노선에서 미국과 캐나다 소비자 지역 깊숙이 뻗어 있는 육상 국경 간 노선으로 물동량을 이동시키고 있습니다. 강력한 제조 연계성, 급속한 전자상거래 확산, 대규모 공공 인프라 프로그램이 결합되어 화물 적재 기회 확대와 주문-배송 주기 단축을 통해 북미 국경 간 도로 화물 운송 시장을 주도하고 있습니다. 통관 자동화, 실시간 가시성 도구 도입, 예측 분석을 국경 통과 절차에 통합한 운송업체들이 기존 운영사들을 앞지르고 있는 반면, 사이버 보안 대비 태세와 운전자 확보는 여전히 핵심 역량 격차로 남아 있습니다. 메가와트급 충전 회랑 및 디지털 ‘Complemento Carta Porte’ 규정 준수 플랫폼에 대한 투자는 스마트 국경 기준을 더욱 공고히 하여 경쟁 환경 전반에 걸친 기술 격차를 심화시키고 있습니다.
북미의 국경 간 도로화물 운송 시장 동향 및 인사이트
근거리 아웃소싱 붐이 북미 화물 회랑을 재편
아시아에서 멕시코로의 제조업 이전은 2024년 멕시코의 미국 수출을 23% 증가시켰으며, 태평양 관문을 우회하는 I-35 및 I-10을 따라 중량 화물 흐름을 고정시켰다. 전문 운송업체들은 이제 이러한 회랑에 전용 차량을 배치하여 멕시코 공장과 미국 유통 거점 간 왕복 활용도를 최적화하고 있습니다. 북행 물류의 안정성은 라레도, 엘패소, 샌디에고 국경 지대의 인프라 투자를 촉진하는 한편, 미국 중서부 허브에는 조립라인용 중간 부품 물량이 증가하고 있습니다. 동시에 남행 원자재 운송은 균형 잡힌 노선 밀도를 창출하여 자산 수익률을 강화합니다. 이러한 구조적 변화는 북미 국경 간 도로 화물 운송 시장의 장기적 확장을 뒷받침하는 영구적 무역 노선을 구축 중입니다.
전자상거래 가속화로 국경 간 LTL 물량 증가
2024년 국경 간 전자상거래 지출은 261억 캐나다 달러(192억 달러)에 달했으며, 이 중 31%는 미국 소매업체의 캐나다 수출과 연관되었습니다. 소형 소포 물류의 확산은 국경 인근 통합 게이트웨이 수요를 촉진합니다. 자동 분류 시스템, 브로커 오브 레코드 서비스, 관세 최적화 엔진을 갖춘 LTL 운송사들은 이제 2일 내 국경 간 배송에 프리미엄 요금을 부과하고 있습니다. 옴니채널 모델의 성장은 소매점 재고 보충과 공급업체 반품 루프를 더욱 연결하여 백홀 화물 밀도를 높입니다. 결과적으로 북미 국경 간 도로 화물 운송 시장은 세분화된 통관 데이터와 동적 스케줄링이 필요한 고빈도 및 저중량 화물로 빠르게 세분화되고 있습니다.
만성적인 CDL(상업용 운전면허) 운전자 및 기술자 부족
업계는 2025년을 8만 명 이상의 운전자 부족 상태로 맞이했으며, 특수한 국경 간 요건이 채용 난항을 가중시키고 있습니다. 운송사는 국경 인증 운전자에게 18-22%의 임금 프리미엄을 제공해야 하지만, 서류 지연을 피할 수 있는 국내 노선을 찾는 근로자들로 인해 이직률이 95%를 초과합니다. 기술자 부족으로 정비 주기가 길어지면서 장비 가동 중단 시간이 증가해 자산 가용성이 압박받고 있습니다. 높은 교체 비용으로 소규모 차량 운영사들은 합병 또는 시장 철수를 고려하게 되어 북미 국경 간 도로 화물 운송 시장 내 통합이 가속화되고 있습니다.
부문 분석
제조 부문은 2025년 북미 국경 간 도로 화물 운송 시장의 31.68%를 차지하며, 자동차, 전자제품, 산업 기계 부문를 아우르는 삼각 생산 네트워크의 깊이를 입증했습니다. 이 부문은 최종 조립 전 국경을 여러 번 오가는 부품으로 인해 노선 물량이 안정화되고 트레일러 활용도가 높아지는 이점을 누립니다. 제조업 화물 운송을 위한 북미 국경 간 도로 화물 운송 시장 규모는 OEM 업체들이 멕시코 기반 최종 조립을 확대하면서도 미국 및 캐나다 부품 조달을 유지함에 따라 성장할 전망입니다. 보세 야드, 야드 관리 시스템, 인증된 보안 차량 프로토콜을 보유한 운송업체들은 OEM 업체들이 엄격한 공급업체 평가 기준을 시행함에 따라 더 큰 계약을 수주하고 있습니다.
도매 및 소매 무역 부문은 2026-2031년에 걸쳐 연평균 5.07%의 가장 빠른 성장률을 기록할 전망입니다. 이는 전자상거래 플랫폼이 3개국 간 상품 카탈로그를 통합함에 따라 촉진됩니다. 주요 입국항에서 20마일 이내에 위치한 크로스독 시설은 당일 분할 하역을 효율화하여 소매업체가 약속 납기일을 준수할 수 있도록 지원합니다. 북미 국경 간 도로 화물 운송 시장은 SKU 프로필에 따라 계속 분할되면서 식료품용 온도 조절 밴과 가구용 하이큐브 트레일러 수요가 증가하고 있습니다. 농업, 석유 및 가스, 건설 등 추가 부문도 화물 다양성을 확대하여 차량 운영사가 계절적 주기와 대규모 프로젝트 일정에 맞춰 장비 구성을 조정할 기회를 제공합니다.
기타 혜택 :
- 엑셀 형식 시장 예측(ME) 시트
- 애널리스트의 3개월간 지원
자주 묻는 질문
목차
제1장 서론
- 조사의 전제조건과 시장 정의
- 조사 범위
제2장 조사 방법
제3장 주요 요약
제4장 시장 상황
- 시장 개요
- 경제 활동별 GDP 분포
- 경제활동별 GDP 성장률
- 경제적 성능과 프로파일
- 전자상거래 업계 동향
- 제조업의 동향
- 운송 및 보관 섹터의 GDP
- 물류 성능
- 도로 길이
- 수출 동향
- 수입 동향
- 연료 가격의 동향
- 트럭 운송 운영 비용
- 트럭 운송 차량 규모(유형별)
- 주요 트럭 공급업체
- 도로화물 운송량 동향
- 도로화물 운송의 가격 동향
- 운송 모드별 점유율
- 인플레이션
- 규제 프레임워크
- 밸류체인 및 유통채널 분석
- 시장 성장 촉진요인
- 근거리 아웃소싱 붐, 북미 화물 운송 경로 재편
- 전자상거래 가속화, 국경 간 LTL 물량 증가
- 연방 및 주 고속도로 재투자(IIJA, IFC 등)
- 디지털화된 Complemento Carta Porte 규정 준수가 스마트 국경 기술 채택 촉진
- 메가와트 충전 회랑이 전기 장거리 트럭 운송 실현
- 중국 경유 멕시코 중계 운송이 환태평양 지역의 변동을 상쇄
- 시장 성장 억제요인
- 만성적인 CDL 운전자 및 기술자 부족
- 디젤 가격과 통행료의 변동이 이익률을 압박
- 보안 인력 변동으로 인한 예측 불가능한 검문소 체류 시간
- TMS 사이버 보안 침해에 의한 적하 가시성 저해
- 시장에서의 기술 혁신
- Porter's Five Forces 분석
- 신규 참가업체의 위협
- 구매자의 협상력
- 공급기업의 협상력
- 대체품의 위협
- 경쟁 기업간 경쟁 관계
제5장 시장 규모와 성장 예측
- 최종 사용자 산업
- 농업, 어업, 임업
- 건설업
- 제조업
- 석유 및 가스, 광업 및 채석업
- 도매업 및 소매업
- 기타
- 국가별
- 미국
- 캐나다
- 멕시코
- 기타 북미
제6장 경쟁 구도
- 시장 집중도
- 주요 전략적 움직임
- 시장 점유율 분석
- 기업 프로파일
- Bison Transport
- CH Robinson
- Cowtown Logistics Freight Management
- CSA Transportation
- DHL Group
- EP Logistics
- Fastfrate Inc.
- Hub Group, Inc.
- Integrity Express Logistics, LLC
- JB Hunt Transport, Inc.
- Knight-Swift Transportation Holdings Inc.
- Landstar System Inc.
- Midland
- Ryder System, Inc.
- Schneider National, Inc.
- Trans International Trucking, Inc.
- Trans-Pro Logistics
- United Parcel Service of America, Inc.(UPS)
- Werner Enterprises Inc.
- XPO, Inc.
제7장 시장 기회와 장래의 전망
HBR 26.01.29The North America cross border road freight transport market is expected to grow from USD 247.6 billion in 2025 to USD 258.55 billion in 2026 and is forecast to reach USD 320.96 billion by 2031 at 4.42% CAGR over 2026-2031.
Trade integration under the United States-Mexico-Canada Agreement (USMCA) and the acceleration of nearshoring into Mexico are recalibrating freight corridors, shifting volumes from trans-Pacific lanes toward over-the-road cross-border routes that extend deep into U.S. and Canadian consumer zones. Strong manufacturing linkages, rapid e-commerce adoption, and large-scale public infrastructure programs together bolster the North America cross border road freight transport market by enlarging payload opportunities and shortening order-to-delivery cycles. Carriers that automate customs, deploy real-time visibility tools, and embed predictive analytics into border-crossing routines are outpacing conventional operators, while cybersecurity preparedness and driver recruitment remain critical capability gaps. Investments in megawatt-class charging corridors and digital Complemento Carta Porte compliance platforms further cement smart-border standards, sharpening the technology divide across the competitive field.
North America Cross Border Road Freight Transport Market Trends and Insights
Near-Shoring Boom Reshapes North America Freight Corridors
Manufacturing migration from Asia to Mexico lifted Mexican exports to the United States by 23% in 2024, anchoring heavy freight flows along I-35 and I-10 that bypass Pacific gateways. Specialized carriers now deploy dedicated fleets on these corridors, optimizing round-trip utilization between Mexican plants and U.S. distribution nodes. Northbound stability encourages infrastructure investments at Laredo, El Paso, and San Diego crossings, while U.S. Midwestern hubs receive higher volumes of intermediate components for assembly lines. In parallel, southbound shipments of raw materials create balanced lane density that fortifies asset returns. These structural shifts are embedding permanent trade lanes that underpin long-run expansion of the North America cross border road freight transport market.
E-commerce Acceleration Lifts Cross-Border LTL Volumes
Cross-border e-commerce spending reached CAD 26.1 billion (USD 19.2 billion) in 2024, with 31% tied to U.S. retailers shipping into Canada. The proliferation of small-parcel flows fuels demand for consolidation gateways close to border zones. LTL carriers equipped with automated sortation, broker-of-record services, and tariff optimization engines now capture premium premiums for two-day cross-border delivery. Growth of omnichannel models further links retail storefront replenishment with return-to-vendor loops, adding backhaul cargo density. Consequently, the North America cross border road freight transport market is experiencing rapid segmentation toward higher-frequency, lower-weight consignments that require granular customs data and dynamic scheduling.
Chronic CDL Driver and Technician Gap
The industry entered 2025 with an 80,000+ driver shortfall, and specialized cross-border requirements compound recruitment difficulty. Carriers must offer 18-22% wage premiums for border-certified drivers, yet turnover exceeds 95% as workers chase domestic lanes that avoid documentation delays. Equipment downtime rises as technician shortages lengthen maintenance cycles, squeezing asset availability. High replacement costs drive smaller fleets to consider mergers or exit, accelerating consolidation within the North America cross border road freight transport market.
Other drivers and restraints analyzed in the detailed report include:
- Federal and Provincial Highway Reinvestment
- Digitized Complemento Carta Porte Compliance Drives Adoption of Smart-border Tech
- Diesel-Price and Toll Volatility Compress Margins
For complete list of drivers and restraints, kindly check the Table Of Contents.
Segment Analysis
Manufacturing captured 31.68% of the North America cross border road freight transport market in 2025, underlining the depth of trilateral production networks spanning automotive, electronics, and industrial machinery. This segment benefits from components that cross borders multiple times before final assembly, stabilizing lane volumes and enabling high trailer utilization. The North America cross border road freight transport market size for manufacturing shipments is set to expand as OEMs ramp up Mexico-based final assembly while retaining U.S. and Canadian component sourcing. Carriers with bonded yards, yard-management systems, and certified secure fleet protocols win larger contracts as OEMs enforce stringent vendor scorecards.
Wholesale and retail trade posts the fastest growth at a 5.07% CAGR between 2026-2031, fueled by e-commerce platforms harmonizing catalog offerings across the three countries. Cross-dock facilities positioned within 20 miles of primary ports of entry streamline same-day deconsolidation, enabling retailers to hit promise-date metrics. The North America cross border road freight transport market continues to fragment across SKU profiles, heightening demand for temperature-controlled vans for grocery and high-cube trailers for home-furnishings. Additional segments such as agriculture, oil and gas, and construction also broaden cargo diversity, giving fleets opportunities to calibrate equipment mixes against seasonal cycles and mega-project timelines.
The North America Cross Border Road Freight Transport Market Report is Segmented by End User Industry (Agriculture, Fishing, and Forestry, Construction, Manufacturing, Oil and Gas, Mining and Quarrying, Wholesale and Retail Trade, and Others), and Country (Canada, Mexico, United States, Rest of North America). The Market Forecasts are Provided in Terms of Value (USD).
List of Companies Covered in this Report:
- Bison Transport
- C.H. Robinson
- Cowtown Logistics Freight Management
- CSA Transportation
- DHL Group
- EP Logistics
- Fastfrate Inc.
- Hub Group, Inc.
- Integrity Express Logistics, LLC
- J.B. Hunt Transport, Inc.
- Knight-Swift Transportation Holdings Inc.
- Landstar System Inc.
- Midland
- Ryder System, Inc.
- Schneider National, Inc.
- Trans International Trucking, Inc.
- Trans-Pro Logistics
- United Parcel Service of America, Inc. (UPS)
- Werner Enterprises Inc.
- XPO, Inc.
Additional Benefits:
- The market estimate (ME) sheet in Excel format
- 3 months of analyst support
TABLE OF CONTENTS
1 Introduction
- 1.1 Study Assumptions and Market Definition
- 1.2 Scope of the Study
2 Research Methodology
3 Executive Summary
4 Market Landscape
- 4.1 Market Overview
- 4.2 GDP Distribution by Economic Activity
- 4.3 GDP Growth by Economic Activity
- 4.4 Economic Performance and Profile
- 4.4.1 Trends in E-Commerce Industry
- 4.4.2 Trends in Manufacturing Industry
- 4.5 Transport and Storage Sector GDP
- 4.6 Logistics Performance
- 4.7 Length of Roads
- 4.8 Export Trends
- 4.9 Import Trends
- 4.10 Fuel Pricing Trends
- 4.11 Trucking Operational Costs
- 4.12 Trucking Fleet Size by Type
- 4.13 Major Truck Suppliers
- 4.14 Road Freight Tonnage Trends
- 4.15 Road Freight Pricing Trends
- 4.16 Modal Share
- 4.17 Inflation
- 4.18 Regulatory Framework
- 4.19 Value Chain and Distribution Channel Analysis
- 4.20 Market Drivers
- 4.20.1 Near-Shoring Boom Reshapes N-America Freight Corridors
- 4.20.2 E-Commerce Acceleration Lifts Cross-Border LTL Volumes
- 4.20.3 Federal and Provincial Highway Reinvestment (IIJA, IFC, etc.)
- 4.20.4 Digitised Complemento Carta Porte Compliance Drives Adoption of Smart-Border Tech
- 4.20.5 Megawatt Charging Corridors Unlock Electric Long-Haul Trucking
- 4.20.6 China-via-Mexico Trans-Shipment Offsets Trans-Pacific Volatility
- 4.21 Market Restraints
- 4.21.1 Chronic CDL Driver and Technician Gap
- 4.21.2 Diesel-Price and Toll Volatility Compress Margins
- 4.21.3 Security Staffing Waves Create Unpredictable Checkpoint Dwell
- 4.21.4 TMS Cybersecurity Breaches Interrupt Load Visibility
- 4.22 Technology Innovations in the Market
- 4.23 Porter's Five Forces Analysis
- 4.23.1 Threat of New Entrants
- 4.23.2 Bargaining Power of Buyers
- 4.23.3 Bargaining Power of Suppliers
- 4.23.4 Threat of Substitutes
- 4.23.5 Competitive Rivalry
5 Market Size and Growth Forecasts (Value, USD)
- 5.1 End User Industry
- 5.1.1 Agriculture, Fishing, and Forestry
- 5.1.2 Construction
- 5.1.3 Manufacturing
- 5.1.4 Oil and Gas, Mining and Quarrying
- 5.1.5 Wholesale and Retail Trade
- 5.1.6 Others
- 5.2 Country
- 5.2.1 United States
- 5.2.2 Canada
- 5.2.3 Mexico
- 5.2.4 Rest of North America
6 Competitive Landscape
- 6.1 Market Concentration
- 6.2 Key Strategic Moves
- 6.3 Market Share Analysis
- 6.4 Company Profiles (Includes Global Level Overview, Market Level Overview, Core Segments, Financials as Available, Strategic Information, Market Rank/Share for Key Companies, Products and Services, and Recent Developments)
- 6.4.1 Bison Transport
- 6.4.2 C.H. Robinson
- 6.4.3 Cowtown Logistics Freight Management
- 6.4.4 CSA Transportation
- 6.4.5 DHL Group
- 6.4.6 EP Logistics
- 6.4.7 Fastfrate Inc.
- 6.4.8 Hub Group, Inc.
- 6.4.9 Integrity Express Logistics, LLC
- 6.4.10 J.B. Hunt Transport, Inc.
- 6.4.11 Knight-Swift Transportation Holdings Inc.
- 6.4.12 Landstar System Inc.
- 6.4.13 Midland
- 6.4.14 Ryder System, Inc.
- 6.4.15 Schneider National, Inc.
- 6.4.16 Trans International Trucking, Inc.
- 6.4.17 Trans-Pro Logistics
- 6.4.18 United Parcel Service of America, Inc. (UPS)
- 6.4.19 Werner Enterprises Inc.
- 6.4.20 XPO, Inc.
7 Market Opportunities and Future Outlook
- 7.1 White-Space and Unmet-Need Assessment