


|
시장보고서
상품코드
1693411
아시아태평양의 폴리우레탄 접착제 시장 : 점유율 분석, 산업 동향 및 통계, 성장 예측(2025-2030년)Asia-Pacific Polyurethane Adhesives - Market Share Analysis, Industry Trends & Statistics, Growth Forecasts (2025 - 2030) |
||||||
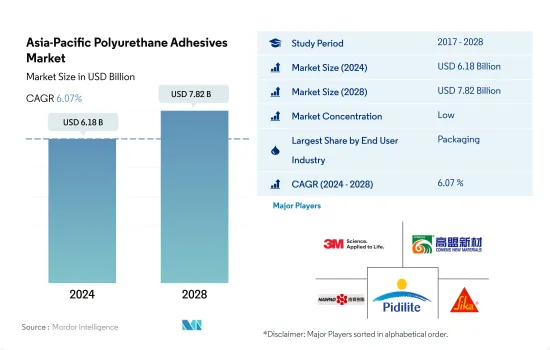
아시아태평양의 폴리우레탄 접착제 시장 규모는 2024년 61억 8,000만 달러로 추정되어 예측 기간 중(2024-2028년) CAGR 6.07%로 성장하고, 2028년에는 78억 2,000만 달러에 달할 것으로 예측됩니다.
중국의 신흥 자동차 시장과 포장 최종 용도 부문이 아시아태평양의 폴리 우레탄 접착제 소비를 밀어 올 전망
- 폴리우레탄 접착제는 포장 산업에서 널리 사용되고 있습니다.
- 폴리우레탄 접착제는 양호한 응집성, 접착성, 탄성, 높은 응집 강도, 유연성, 기재의 높은 탄성률을 제공하기 위해 건축 및 건설 산업이 아시아태평양 폴리우레탄 접착제 시장의 주요 점유율을 차지하고 있습니다. 중국은 아시아태평양에서 가장 급성장하고 있는 국가이며 2022년부터 2028년 사이 CAGR 5%를 나타낼 것으로 예상되고 있습니다.
- 폴리우레탄 접착제는 자동차 용도에 널리 사용되고 있습니다.아시아 시장에 있어서의 전동 사륜차의 채용은 향후도 중요한 위치를 차지할 것으로 예상됩니다. 중국이 최대의 EV 시장이 될 것으로 예상됩니다.
건설, 포장, 자동차 산업 증가가 폴리우레탄 접착제 수요를 앞으로 밀어올 가능성
- 2017년부터 2021년까지, 폴리우레탄 접착제 수요는 모든 지역 중 아시아태평양이 가장 높았습니다. 이 지역의 접착제 수요 점유율은, 모든 최종 사용자 산업의 제조 능력이 높기 때문에 세계 수요의 46-47%를 일관되게 차지하고 있습니다.
- 2017년부터 2019년까지 이 지역의 접착제 수요는 CAGR 0.79%를 기록했습니다.
- 2020년에는 운영, 노동력, 원료, 공급망 및 기타 분야의 제약으로 인해 지역 전체의 모든 최종 사용자 산업 수요가 감소했습니다. 호주의 신발 산업은 가장 큰 타격을 받고 수량 기준으로 전년대비 49.53% 감소했습니다.
- 2021년에는 규제가 완화되었고, 폴리우레탄 접착제 수요는 급속히 팬데믹 전 수요량으로 회복되었습니다.
아시아태평양 폴리우레탄 접착제 시장 동향
개발 도상국에서 전자상거래 산업의 급성장으로 산업 확대
- 포장은 주로 보호, 봉쇄, 정보 제공, 실용성, 판매 촉진에 사용됩니다. 따라서 포장은 대부분의 산업에 필수적인 요소입니다. 2020년에는 COVID-19의 대유행으로 공급망의 혼란, 포장자재 부족, 상품 수출입 제한, 공장 저능력 조업 등으로 시장은 7.4%의 마이너스 성장률을 기록했습니다.
- 중국과 인도네시아는 해양 플라스틱 폐기물의 제1위와 제2위의 배출국이기 때문에 아시아 각국의 정부는 플라스틱의 사용을 삭감하기 위한 조치를 강구하고 있습니다.
- 2021년 시장은 8%의 플러스 성장을 기록했으며, 27억톤의 포장재료가 다양한 목적으로 사용되었습니다. 상품의 출하에는 특수한 포장이 필요하기 때문에 최근 몇 년간 포장 산업을 크게 뒷받침하고 있습니다.
인프라 활동 확대를 위한 투자 증가로 업계 규모 확대
- 아시아태평양은 중국, 일본, 인도 등 세계의 주요 경제국에 의해 견인되고 있습니다. 도시화의 진전으로 도시에서 필요로 하는 거주 공간이 증가해, 도시의 중간 소득층이 생활 환경의 개선을 바라게 되는 것으로, 주택 시장에 영향을 주어, 그것에 의해 국내의 주택 건설이 증가할 가능성이 있습니다.
- 비주택 인프라는 크게 확대될 가능성이 높습니다. 중국은 세계 최대의 건설 시장을 보유하고 있으며, 전 세계 건설 투자의 20%를 차지하고 있습니다. 2030년까지 정부는 13조 달러를 넘는 건설 투자를 계획하고 있습니다.
- 건설 산업은 아시아태평양 최대의 산업 중 하나이며, 2019년에는 유망한 성장을 기록했습니다. 하지만 계속 COVID-19 팬데믹을 위해, 건설 부문은 인도, 중국, 일본, ASEAN 국가를 포함한 개발 도상국에 심각한 영향을 미친 지역 전체의 정부에 의한 락다운 때문에 크게 감소했습니다.
- 아시아태평양에서도 건설 분야에 대한 해외 투자자의 관심이 높아지고 있습니다.
아시아태평양 폴리우레탄 접착제 산업 개요
아시아태평양 폴리우레탄 접착제 시장은 단편화되어 주요 5개사에서 11.98%를 차지하고 있습니다.이 시장 주요 기업은 3M, Beijing Comens New Materials, NANPAO RESINS CHEMICAL GROUP, Pidilite Industries Ltd., Sika AG(알파벳순)가 있습니다.
기타 혜택
- 엑셀 형식 시장 예측(ME) 시트
- 3개월의 애널리스트 서포트
목차
제1장 주요 요약과 주요 조사 결과
제2장 보고서 제안
제3장 소개
- 조사의 전제조건과 시장 정의
- 조사 범위
- 조사 방법
제4장 주요 산업 동향
- 최종 사용자 동향
- 항공우주
- 자동차
- 건축 및 건설
- 신발 및 가죽
- 포장
- 목공 및 건구
- 규제 프레임워크
- 호주
- 중국
- 인도
- 인도네시아
- 일본
- 말레이시아
- 싱가포르
- 한국
- 태국
- 밸류체인과 유통채널 분석
제5장 시장 세분화
- 최종 사용자 산업
- 항공우주
- 자동차
- 건축 및 건설
- 신발 및 가죽
- 헬스케어
- 포장
- 목공 및 건구
- 기타 최종 사용자 산업
- 기술
- 핫멜트
- 반응성
- 용제계
- UV 경화형 접착제
- 수계
- 국가명
- 호주
- 중국
- 인도
- 인도네시아
- 일본
- 말레이시아
- 싱가포르
- 한국
- 태국
- 기타 아시아태평양
제6장 경쟁 구도
- 주요 전략 동향
- 시장 점유율 분석
- 기업 상황
- 기업 프로파일.
- 3M
- Beijing Comens New Materials Co., Ltd.
- HB Fuller Company
- Henkel AG & Co. KGaA
- Hubei Huitian New Materials Co. Ltd
- Huntsman International LLC
- Kangda New Materials(Group) Co., Ltd.
- NANPAO RESINS CHEMICAL GROUP
- Pidilite Industries Ltd.
- Sika AG
제7장 CEO에 대한 주요 전략적 질문
제8장 부록
- 세계의 접착제 및 실링제 산업의 개요
- 개요
- Porter's Five Forces 분석 프레임워크(산업 매력도 분석)
- 세계의 밸류체인 분석
- 성장 촉진요인, 저해요인, 기회
- 정보원과 참고문헌
- 도표 일람
- 주요 인사이트
- 데이터 팩
- 용어집
The Asia-Pacific Polyurethane Adhesives Market size is estimated at 6.18 billion USD in 2024, and is expected to reach 7.82 billion USD by 2028, growing at a CAGR of 6.07% during the forecast period (2024-2028).

Emerging automotive market in China and packaging end-use sector expected to boost the consumption of polyurethane adhesives in Asia-Pacific
- Polyurethane adhesives are widely used in the packaging industry. Polyurethane adhesives are used in food and beverage packaging, container packaging, end-of-line packaging for functional barrier applications, and metal packaging. The usage of polyurethane adhesive has been rising in packaging applications and registered growth rates of 4.76% and 2.2% in 2018 and 2019, respectively.
- The building and construction industry occupies a major share of the Asia-Pacific polyurethane adhesives market as polyurethane adhesives offer good cohesion, adhesion, and elasticity, high cohesive strength, flexibility, and a high elastic modulus of the substrate. China is the fastest-growing country in the Asia-Pacific region and is expected to register a CAGR of 5% during the period 2022 to 2028 in terms of consumption of polyurethane construction adhesives. The country recorded the highest demand for polyurethane construction adhesives owing to rising construction output, which amounted to USD 4.6 trillion in 2021, with a 10% growth over the previous year.
- Polyurethane adhesives are widely used in automotive applications. The adoption of electric four-wheelers in Asian markets will continue to be significant. In absolute terms, China is expected to become the largest EV market. On its current trajectory, China's adoption rate will approach 60%, and the country will account for more than 40% of global new EV sales by 2030, thus, boosting the demand for polyurethane automotive adhesives in the forecast period. Polyurethane adhesives are used in the healthcare industry for applications such as assembling medical device parts. The increase in healthcare investments across the Asia-Pacific region is expected to increase the demand for polyurethane adhesives in the forecast period.
Rising construction, packaging, and automotive industries likely to propel the demand for polyurethane adhesives in the future
- From 2017 to 2021, the demand for polyurethane adhesives was the highest in Asia-Pacific among all regions. The share of adhesive demand from this region has consistently occupied 46-47% of the global demand because of the region's high manufacturing capacity of all end-user industries. Polyurethane adhesives with hot melt, water-borne, and solvent-borne technologies account for the highest demand in the region.
- From 2017 to 2019, the demand for adhesives from this region recorded a CAGR of 0.79%. The slow growth in the demand for polyurethane adhesives was due to a decrease in construction activities and automotive production in the region. The demand from these end-user industries declined with a CAGR of -2.4% and -2.25% in 2018 and 2019, respectively, during this period.
- In 2020, the demand from all end-user industries across the region declined due to constraints in operations, labor, raw material, supply chain, and other areas. Among all industries across all the countries in the region, the footwear industry in Australia took the worst hit, declining by 49.53% Y-o-Y in volume terms. The decrease in domestic demand because of low purchasing power resulting from a weak economy severely affected this industry during the pandemic.
- In 2021, the demand for polyurethane adhesives quickly rebounded to the pre-pandemic demand volumes as restrictions eased. The demand from India witnessed the highest Y-o-Y growth of 73.82% in volume terms. The overall demand from the Asia-Pacific region is expected to record a CAGR of 4.46% during the forecast period. This demand growth is expected to be driven by the region's construction, packaging, and automotive industries during the forecast period.
Asia-Pacific Polyurethane Adhesives Market Trends
Fast paced growth of e-commerce industry in developing nations to augment the industry
- Packaging is mainly used for protection, containment, information, utility, and promotion. This makes packaging an integral part of most industries. In 2017, packaging usage accounted for 2.5 billion ton of packaging, including paper and paperboard and plastic packaging. In 2020, due to the COVID-19 pandemic, the market registered a negative growth rate of 7.4% due to disruptions in the supply chain, shortage of packaging material, restrictions on the import and export of goods, and factories operating at low capacity.
- Governments of different Asian countries have taken steps to reduce the use of plastic, as China and Indonesia are the first and second-largest contributors to plastic waste in the ocean. China has announced new restrictions on excessive packaging, requiring all food and cosmetics producers to adhere to specific guidelines determining the volume of packaging allowed in proportion to a product. The extended producer responsibility (EPR) regulation imposed by the Indonesian government will oblige producers and retailers to redesign their product packaging to include a higher proportion of recyclable material.
- In 2021, the market registered a positive growth of 8%, with 2.7 billion ton of packaging material used for various purposes. The packaging industry is expected to keep growing due to the rising middle-income population, improvement of supply chains, and rising e-commerce activities, which have significantly boosted the packaging industry in the past few years as special packaging is required for shipping goods. The growing Asian market is expected to boost packaging usage, enabling it to register a CAGR of 5.7% during the forecast period (2022-2028).
Raising investment to expand infrastructural activities will augment the industry size
- Asia-Pacific is driven by the world's major economies, such as China, Japan, and India. China is promoting and undergoing a process of continuous urbanization, with a target rate of 70% for 2030. The increased living spaces required in the urban areas resulting from increasing urbanization and the desire of middle-income urban residents to improve their living conditions may impact the housing market and, thereby, increase the residential constructions in the country.
- Non-residential infrastructure is likely to expand significantly. The Chinese government approved 26 infrastructure projects worth approximately USD 142 billion in 2019, with completion due in 2023. The country has the largest construction market globally, accounting for 20% of all worldwide construction investments. By 2030, the government plans to spend over USD 13 trillion on construction. Thus, the construction market is expected to register a 4.48% CAGR during the forecast period (2022-2028).
- The construction industry is one of the largest industries in Asia-Pacific and recorded promising growth in 2019. The industry continues to grow as the region constitutes many developing countries such as Vietnam, Malaysia, Indonesia, Thailand, and other South Asian countries. However, due to the COVID-19 pandemic, the construction sector witnessed a significant decline owing to lockdowns by governments across the region, which severely affected developing countries, including India, China, Japan, and ASEAN countries.
- The Asia-Pacific region is also witnessing significant interest from international investors in the construction space. Foreign Direct Investment (FDI) in the construction development sector is increasing as developing countries provide better returns and opportunities for investors.
Asia-Pacific Polyurethane Adhesives Industry Overview
The Asia-Pacific Polyurethane Adhesives Market is fragmented, with the top five companies occupying 11.98%. The major players in this market are 3M, Beijing Comens New Materials Co., Ltd., NANPAO RESINS CHEMICAL GROUP, Pidilite Industries Ltd. and Sika AG (sorted alphabetically).
Additional Benefits:
- The market estimate (ME) sheet in Excel format
- 3 months of analyst support
TABLE OF CONTENTS
1 EXECUTIVE SUMMARY & KEY FINDINGS
2 REPORT OFFERS
3 INTRODUCTION
- 3.1 Study Assumptions & Market Definition
- 3.2 Scope of the Study
- 3.3 Research Methodology
4 KEY INDUSTRY TRENDS
- 4.1 End User Trends
- 4.1.1 Aerospace
- 4.1.2 Automotive
- 4.1.3 Building and Construction
- 4.1.4 Footwear and Leather
- 4.1.5 Packaging
- 4.1.6 Woodworking and Joinery
- 4.2 Regulatory Framework
- 4.2.1 Australia
- 4.2.2 China
- 4.2.3 India
- 4.2.4 Indonesia
- 4.2.5 Japan
- 4.2.6 Malaysia
- 4.2.7 Singapore
- 4.2.8 South Korea
- 4.2.9 Thailand
- 4.3 Value Chain & Distribution Channel Analysis
5 MARKET SEGMENTATION (includes market size in Value in USD and Volume, Forecasts up to 2028 and analysis of growth prospects)
- 5.1 End User Industry
- 5.1.1 Aerospace
- 5.1.2 Automotive
- 5.1.3 Building and Construction
- 5.1.4 Footwear and Leather
- 5.1.5 Healthcare
- 5.1.6 Packaging
- 5.1.7 Woodworking and Joinery
- 5.1.8 Other End-user Industries
- 5.2 Technology
- 5.2.1 Hot Melt
- 5.2.2 Reactive
- 5.2.3 Solvent-borne
- 5.2.4 UV Cured Adhesives
- 5.2.5 Water-borne
- 5.3 Country
- 5.3.1 Australia
- 5.3.2 China
- 5.3.3 India
- 5.3.4 Indonesia
- 5.3.5 Japan
- 5.3.6 Malaysia
- 5.3.7 Singapore
- 5.3.8 South Korea
- 5.3.9 Thailand
- 5.3.10 Rest of Asia-Pacific
6 COMPETITIVE LANDSCAPE
- 6.1 Key Strategic Moves
- 6.2 Market Share Analysis
- 6.3 Company Landscape
- 6.4 Company Profiles (includes Global Level Overview, Market Level Overview, Core Business Segments, Financials, Headcount, Key Information, Market Rank, Market Share, Products and Services, and Analysis of Recent Developments).
- 6.4.1 3M
- 6.4.2 Beijing Comens New Materials Co., Ltd.
- 6.4.3 H.B. Fuller Company
- 6.4.4 Henkel AG & Co. KGaA
- 6.4.5 Hubei Huitian New Materials Co. Ltd
- 6.4.6 Huntsman International LLC
- 6.4.7 Kangda New Materials (Group) Co., Ltd.
- 6.4.8 NANPAO RESINS CHEMICAL GROUP
- 6.4.9 Pidilite Industries Ltd.
- 6.4.10 Sika AG
7 KEY STRATEGIC QUESTIONS FOR ADHESIVES AND SEALANTS CEOS
8 APPENDIX
- 8.1 Global Adhesives and Sealants Industry Overview
- 8.1.1 Overview
- 8.1.2 Porter's Five Forces Framework (Industry Attractiveness Analysis)
- 8.1.3 Global Value Chain Analysis
- 8.1.4 Drivers, Restraints, and Opportunities
- 8.2 Sources & References
- 8.3 List of Tables & Figures
- 8.4 Primary Insights
- 8.5 Data Pack
- 8.6 Glossary of Terms
