|
시장보고서
상품코드
1850987
3PL 시장 : 점유율 분석, 산업 동향, 통계, 성장 예측(2025-2030년)3PL - Market Share Analysis, Industry Trends & Statistics, Growth Forecasts (2025 - 2030) |
||||||
3PL 시장 규모는 2025년에 1조 1,500억 달러, 2030년에는 1조 4,800억 달러에 이를 것으로 예측됩니다.

현재 수익의 거의 55%는 차량이나 창고를 소유하는 대신 파트너를 통해 네트워크를 구성하는 자산 라이트 제공업체가 차지합니다. 이 모델은 자본 위험을 줄이고 무역 흐름이 흔들릴 때 운영자가 용량을 유연하게 조정할 수 있습니다. 아시아태평양은 전자상거래의 확대와 인도, 베트남, 인도네시아로의 생산 이동에 힘입어 세계 3PL 시장의 41.3%를 차지하고 있습니다. 실시간 시각화, 디지털 운임 매칭, 창고 자동화를 통합한 프로바이더는 스피드와 코스트면에서 우위에 서서, 스피드의 느린 라이벌은 굉장히 치를 수 없습니다. 멕시코의 니어 쇼어링, 유럽에서의 친환경 물류의 의무화, 북미의 생명 과학에 특화된 흐름이 서비스 요건을 엄격화하고, 이 섹터를 계약 기간의 단축과 데이터 풍부한 플랫폼에 대한 투자 강화로 끌어 올리고 있습니다.
세계 3PL 시장 동향과 통찰
전자상거래 규모 확대로 당일 풀필먼트 가속
신흥국의 온라인 소매는 급성장하고 있으며, 구매자는 며칠이 아닌 몇 시간 안에 배달을 원합니다. 공급자는 밀집된 인근 지역에 하이퍼로컬 허브를 설치하고, 라인홀의 거리를 단축하고, 배송 밀도를 높임으로써 대응하고 있습니다. 이러한 변화로 인해 3PL 시장의 사업자는 루트 계획 엔진을 미세 조정하고, 혼잡한 도로용으로 이륜차를 늘리고, 실시간 슬롯 스케줄링이 가능한 클라우드 수주 관리를 채택하지 않을 수 없게 됩니다. 특별한 부동산 신탁은 도시의 작은 구획을 셔틀 시스템과 협동 로봇을 갖춘 다층의 마이크로 플루필먼트 사이트로 바꾸고 있습니다.
국경을 넘어 셔틀화물을 생산하는 OEM의 니어 쇼어링 전략
2022년부터 2023년까지 멕시코는 중국을 제치고 미국에서 가장 큰 무역 상대국이 되어 4,756억 달러의 화물을 취급하고 매달 약 2만 900대의 적재 트럭이 달리고 있습니다. 몬테레이 근교와 바히오 회랑을 따라 새로운 공업 단지가 건설 중이며, 2025년 이후에도 화물 수송 창구는 계속 열릴 것으로 보입니다. 셔틀 레인(공급자 공장과 미국의 배송 센터를 연결하는 짧고 빈번한 루프)은 현재 국경 양측의 전용 트랙터, 트레일러, 드레이 서비스의 연간 계약을 지원하고 있습니다. 3PL 시장의 지도자는 이중 언어 관제탑, 실시간 국경 대기 추적, 듀얼 컴플라이언스 통관 중개를 추가하여 체류 시간을 단축하고 있습니다. 철도와 트럭의 복합 일관 운송 조합도 증가하고 있으며, 1회당 CO2 배출량을 줄이고 예측 가능한 운송 일정을 고정화하고 있습니다.
항만 혼잡으로 인한 비용 변동
주요 게이트웨이의 체화는 해상 스포트 레이트와 섀시 유치료에 큰 변동을 초래합니다. 화주는 현재 다년계약이 아니라 분기별 계약을 선호하고 있으며 항구의 혼잡이 해소되었을 때에도 대응할 수 있는 여지를 남기고 있습니다. 3PL 마켓 프로바이더는 내륙의 오버플로 야드 공간을 확보하고 화물을 같은 날에 철도로 적재하기 위한 팝업 트랜스로드 사이트를 배치함으로써 헤지하고 있습니다. 터미널 운영 체제의 실시간 데이터 피드는 동적 슬롯 예약을 유도하여 컨테이너가 휠 준비가 된 경우에만 트랙이 도착하도록합니다.
부문 분석
국내 운송 관리는 2024년 3PL 시장 규모의 45%(약 5,220억 달러)를 차지하며, 2030년까지 매년 5.9%의 성장이 예측되고 있습니다. 앱 기반 화물 플랫폼은 실시간 가격을 입찰 엔진에 공급하고 1차 검수율을 높이고 엠프티 마일리지 비율을 줄입니다. 전자상거래의 당일 배송 경로와 지역화된 마이크로 프루필먼트 실적의 개시에 의해 포인트-투-포인트의 라인홀이나 국경내의 밀크란 집하 수요가 높아지고 있습니다.
3PL 시장에서는 지정학적 위험과 불안정한 해상 스케줄이 계획을 복잡하게 하기 때문에 국제 운송 관리도 성장하고 있습니다. 부가가치형 창고 및 유통은 재고의 분산화로부터 이익을 얻습니다. 소매업체는 재고를 고객 그룹 근처에 놓기 때문에 사업자는 고밀도 셔틀 랙과 현장 반품 처리 라인이있는 건물을 개조해야합니다. 도로는 여전히 지배적인 운송 수단이지만, 인터모달 철도는 신뢰성이 트럭 운송에 필적하는 900킬로미터 이상의 레인에서 점유율을 얻고 있습니다.
지역 분석
아시아태평양은 3PL 시장 매출의 41.3%를 차지했고, CAGR은 지역 최고 6.0%로 성장을 지속하고 있습니다. 제조 거점은 중국 이외에도 다양화를 계속하고 있으며, 호치민시에서 방콕, 그리고 심해항으로 이어지는 복합 일관 수송의 회랑이 형성되고 있습니다. 싱가포르의 디지털 통관 플랫폼은 통관 시간을 2시간 미만으로 단축하고 인도네시아의 전자상거래 소포량은 2022년 이후 3배로 증가하고 있으며 새로운 자동 분류 센터가 필요합니다. 일본의 그린포트 계획에 따른 자본 프로젝트는 콜드체인 버스 공간을 추가하여 백신 페이로드의 직접 수입을 가능하게 합니다.
북미는 3PL 시장 규모에서 2위이며 니어 쇼어링에 의해 재형성되고 있습니다. 텍사스 주 라레도는 현재 사바나 항구보다 더 많은 창고 재고를 보유하고 있습니다. 단거리 운송 인터모달 체인은 빈 섀시 운송을 줄이고 CPKC 네트워크를 통한 통일 철도 서비스는 단일 구간 교통을 하루 종일 단축합니다. 운전자 부족으로 플릿은 슬립시트 스케줄링과 원격조작가능한 야드 트랙터로 이동하여 노동시간을 절약하면서 자산 회전율을 높이고 있습니다.
유럽의 3PL 시장은 확대된 EU 배출량 거래 제도 하에서 배출 비용과 격투하고 있습니다. 해운회사는 2025년 선박 출하량의 70%를 커버하는 배출 프레임을 구입해야 하며, 전기 기관차가 제로 방출을 구하는 근해 항로에서는 화물을 해상에서 철도로 이행하게 됩니다. FuelEU Maritime 규제와 ReFuelEU Aviation 규제는 더욱 규율을 강화하고 저탄소 연료 혼합을 운송 회사에 강제합니다. 인증된 감축량을 문서화한 공급자는 기후 변화에 관한 정보 공개 준수를 강요받는 브랜드와의 계약을 확보할 수 있습니다.
기타 혜택 :
- 엑셀 형식 시장 예측(ME) 시트
- 3개월의 애널리스트 서포트
목차
제1장 서론
- 조사의 전제조건과 시장의 정의
- 조사 범위
제2장 조사 방법
제3장 주요 요약
제4장 시장 상황
- 시장 개요
- 시장 성장 촉진요인
- 전자상거래 확대로 신흥국가의 당일 배송 수요가 가속
- OEM 니어 쇼어링 전략이 북미에 있어서의 국경 간 셔틀 화물 수송의 기회를 창출
- 선진국에서의 의약품 콜드체인의 아웃소싱 급증
- 정부의 친환경 물류 규제(예: EU Fit-for-55)가 탄소 중립 솔루션 수요 증가
- 하이테크 섹터의 멀티 테넌트 DC를 필요로 하는 D2C(Direct-to-Consumer) 모델로의 전환
- 옴니채널 식료품점의 대두가 도시에서의 마이크로 풀필먼트 계약을 추진
- 시장 성장 억제요인
- 항만 혼잡에 의한 비용 변동이 계약 기간을 단축
- 영업 마진을 부풀리는 OECD 경제의 운전자 및 창고 노동력 부족
- 3PL 마진을 압박하는 티어 1 물류 허브의 치솟는 산업용 부동산 비용
- 국경 간 데이터 거주 규칙이 클라우드 WMS의 전개를 제한
- 가치/공급망 분석
- 기술 스냅샷(IoT, AI 등)
- 주요 정부 규제와 대처
- 전자상거래 사업에 대한 통찰
- 창고 시장 동향
- 수요 동향 분석(CEP, 라스트 마일, 콜드체인 등)
- Porter's Five Forces
- 신규 참가업체의 위협
- 구매자의 협상력
- 공급기업의 협상력
- 대체품의 위협
- 경쟁 기업간 경쟁 관계
- 지정학적 이벤트가 시장에 미치는 영향
제5장 시장 규모와 성장 예측
- 서비스별
- 국내 운송 관리(DTM)
- 도로
- 철도
- 항공
- 수로
- 국제운송관리(ITM)
- 도로
- 철도
- 항공
- 수로
- 부가가치 창고 및 유통(VAWD)
- 국내 운송 관리(DTM)
- 최종 사용자별
- 자동차
- 에너지 및 유틸리티
- 제조업
- 생명과학과 헬스케어
- 테크놀로지와 일렉트로닉스
- 소매업 및 전자상거래
- 소비재 및 FMCG
- 식음료
- 기타
- 물류 모델별
- 자산 라이트(관리 기반)
- 자산 중시(자사의 함대와 창고를 소유)
- 하이브리드
- 지역별
- 북미
- 미국
- 캐나다
- 멕시코
- 남미
- 브라질
- 아르헨티나
- 칠레
- 기타 남미
- 유럽
- 독일
- 영국
- 프랑스
- 스페인
- 이탈리아
- 네덜란드
- 러시아
- 기타 유럽
- 아시아태평양
- 중국
- 인도
- 일본
- 한국
- 싱가포르
- 베트남
- 인도네시아
- 호주
- 기타 아시아태평양
- 중동
- 아랍에미리트(UAE)
- 사우디아라비아
- 튀르키예
- 이스라엘
- 기타 중동
- 아프리카
- 남아프리카
- 이집트
- 나이지리아
- 케냐
- 기타 아프리카
- 북미
제6장 경쟁 구도
- 전략적 동향
- 시장 점유율 분석
- 기업 프로파일
- DHL Supply Chain and Global Forwarding
- Kuehne Nagel International AG
- GXO Logistics
- CH Robinson Worldwide Inc.
- DSV A/S
- Nippon Express Holdings
- Sinotrans Ltd.
- CEVA Logistics(CMA CGM)
- XPO Logistics Inc.
- FedEx Logistics
- UPS Supply Chain Solutions
- GEODIS
- Kerry Logistics Network
- Yusen Logistics(NYK)
- Hitachi Transport System(LOGISTEED)
- JB Hunt Transport Services Inc.
- CJ Logistics
- 삼성SDS
- Americold Logistics LLC
- Penske Logistics
- Expeditors
제7장 시장 기회와 장래의 전망
SHW 25.11.11The 3PL market size is valued at USD 1.15 trillion in 2025 and is forecast to climb to USD 1.48 trillion by 2030, delivering a steady 5.18% CAGR over the period.
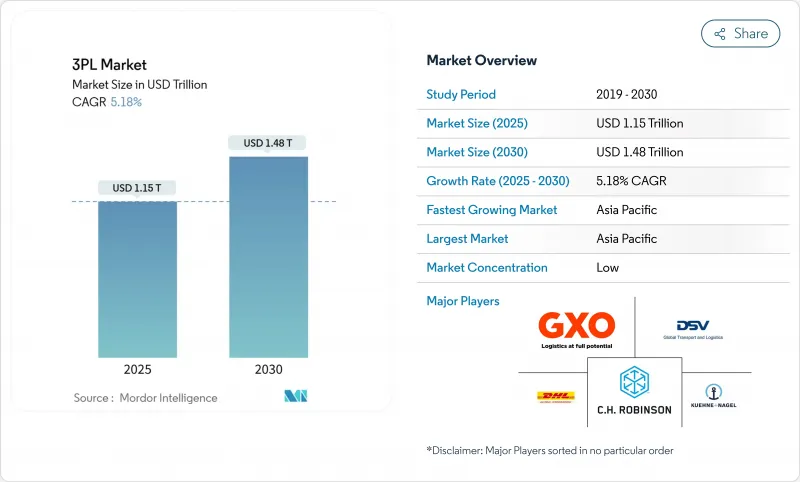
Close to 55% of current revenue sits with asset-light providers that orchestrate networks through partners rather than owning fleets or warehouses. This model reduces capital risk and lets operators flex capacity when trade flows swing. Asia-Pacific anchors the global 3PL market with 41.3% of revenue, propelled by e-commerce expansion and outward shifts in manufacturing that draw production to India, Vietnam, and Indonesia. Technology remains the decisive lever: providers that integrate real-time visibility, digital freight matching, and warehouse automation gain speed and cost advantages hard for slower rivals to match. Near-shoring into Mexico, green logistics mandates in Europe, and specialized life-science flows in North America together tighten service requirements, pushing the sector toward shorter contracts and deeper investment in data-rich platforms.
Global 3PL Market Trends and Insights
E-commerce scale-up accelerating same-day fulfillment
Online retail in emerging economies is rapidly growing, and shoppers are increasingly expecting delivery in hours rather than days. Providers answer by planting hyperlocal hubs beside dense neighborhoods, trimming linehaul distance, and raising delivery density. These shifts force 3PL market operators to fine-tune route planning engines, expand two-wheeler fleets for congested streets, and adopt cloud order-management capable of real-time slot scheduling. Capital flows follow the demand: specialty real-estate trusts are converting small city plots into multi-story micro-fulfillment sites outfitted with shuttle systems and collaborative robots.
OEM near-shoring strategies creating cross-border shuttle freight
Mexico surpassed China as the United States' top trading partner between 2022 and 2023, handling USD 475.6 billion in goods and driving roughly 20,900 loaded truck crossings each month. New industrial parks under construction near Monterrey and along the Bajio corridor will keep freight taps open well past 2025. Shuttle lanes-short, high-frequency loops linking supplier plants to U.S. distribution centers-now underpin annual contracts for dedicated tractors, trailers, and dray service on both sides of the border. 3PL market leaders add bilingual control towers, real-time border-wait tracking, and dual-compliance customs brokerage to squeeze dwell times. Rail-truck intermodal pairings are rising too, reducing CO2 emissions per move and locking in predictable transit schedules.
Port congestion-induced cost volatility
Backlogs at major gateways spur wide swings in ocean spot rates and chassis detention fees. Shippers now prefer rolling quarterly agreements instead of multi-year pacts, keeping room to maneuver when port dwell blows out. 3PL market providers hedge by securing overflow yard space inland and deploying pop-up trans-load sites to flip cargo to rail the same day. Real-time data feeds from terminal operating systems guide dynamic slot booking, so trucks arrive only when a container sits wheels-ready.
Other drivers and restraints analyzed in the detailed report include:
- Pharmaceutical cold-chain outsourcing surge
- Government green-logistics mandates boosting carbon-neutral solutions
- Driver and warehouse labor scarcity
For complete list of drivers and restraints, kindly check the Table Of Contents.
Segment Analysis
Domestic Transportation Management captured 45% of the 3PL market size in 2024-equal to nearly USD 522 billion-and is forecast to grow 5.9% annually through 2030. App-based freight platforms feed real-time prices into tender engines, raising primary acceptance rates and shaving empty-mile percentages. The launch of same-day e-commerce routes and regionalized micro-fulfillment footprints intensifies demand for point-to-point linehauls and milk-run collections inside national borders.
The 3PL market also sees International Transportation Management weather softer growth as geopolitical risk and volatile ocean schedules complicate planning. Value-Added Warehousing and Distribution gains from inventory decentralization: retailers place stock closer to customer clusters, pushing operators to retrofit buildings with high-density shuttle racking and on-site returns processing lines. Road remains the dominant mode, but intermodal rails capture share on lanes longer than 900 kilometers where reliability now rivals trucking.
The 3PL Market Report is Segmented by Service (Domestic Transportation Management, International Transportation Management, and More), by End User (Automotive, Energy and Utilities, Manufacturing and More), by Logistics Model (Asset-Light, Asset-Heavy, and Hybrid), by Region (North America, South America, Europe, Asia-Pacific and More). The Market Forecasts are Provided in Terms of Value (USD).
Geography Analysis
Asia-Pacific retains 41.3% of 3PL market revenue and posts a region-best 6.0% CAGR. Manufacturing bases continue to diversify beyond China, sparking multimodal corridors from Ho Chi Minh City to Bangkok and onward to deepwater ports. Digital customs platforms in Singapore cut clearance time to under two hours, while Indonesia's e-commerce parcel volumes have tripled since 2022, demanding new automated sortation centers. Capital projects under Japan's Green Ports plan add cold-chain berth space, enabling direct imports of vaccine payloads.
North America ranks second in the 3PL market size and is being reshaped by near-shoring. Laredo, Texas, now hosts more warehouse stock than the Port of Savannah as shippers stage goods for rapid continental distribution. Short-haul intermodal chains reduce empty chassis runs, and unified rail service via the CPKC network trims single-crossing transit by a full day. Driver shortages push fleets toward slip-seat scheduling and remote-controlled yard tractors, lifting asset turns while saving labor hours.
Europe's 3PL market wrestles with emissions costs under the expanded EU Emissions Trading System. Shipping lines must purchase allowances covering 70% of vessel output in 2025, nudging cargo from ocean to rail on short-sea routes where electric locomotives claim zero-emission credits. The FuelEU Maritime and ReFuelEU Aviation regulations add further discipline, compelling carriers to blend low-carbon fuels. Providers that document certified reductions secure contracts with brands under pressure to meet climate disclosures.
- DHL Supply Chain and Global Forwarding
- Kuehne + Nagel International AG
- GXO Logistics
- C.H. Robinson Worldwide Inc.
- DSV A/S
- Nippon Express Holdings
- Sinotrans Ltd.
- CEVA Logistics (CMA CGM)
- XPO Logistics Inc.
- FedEx Logistics
- UPS Supply Chain Solutions
- GEODIS
- Kerry Logistics Network
- Yusen Logistics (NYK)
- Hitachi Transport System (LOGISTEED)
- J.B. Hunt Transport Services Inc.
- CJ Logistics
- Samsung SDS
- Americold Logistics LLC
- Penske Logistics
- Expeditors
Additional Benefits:
- The market estimate (ME) sheet in Excel format
- 3 months of analyst support
TABLE OF CONTENTS
1 Introduction
- 1.1 Study Assumptions and Market Definition
- 1.2 Scope of the Study
2 Research Methodology
3 Executive Summary
4 Market Landscape
- 4.1 Market Overview
- 4.2 Market Drivers
- 4.2.1 E-commerce Scale-up Accelerating Same-Day Fulfilment Demands in Developing Countries
- 4.2.2 OEM Near-shoring Strategies Creating Cross-Border Shuttle Freight Opportunities in North America
- 4.2.3 Pharmaceutical Cold-Chain Outsourcing Surge in Developed Economies
- 4.2.4 Government Green-Logistics Mandates (e.g., EU Fit-for-55) Boosting 3PL Demand for Carbon-Neutral Solutions
- 4.2.5 High-tech Sector's Shift to Direct-to-Consumer (D2C) Models Requiring Multi-Tenant DCs
- 4.2.6 Rise of Omni-channel Grocery Driving Micro-Fulfilment Contracts in Urban Zones
- 4.3 Market Restraints
- 4.3.1 Port Congestion-Induced Cost Volatility Reducing Contract Durations
- 4.3.2 Driver and Warehouse Labor Scarcity in OECD Economies Inflating Operating Margins
- 4.3.3 Soaring Industrial Real-Estate Costs in Tier-1 Logistics Hubs Compressing 3PL Margins
- 4.3.4 Cross-border Data-Residency Rules Limiting Cloud WMS Roll-outs
- 4.4 Value / Supply-Chain Analysis
- 4.5 Technology Snapshot (IoT, AI, etc.)
- 4.6 Key Government Regulations and Initiatives
- 4.7 Insights into E-commerce Business
- 4.8 Warehousing Market Trends
- 4.9 Demand Trend Analysis (CEP, Last-Mile, Cold-Chain etc.)
- 4.10 Porter's Five Forces
- 4.10.1 Threat of New Entrants
- 4.10.2 Bargaining Power of Buyers
- 4.10.3 Bargaining Power of Suppliers
- 4.10.4 Threat of Substitutes
- 4.10.5 Intensity of Competitive Rivalry
- 4.11 Impact of Geopolitical Events on the Market
5 Market Size & Growth Forecasts (Value)
- 5.1 By Service
- 5.1.1 Domestic Transportation Management (DTM)
- 5.1.1.1 Roadways
- 5.1.1.2 Railways
- 5.1.1.3 Airways
- 5.1.1.4 Waterways
- 5.1.2 International Transportation Management (ITM)
- 5.1.2.1 Roadways
- 5.1.2.2 Railways
- 5.1.2.3 Airways
- 5.1.2.4 Waterways
- 5.1.3 Value-Added Warehousing and Distribution (VAWD)
- 5.1.1 Domestic Transportation Management (DTM)
- 5.2 By End User
- 5.2.1 Automotive
- 5.2.2 Energy and Utilities
- 5.2.3 Manufacturing
- 5.2.4 Life Sciences and Healthcare
- 5.2.5 Technology and Electronics
- 5.2.6 Retail and E-commerce
- 5.2.7 Consumer Goods and FMCG
- 5.2.8 Food and Beverages
- 5.2.9 Others
- 5.3 By Logistics Model
- 5.3.1 Asset-Light (Management-Based)
- 5.3.2 Asset-Heavy (Own Fleet and Warehouses)
- 5.3.3 Hybrid
- 5.4 By Region
- 5.4.1 North America
- 5.4.1.1 United States
- 5.4.1.2 Canada
- 5.4.1.3 Mexico
- 5.4.2 South America
- 5.4.2.1 Brazil
- 5.4.2.2 Argentina
- 5.4.2.3 Chile
- 5.4.2.4 Rest of South America
- 5.4.3 Europe
- 5.4.3.1 Germany
- 5.4.3.2 United Kingdom
- 5.4.3.3 France
- 5.4.3.4 Spain
- 5.4.3.5 Italy
- 5.4.3.6 Netherlands
- 5.4.3.7 Russia
- 5.4.3.8 Rest of Europe
- 5.4.4 Asia-Pacific
- 5.4.4.1 China
- 5.4.4.2 India
- 5.4.4.3 Japan
- 5.4.4.4 South Korea
- 5.4.4.5 Singapore
- 5.4.4.6 Vietnam
- 5.4.4.7 Indonesia
- 5.4.4.8 Australia
- 5.4.4.9 Rest of Asia-Pacific
- 5.4.5 Middle East
- 5.4.5.1 United Arab Emirates
- 5.4.5.2 Saudi Arabia
- 5.4.5.3 Turkey
- 5.4.5.4 Israel
- 5.4.5.5 Rest of Middle East
- 5.4.6 Africa
- 5.4.6.1 South Africa
- 5.4.6.2 Egypt
- 5.4.6.3 Nigeria
- 5.4.6.4 Kenya
- 5.4.6.5 Rest of Africa
- 5.4.1 North America
6 Competitive Landscape
- 6.1 Strategic Moves
- 6.2 Market Share Analysis
- 6.3 Company Profiles (includes Global level Overview, Market level overview, Core Segments, Financials as available, Strategic Information, Market Rank/Share for key companies, Products and Services, and Recent Developments)
- 6.3.1 DHL Supply Chain and Global Forwarding
- 6.3.2 Kuehne + Nagel International AG
- 6.3.3 GXO Logistics
- 6.3.4 C.H. Robinson Worldwide Inc.
- 6.3.5 DSV A/S
- 6.3.6 Nippon Express Holdings
- 6.3.7 Sinotrans Ltd.
- 6.3.8 CEVA Logistics (CMA CGM)
- 6.3.9 XPO Logistics Inc.
- 6.3.10 FedEx Logistics
- 6.3.11 UPS Supply Chain Solutions
- 6.3.12 GEODIS
- 6.3.13 Kerry Logistics Network
- 6.3.14 Yusen Logistics (NYK)
- 6.3.15 Hitachi Transport System (LOGISTEED)
- 6.3.16 J.B. Hunt Transport Services Inc.
- 6.3.17 CJ Logistics
- 6.3.18 Samsung SDS
- 6.3.19 Americold Logistics LLC
- 6.3.20 Penske Logistics
- 6.3.21 Expeditors
7 Market Opportunities and Future Outlook
- 7.1 White-space and Unmet-Need Assessment
- 7.2 Emergence of 4PL and Digital Freight Marketplaces
- 7.3 Sustainability and Green Logistics Initiatives
- 7.4 Automation and Robotics in Warehouses
- 7.5 Near-shoring and Regionalisation Impact on Contract Structures


