

|
시장보고서
상품코드
2043977
남미의 청량음료 포장 : 시장 점유율 분석, 산업 동향 및 통계 데이터, 성장 예측(2026-2031년)South America Soft Drinks Packaging - Market Share Analysis, Industry Trends & Statistics, Growth Forecasts (2026 - 2031) |
||||||
 Mordor Intelligence
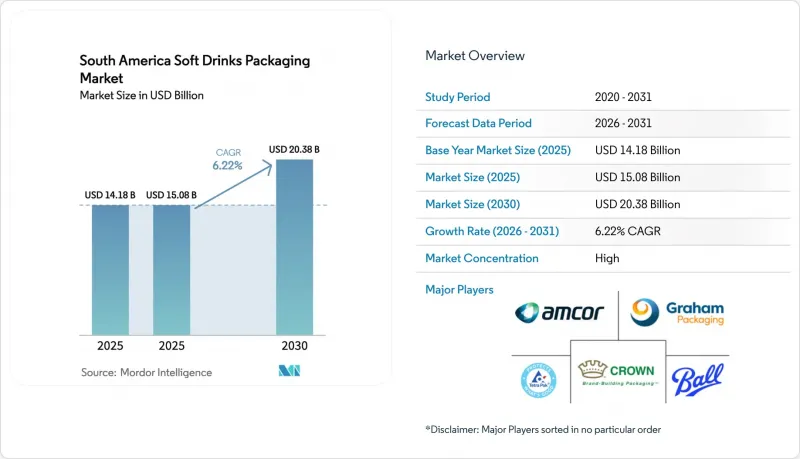
남미의 청량음료 포장 시장 규모는 2025년에 141억 8,000만 달러로 평가되었습니다. 2026년 150억 8,000만 달러에서 2031년까지 203억 8,000만 달러로 성장하여 2026년부터 2031년에 걸쳐 CAGR 6.22%를 나타낼 것으로 추정되고 있습니다.
브라질의 재활용 재료 함유 의무화 법과 메르코수르(MERCOSUR)의 식품 접촉 재료에 관한 규정 통일로 인해 rPET, 경량화, 역물류 네트워크에 대한 조기 투자가 촉진되고 있으며, 선도 기업에게는 비용 우위와 소매업체와의 견고한 관계로 소매업체와의 견고한 관계를 가져오고 있습니다. 페루와 콜롬비아의 급속한 소득 증가, 브라질과 아르헨티나의 식품 전자상거래 시장 확대, 위생적인 일회용 팩에 대한 지속적인 수요로 인해 소비자들이 저가 음료로 전환하는 추세에도 불구하고 판매량은 계속 증가하고 있습니다. 한편, 수지 및 알루미늄 가격의 변동, 보증금 반환 제도의 도입이 지역별로 편차를 보이고 있으며, 다층 라미네이트 재료의 금지로 인해 컨버터의 수익률이 압박을 받아 업계 구조조정이 가속화되고 있습니다. 상위 5개 컨버터가 지역 매출의 약 45%만 차지하기 때문에 경쟁의 강도는 여전히 중간 정도에 머물러 있으며, 파우치, 무균상자, 유리용기 분야의 중견 전문업체들이 진입할 수 있는 여지가 남아있습니다.
남미의 청량음료 포장 시장 동향과 인사이트
가처분소득 증가와 중산층 확대
2025년 실질임금 4.2% 상승으로 페루와 콜롬비아의 가계 구매력이 향상되면서 대도시의 프리미엄 기능성 음료와 지방도시의 저가 탄산음료라는 양극화된 수요 패턴이 형성되었습니다. 브라질에서는 310만 가구의 중산층이 증가했지만, 식료품 및 교통비 인플레이션으로 인해 소비자들은 리터당 비용을 절감할 수 있는 대용량 멀티 서빙 병으로 전환했습니다. 이러한 포장 크기의 양극화는 251-500ml 포맷이 여전히 주류인 반면, 더 작은 용량의 싱글 서빙 팩이 더 빠르게 성장하는 이유를 설명할 수 있는 요인 중 하나입니다. 페루에서는 아레키파(Arequipa)와 같은 광산 지역에서 이동 중 수분 보충을 원하는 교대 근무자들 사이에서 500ml 등방성 음료의 점유율이 증가했습니다. 콜롬비아에서는 긱 이코노미 일자리를 공식적으로 인정하는 새로운 노동 규정으로 인해 과세 소득이 증가하여 배달원들에게 인기 있는 캔과 파우치 제품에 대한 수요가 증가했습니다.
생수 소비 급증
아르헨티나의 22%, 페루의 31%는 안정적인 수돗물을 공급받지 못하고 있으며, 이는 매일 생수병에 담긴 물을 사용하거나 500ml의 일회용 제품을 지속적으로 구매하게 만드는 요인으로 작용하고 있습니다. 코카콜라는 2025년 지역 내 식수 포트폴리오의 판매량이 7% 증가할 것으로 예상하고, 수요를 충족시키기 위해 브라질 준데이에 위치한 PET 프리폼 생산 능력에 8,500만 달러(한화 약 9,000억 원)를 투자했습니다. 경량화를 통해 500ml 병의 무게가 24g으로 줄어들어 수지 사용량을 14% 줄였지만, 더 엄격한 품질 검사가 필요하게 되었습니다. 칠레에서는 미생물학적 기준이 강화되어 소규모 브랜드의 컴플라이언스 비용이 증가하면서 업계 구조조정이 가속화되었습니다. 연중 30℃ 이상의 기온이 지속되는 브라질 북동부 지역에서는 이동 중 소비가 1회용 워터 포맷의 지속적인 성장을 뒷받침하고 있습니다.
변동하는 수지 및 알루미늄 가격
2025년 원유 가격 변동과 공장 가동 중단으로 인해 PET 가격은 톤당 1,050-1,380달러 사이에서 변동했고, 음료 브랜드가 시즌 중 가격 인상에 저항하면서 컨버터의 수익률이 압박을 받았습니다. LME의 알루미늄 평균 가격은 톤당 2,420달러로 남미 캔 제조업체는 톤당 180달러의 운임 프리미엄을 지불하고 현지 통화 변동 위험에 직면했습니다. 브라질의 노벨리스(Novellis)와 아르헨티나의 알알(Alual)이 거의 풀가동으로 인해 콜롬비아의 코일 수입업체들은 22%의 비용 상승을 겪어야 했고, 이는 캔의 보급을 둔화시켰습니다. 현물 가격의 변동으로 인해 컨버터는 헤지를 하거나 수익률 하락을 감수해야 하며, 이는 rPET의 매력을 높이고 있습니다. rPET의 가격은 버진 수지와의 연동성이 점점 약해지고 있습니다.
부문 분석
플라스틱은 2025년 매출의 61.48%를 차지했으며, 그중심에는 투명성, 비용, 유통 효율성을 겸비한 플라스틱 병이 있습니다. 플라스틱 분야에서 rPET 하위 부문은 재활용 재료에 대한 수요 증가, 통합 공급 계약 및 화학적 재활용 시범 사업 지원으로 인해 2031년까지 연평균 6.98%의 성장률을 나타낼 것으로 예측됩니다. 금속 용기(주로 알루미늄 캔)는 가격 변동에도 불구하고 23%를 차지했습니다. 이는 도시 밀레니얼 세대 소비자들이 선호하는 '무한 재활용 가능'이라는 특성에 기인합니다. 유리 용기는 프리미엄 주스 및 크래프트 소다 시장에서 9%의 틈새 시장 점유율을 유지했습니다. 이는 Verallia의 새로운 산소 연소로가 55%의 칼렛을 원료로 사용하여 기존 용융 공정에 비해 탄소 강도를 18% 감소시킨 것에 힘입은 것입니다. 판지 기반 무균팩은 6.7%를 차지했으며, 테트라팩이 추진하는 상온 물류 및 매장 진열이 가능한 EC용 디자인이 주효한 것으로 분석됩니다. 경량화를 통해 500ml 페트병의 무게는 2023년 26g에서 2025년 23g으로 줄어들고, 암콜의 산소흡수제 관련 특허는 유통기한을 손상시키지 않으면서 12% 더 경량화를 목표로 하고 있습니다.
비용 압박과 지속가능성 브랜딩으로 인해 컨버터의 설비 투자는 rPET, 배리어 코팅 및 폐기 시 선택의 폭을 넓혀주는 종이-플라스틱 복합 구조로 계속 이동하고 있습니다. 메르코수르(MERCOSUR)의 통일된 PET 표준은 ISO 22000 인증 실험실을 갖추지 못한 소규모 공장에게는 컴플라이언스 장벽이 되지만, 다국적 기업에게는 국경을 초월한 무역을 촉진하는 역할을 합니다. 이에 따라 플라스틱 관련 남미 청량음료 포장 시장 규모는 확대될 것으로 예상되는 반면, 금속 및 종이팩 형태는 기술적 업그레이드와 재활용성을 강조한 마케팅을 통해 각각의 성장세를 유지할 것으로 보입니다.
2025년에는 병이 44.98%를 차지했고, 그중 PET가 약 3분의 4를 차지했습니다. 이는 PET의 친근함과 높은 충전 속도에 기인합니다. 그러나 파운드와 향 주머니는 부피 효율성과 라스트마일 배송 시 경량화를 중시하는 온라인 식료품 배송에 힘입어 CAGR 6.95%를 나타낼 것으로 예측됩니다. 알루미늄 캔은 28%의 점유율을 차지하며, 1회용 위생과 세척이 필요 없습니다는 장점이 금속 소재의 높은 비용을 상회하는 패스트푸드점에서 점유율을 확대했습니다. 판지 및 무균 팩은 18%를 차지하며 상온 보존성을 활용하여 주스 및 식물성 음료 시장에서 경쟁하고 있지만, 아르헨티나에서는 소비자들이 판지를 저품질로 간주하기 때문에 이미지 장벽에 직면해 있습니다.
파우치는 소규모 소매점에서 우위를 점하고 있으며, 특히 페루에서는 300ml 플렉서블 팩이 1회 제공량당 PET 용기보다 35% 저렴합니다. 브라질의 한 레스토랑 체인은 파손을 줄이기 위해 250ml 캔을 표준화하여 금속 비용 상승에도 불구하고 캔 출하량을 9% 증가시켰습니다. 한편, 산티아고에서 실시된 유리병 리필(리필) 테스트 프로그램에서는 회수율이 41%에 불과해, 보증금 제도가 제대로 갖춰지지 않은 상황에서 소비자의 습관을 바꾸는 것이 얼마나 어려운 일인지 알 수 있었습니다. 가공업체들이 로봇식 케이스 패커와 개봉이 용이한 절취선 도입을 추진하는 가운데, 파우치는 충동구매 및 전자상거래 채널에서 병의 점유율을 빼앗아갈 태세를 보이고 있으며, 남미 청량음료 포장 시장이 가볍고 유연한 형태로 전환하는 추세가 강화되고 있습니다.
기타 혜택 :
- 엑셀 형식 시장 예측(ME) 시트
- 3개월간 애널리스트 지원
자주 묻는 질문
목차
제1장 서론
제2장 분석 방법
제3장 주요 요약
제4장 시장 구도
제5장 시장 규모와 성장 예측
제6장 경쟁 구도
제7장 시장 기회와 향후 전망
KTH 26.05.29The South America soft drinks packaging market size was valued at USD 14.18 billion in 2025 and is estimated to grow from USD 15.08 billion in 2026 to USD 20.38 billion by 2031, at a CAGR of 6.22% over 2026-2031.
Mandatory recycled-content laws in Brazil and harmonized food-contact rules in MERCOSUR are prompting early investments in rPET, lightweighting, and reverse-logistics networks, giving first movers cost advantages and stronger retail ties. Rapid income growth in Peru and Colombia, expanding e-commerce grocery penetration in Brazil and Argentina, and persistent demand for hygienic single-serve packs continue to lift unit volumes even as consumers trade down to value beverages. At the same time, volatile resin and aluminum prices, fragmented deposit-return roll-outs, and bans on multi-material laminates are squeezing converter margins and accelerating consolidation. Competitive intensity remains moderate because the top five converters control only about 45% of regional revenue, leaving space for mid-tier specialists in pouches, aseptic cartons, and glass.
South America Soft Drinks Packaging Market Trends and Insights
Rising Disposable Income And Middle-Class Expansion
Real wage gains of 4.2% in 2025 lifted household purchasing power in Peru and Colombia, creating a two-tier demand pattern that splits premium functional drinks in large cities from value carbonated offerings in secondary towns. Brazil added 3.1 million middle-class families, yet higher food and transport inflation nudged shoppers toward larger multi-serve bottles, which lower per-liter costs. The pack-size dichotomy helps explain why 251-500 ml formats still dominate while smaller single-serve packs post faster growth. In Peru's mining hubs, such as Arequipa, 500 ml isotonic bottles gained share among shift workers seeking on-the-go hydration solutions. Colombia's new labor rules, formalizing gig-economy jobs, expanded tax-based income, boosting demand for cans and pouches popular with delivery riders.
Surge In PET Bottled-Water Consumption
Persistent gaps in municipal water supply leave 22% of Argentine and 31% of Peruvian urban households without reliable tap water, driving daily bottled-water use and consistent 500 ml single-serve purchases. Coca-Cola reported a 7% volume jump in its regional water portfolio during 2025 and invested USD 85 million in PET preform capacity at Jundiai, Brazil, to meet demand. Lightweighting cut the 500 ml bottle weight to 24 grams, saving 14% in resin but requiring stricter quality checks. Chile tightened microbiological rules, raising compliance costs for small brands yet accelerating consolidation. Out-of-home consumption in Brazil's Northeast, where temperatures exceed 30 °C year-round, underpins sustained growth in single-serve water formats.
Volatile Resin And Aluminum Prices
PET prices fluctuated between USD 1,050-1,380 per t in 2025 due to crude swings and plant outages, squeezing converter margins as beverage brands resisted mid-season price hikes. Aluminum averaged USD 2,420 per t on the LME, with South American can makers paying freight premiums of USD 180 per t and facing local currency volatility. Brazil's Novelis and Argentina's Aluar ran near full capacity, so Colombian coil importers paid a 22% cost penalty that slowed can adoption. Spot volatility forces converters to hedge or accept thinner margins, reinforcing the appeal of rPET, whose pricing increasingly decouples from virgin resin.
Other drivers and restraints analyzed in the detailed report include:
- Post-COVID Demand For Hygienic Single-Serve Packs
- Sustainability Push, rPET And Lightweighting Mandates
- Stringent Bans On Non-Recyclable Plastics
For complete list of drivers and restraints, kindly check the Table Of Contents.
Segment Analysis
Plastic held 61.48% of 2025 revenue, anchored by PET bottles that combine clarity, cost, and distribution efficiency. Within plastics, the rPET subsegment is set to expand at a 6.98% CAGR through 2031 as mandates raise demand for recycled content, supporting integrated supply contracts and chemical-recycling pilots. Metal formats, chiefly aluminum cans, captured 23% despite price volatility because of their infinite recyclability, which resonates with urban millennial shoppers. Glass maintained a 9% niche in premium juice and craft soda, reinforced by Verallia's new oxy-combustion furnace that runs on 55% cullet feed and lowers carbon intensity by 18% versus legacy melts. Paperboard-based aseptic cartons rounded out 6.7%, benefiting from ambient logistics and shelf-ready e-commerce designs promoted by Tetra Pak. Lightweighting trimmed 500 ml PET bottles from 26 g in 2023 to 23 g in 2025, and Amcor's oxygen-scavenger patents aim to drop them another 12% without compromising shelf life.
Cost pressure and sustainability branding continue to tilt converter capex toward rPET, barrier coatings, and hybrid paper-plastic structures that broaden end-of-life options. MERCOSUR's unified PET standard adds compliance hurdles for small plants lacking ISO 22000 labs but enhances cross-border trade for multinationals. As a result, the South America soft drinks packaging market size tied to plastic is forecast to widen even while metal and carton formats defend their own growth lanes through technical upgrades and marketing that highlights recyclability.
Bottles commanded 44.98% in 2025, with PET accounting for nearly three-quarters of volume owing to familiarity and high filling speeds. Yet pouches and sachets are on track for a 6.95% CAGR, propelled by online grocery fulfillment that values cube efficiency and lighter last-mile payloads. Aluminum cans held 28% and gained share in quick-service restaurants where single-serve hygiene and no-rinse benefits outweigh metal premiums. Cartons and aseptic boxes, at 18%, leverage ambient stability to compete in juice and plant-based drinks but face perception hurdles in Argentina, where consumers regard paperboard as lower tier.
Pouches excel in informal retail, especially in Peru, where 300 ml flexible packs undercut PET by 35% per serving. Brazil's restaurant chains standardized 250 ml cans to cut breakage, boosting can volume 9% despite metal costs. Meanwhile, pilot refillable-glass programs in Santiago achieved only 41% return rates, underscoring the challenge of changing consumer habits without a robust deposit infrastructure. As converters push robotic case-packers and easy-open tear notches, pouches look poised to erode share from bottles in impulse and e-commerce channels, reinforcing the South America soft drinks packaging market's shift toward lightweight flexible formats.
The South America Soft Drinks Packaging Market Report is Segmented by Material (Plastic, Metal, and More), Packaging Format (Bottles, Cartons and Aseptic Boxes, and More), Beverage Type (Carbonated Soft Drinks, Juices and Nectars, Ready-To-Drink Beverages, Sports and Isotonic Drinks, and More), Pack Size (Less Than Equal To 250 Ml, 251-500 Ml, and More), and Geography. The Market Forecasts are Provided in Terms of Value (USD).
List of Companies Covered in this Report:
- Amcor plc
- Ball Corporation
- Crown Holdings, Inc.
- Tetra Pak International S.A.
- CAN-PACK S.A.
- Ardagh Group S.A.
- Trivium Packaging B.V.
- Graham Packaging Company L.P.
- Refresco Group N.V.
- Victory Packaging L.P.
- Plastipak Holdings, Inc.
- Owens-Illinois Inc.
- SIG Combibloc Group Ltd.
- AptarGroup, Inc.
- Envases Universales de Mexico S.A. de C.V.
- Ecolean AB
- Alpek S.A.B. de C.V.
- CCL Industries Inc.
- Verallia S.A.
Additional Benefits:
- The market estimate (ME) sheet in Excel format
- 3 months of analyst support
TABLE OF CONTENTS
1 INTRODUCTION
- 1.1 Study Assumptions and Market Definition
- 1.2 Scope of the Study
2 RESEARCH METHODOLOGY
3 EXECUTIVE SUMMARY
4 MARKET LANDSCAPE
- 4.1 Market Overview
- 4.2 Market Drivers
- 4.2.1 Rising Disposable Income and Middle-Class Expansion
- 4.2.2 Surge in PET Bottled-Water Consumption
- 4.2.3 Post-COVID Demand for Hygienic Single-Serve Packs
- 4.2.4 Sustainability Push, rPET and Lightweighting Mandates
- 4.2.5 E-commerce Grocery Growth Spurring Shelf-Ready Formats
- 4.2.6 Standardized Refillable Bottle Programs
- 4.3 Market Restraints
- 4.3.1 Stringent Bans on Non-Recyclable Plastics
- 4.3.2 Volatile Resin and Aluminum Prices
- 4.3.3 Slow Deposit-Return Roll-Out Outside Brazil
- 4.3.4 Limited Recycling Infrastructure in Andean Nations
- 4.4 Industry Value Chain Analysis
- 4.5 Regulatory Landscape
- 4.6 Technological Outlook
- 4.7 Porter's Five Forces Analysis
- 4.7.1 Bargaining Power of Suppliers
- 4.7.2 Bargaining Power of Buyers
- 4.7.3 Threat of New Entrants
- 4.7.4 Threat of Substitutes
- 4.7.5 Competitive Rivalry
- 4.8 Overview of Global Soft Drinks Packaging Market
- 4.9 Impact of Macroeconomic Factors on the Market
5 MARKET SIZE AND GROWTH FORECASTS (VALUES)
- 5.1 By Material
- 5.1.1 Plastic
- 5.1.2 Metal
- 5.1.3 Glass
- 5.1.4 Paper and Paperboard
- 5.2 By Packaging Format
- 5.2.1 Bottles
- 5.2.2 Cans
- 5.2.3 Cartons and Aseptic Boxes
- 5.2.4 Pouches and Sachets
- 5.3 By Beverage Type
- 5.3.1 Carbonated Soft Drinks (CSDs)
- 5.3.2 Juices and Nectars
- 5.3.3 Ready-to-Drink (RTD) Beverages
- 5.3.4 Sports and Isotonic Drinks
- 5.3.5 Other Beverage Types
- 5.4 By Pack Size
- 5.4.1 Less Than Equal To 250 ml
- 5.4.2 251 - 500 ml
- 5.4.3 501 - 1000 ml
- 5.4.4 More Than 1 L
- 5.5 By Country
- 5.5.1 Brazil
- 5.5.2 Argentina
- 5.5.3 Chile
- 5.5.4 Colombia
- 5.5.5 Peru
- 5.5.6 Rest of South America
6 COMPETITIVE LANDSCAPE
- 6.1 Market Concentration
- 6.2 Strategic Moves
- 6.3 Market Share Analysis
- 6.4 Company Profiles (includes Global level Overview, Market level overview, Core Segments, Financials as available, Strategic Information, Market Rank/Share for key companies, Products and Services, and Recent Developments)
- 6.4.1 Amcor plc
- 6.4.2 Ball Corporation
- 6.4.3 Crown Holdings, Inc.
- 6.4.4 Tetra Pak International S.A.
- 6.4.5 CAN-PACK S.A.
- 6.4.6 Ardagh Group S.A.
- 6.4.7 Trivium Packaging B.V.
- 6.4.8 Graham Packaging Company L.P.
- 6.4.9 Refresco Group N.V.
- 6.4.10 Victory Packaging L.P.
- 6.4.11 Plastipak Holdings, Inc.
- 6.4.12 Owens-Illinois Inc.
- 6.4.13 SIG Combibloc Group Ltd.
- 6.4.14 AptarGroup, Inc.
- 6.4.15 Envases Universales de Mexico S.A. de C.V.
- 6.4.16 Ecolean AB
- 6.4.17 Alpek S.A.B. de C.V.
- 6.4.18 CCL Industries Inc.
- 6.4.19 Verallia S.A.
7 MARKET OPPORTUNITIES AND FUTURE OUTLOOK
- 7.1 White-Space and Unmet-Need Assessment


