
|
시장보고서
상품코드
2044098
남미의 하이퍼스케일 데이터센터 : 시장 점유율 분석, 업계 동향 및 통계, 성장 예측(2026-2031년)South America Hyperscale Data Center - Market Share Analysis, Industry Trends & Statistics, Growth Forecasts (2026 - 2031) |
||||||
 Mordor Intelligence
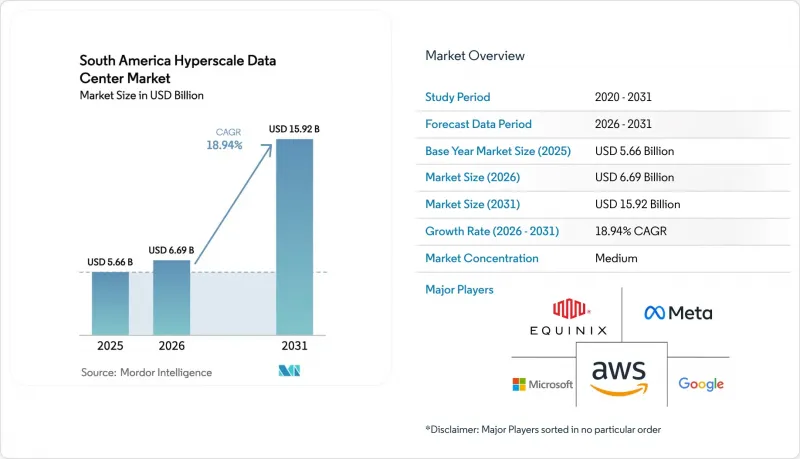
남미의 하이퍼스케일 데이터센터 시장 규모는 2025년 56억 6,000만 달러로 평가되었습니다. 2026년 66억 9,000만 달러로 확대되어 2031년까지 159억 2,000만 달러에 이를 것으로 예상되며 2026년부터 2031년에 걸쳐 CAGR 18.94%를 나타낼 전망입니다.
클라우드 지역의 급속한 확장, 새로운 해저 케이블, 풍부한 재생에너지 계약이 결합되어 주요 대도시 지역의 자본 투자가 가속화되고 있습니다. 하이퍼스케일러들은 자체 캠퍼스를 계속 건설하고 있지만, 코로케이션 제공업체들은 가동 시간을 단축하고 중단 없는 서비스를 요구하는 고객들을 위해 전력망에 대한 의존도를 낮추기 위해 전력 공급처를 다양화하여 추가 전력 공급량을 확보하고 있습니다. 브라질, 아르헨티나, 콜롬비아에서 도입된 데이터 주권 규정으로 인해 개인 및 공공 부문의 데이터는 국내 유보가 의무화되어 남미의 하이퍼스케일 데이터센터 시장에서 워크로드 점유율이 사실상 증가하고 있습니다. 동시에 GPU를 많이 사용하는 인공지능 클러스터로 인해 랙당 전력 밀도가 30kW를 넘어서고 있으며, 사업자들은 수냉 시스템 및 열교환기 개조에 대한 적극적인 투자를 요구하고 있으며, 이로 인해 기계 인프라의 예산 구성이 재편되고 있습니다. 수익 성장의 주요 요인으로는 하이퍼스케일러를 통한 자체 구축 프로그램, 캐리어 중립적인 캠퍼스 내 교차 연결 중심의 비즈니스 모델, 그리고 규제 요금 대비 12% 이상의 할인을 제공하는 재생에너지 전력 구매 계약 등을 꼽을 수 있습니다. 전력망의 낮은 신뢰도, 고전압 기술자 부족, 특정 지역의 증발 냉각을 제한하는 물 부족으로 인한 일시적 중단 조치 등이 남아 있습니다. 그럼에도 불구하고 60MW가 넘는 메가 캠퍼스에서는 변전소, 냉수 플랜트, 파이버링 등을 더 큰 용량 기반에 통합하여 운영 레버리지를 발휘하고 있습니다. 상위 5개 업체가 전체 설치 용량의 약 62%를 점유하고 있기 때문에 경쟁의 강도는 중간 정도에 머물러 있으며, 지역 전문 업체나 엣지 전문 신규 진입 업체에게는 현지 전력 회사와의 관계, 이중 언어 지원 팀, 차세대 액체 냉각 시스템 도입 등을 통해 차별화를 꾀할 수 있는 충분한 여지가 남아 있습니다.
남미의 하이퍼스케일 데이터센터 시장 동향과 인사이트
하이퍼스케일러의 클라우드 리전 출시가 급증합니다.
적극적인 클라우드 리전 구축은 남미의 하이퍼스케일 데이터센터 시장에서 가장 강력한 단일 동력으로 작용하고 있습니다. 아마존웹서비스(AWS)는 40억 달러를 투자해 12개의 가용성 영역과 40-80메가와트까지 확장 가능한 실적를 갖춘 산티아고 클라우드 리전에 40억 달러를 투자해 결제 엔진과 증강현실(AR) 쇼핑카트 운영에 한자리수 밀리초대 레이턴시를 필요로 하는 소프트웨어 업체들을 유치하고 있습니다.의 레이턴시를 필요로 하는 소프트웨어 벤더들을 끌어들이고 있습니다. 마이크로소프트도 비슷한 움직임을 보이며 같은 도시권에 Azure Zone을 구축했습니다. 한편, 구글은 상파울루에서 M8g ARM 기반 인스턴스를 제공하기 시작한 후 코어 단가를 22% 인하했습니다. 이러한 주요 개발은 인접한 코로케이션 시설에 대한 수요를 불러일으키고 있습니다. 독립 소프트웨어 벤더는 엄격한 서비스 수준 목표를 달성하기 위해 동일한 가용성 영역 내에 애플리케이션 서버를 설치해야 하기 때문입니다. 기업들이 하이퍼스케일러에 대한 온램프 교차 연결 계약을 체결함으로써 이 순환이 완성되었고, 그 결과 상파울루의 빌라 올림피아 클러스터와 산티아고의 키리쿠라 코리도의 가동률은 85% 이상에 달하고 있습니다. 주권 워크로드를 분류하는 브라질의 새로운 규정은 국내 호스팅에 대한 의존도를 더욱 강화하여 클라우드 구축의 모멘텀이 중기적으로 지속될 수 있도록 보장합니다.
해저 케이블의 육지 상륙으로 지연 시간 및 이중화 향상
두 번째 촉진요인은 지연 시간을 줄이고 페일오버 경로를 다양화하기 위해 태평양 횡단 및 남북 방향의 해저 광섬유에 대한 투자에 있습니다. 구글의 총 길이 14,800km에 달하는 훔볼트 케이블이 2026년 말 발파라이소(Valparaiso)에 상륙하면 산티아고-시드니 간 왕복 지연 시간을 30밀리초 단축하고, 칠레 광산업체가 호주의 분석 플랫폼에서 눈에 보이는 지연 없이 예지보전 모델을 실행할 수 있게 됩니다. 모델을 실행할 수 있게 됩니다. Cirion Technologies는 2025년 초 브라질과 미국을 연결하는 72 테라비트/초의 SAC-2 링크를 가동하여 콘텐츠 전송 네트워크의 트랜짓 비용을 18% 절감했습니다. Meta의 Project Waterworth는 2024년 말 브라질의 루트를 다양화하여 앵커의 끌림, 지진 등으로 인해 사업자를 괴롭혀온 단일 장애 지점(SPOF)의 리스크를 줄였습니다. 이 새로운 대역폭을 통해 클라우드 제공업체는 상파울루와 산티아고 시내에 대규모 캐시 노드를 설치하여 50밀리초 미만의 지연 시간으로 사용자에게 서비스를 제공할 수 있게 되었으며, 대륙간 간선 회선의 피크 시간대 트래픽을 약 40% 절감할 수 있게 되었습니다. 금융 서비스 기업은 비즈니스 연속성 요건을 충족하는 이중 경로를 통해 네트워크의 내결함성을 확보하고, 알고리즘 트레이딩 엔진을 지역 거점으로 이전할 수 있게 되었습니다.
전력망의 불안정성과 높은 전기요금
전력의 불안정성과 변동이 심한 요금 체계는 여전히 남미의 하이퍼스케일 데이터센터 시장에서 단기적으로 가장 심각한 걸림돌로 작용하고 있습니다. 2024년 11월 상파울루에서 발생한 Enel의 정전 사태로 210만 명의 고객이 최대 72시간 동안 정전을 겪었고, 불가항력 조항이 발동되어 테넌트는 코로케이션 요금 지불을 일시 중단할 수 있었습니다. 아르헨티나의 경우, 보조금 삭감에 따라 같은 해 산업용 전기요금이 38% 급등하면서 헤지 계약을 체결하지 않은 시설의 영업이익률을 압박했습니다. 칠레의 요금 체계는 더 안정적이지만, 여전히 지역 평균보다 9% 높은 수준이며, 사업자들은 공급 제한의 권리를 얻는 대신 15%의 할인을 받는 '중단 가능한 부하 계약'을 협상하고 있습니다. 계약상 가동률을 유지하기 위해 상파울루의 일반적인 20메가와트 규모의 데이터센터는 현재 25메가와트 규모의 자가발전 설비를 도입하고 있습니다. 이에 따라 초기 설비 투자로 300만 달러, 연간 유지보수 비용으로 40만 달러가 추가로 발생합니다. 이러한 추가 비용으로 인해 실시간 입찰 엔진과 같은 지연에 민감한 워크로드의 도입이 어려워지고, 이러한 용도는 99.999%의 가동률이 표준인 북미으로 이동하는 경향이 있습니다.
부문 분석
하이퍼스케일 코로케이션 시장은 2026년부터 2031년까지 연평균 19.54% 성장할 것으로 예상되며, 이는 자체 구축형 데이터센터의 예상 성장률 18.94%를 상회하는 수치입니다. 이러한 격차는 남미의 하이퍼스케일 데이터센터 시장의 구조적 변화를 뒷받침하고 있습니다. 하이퍼스케일러들은 AI 워크로드에 맞게 냉각 토폴로지를 미세 조정할 수 있는 수직 통합을 선호하기 때문에 2025년 지출의 55.76%를 자체 구축형이 차지했습니다. 그럼에도 불구하고, 브라질과 아르헨티나의 전력 공급 리드타임이 길어지고 요금 쇼크가 발생함에 따라 주요 클라우드 기업들은 18개월이 소요되는 그린필드 건설 일정을 피하고 90일 이내에 가동 가능한 임대형 홀 블록을 통해 리스크를 헤지하고 있습니다. 아마존웹서비스(AWS)는 유지보수 기간 동안 상파울루 클라우드 리전을 백업하기 위해 Equinix SP11에 5메가와트를 확보함으로써 이러한 접근 방식을 구현하고 있으며, 이는 자본력이 있는 기업이라도 민첩성을 중요하게 여긴다는 점을 민첩성을 중요하게 여긴다는 것을 보여줍니다. 금융 서비스 기업들은 코로케이션의 성장을 주도하고 있습니다. 이는 브라질 중앙은행(Banco Central do Brasil)의 비즈니스 연속성 규정에 따라 주 사이트와 재해복구 사이트의 지리적 분리를 의무화하고 있으며, 이 요구사항은 자체 중복 설비보다 멀티 캠퍼스 리스를 통해 보다 경제적으로 충족할 수 있기 때문입니다.
상호 연결의 밀도는 테넌트의 서버를 여러 클라우드 온램프, 인터넷 거래소 및 통신사의 미팅룸에 가깝게 집적화하여 코로케이션의 이점을 높입니다. Scala Data Centers의 보고서에 따르면, 2025년 매출의 42%는 단순한 랙 렌탈이 아닌 교차 연결 및 피어링 서비스에서 비롯된 것으로, 네트워크 효과가 높은 입주율과 높은 수익을 창출하고 있음을 반영하고 있습니다. 반면, 자체 구축 시설의 경우, 부동산 비용이 30% 정도 저렴한 교외 부지를 선택하는 경우가 많지만, 광섬유 경로가 제한적이기 때문에 멀티 클라우드 연동을 필요로 하는 지연에 민감한 AI 추론 파이프라인에 제약이 될 수 있습니다. 워크로드가 여러 퍼블릭 클라우드에 동시에 접속해야 하는 페더레이티드 러닝 모델로 진화함에 따라, 캐리어 중립적인 캠퍼스 내 상호 연결의 프리미엄은 코로케이션 시장 평균을 상회하는 성장을 지속할 것으로 보입니다. 그 결과, 남미의 하이퍼스케일 데이터센터 시장은 하이퍼스케일러들조차도 설비투자 규율과 용량 확보 속도의 균형을 맞추기 위해 자체 소유와 임대 용량을 결합하는 하이브리드 조달 구조로 전환하고 있는 것으로 보입니다.
IT 하드웨어는 2025년 지출에서 42.18%로 가장 큰 비중을 차지했지만, 전력 밀도가 구조적으로 계속 상승하고 있기 때문에 기계 시스템은 19.62%로 가장 높은 CAGR을 나타낼 것으로 예측됩니다. NVIDIA H100과 같은 GPU 어레이는 이미 캐비닛 부하를 30kW 이상으로 끌어올렸으며, 랙당 45kW까지 지원하는 직접 투 칩 콜드 플레이트와 리어 도어 열교환기는 이제 리노베이션 프로젝트에서 필수적인 요소로 자리 잡았습니다. 전기 시설에 대한 지출은 18.7% 증가합니다. 이는 20메가와트 홀의 경우 N+1의 중복성을 확보하기 위해 25메가와트의 전력 공급 연결이 필요하며, 이를 위해 변전소 업그레이드에 200만 달러가 넘는 비용이 소요되기 때문입니다. 일반건설비 증가율은 18.3%에 불과합니다. 이는 사업자가 미개발 토지를 조성하는 대신 산업용 부동산 소유주로부터 기존 쉘(건물 외피)을 임대해 모듈형 화이트스페이스 키트를 도입하는 사례가 늘고 있기 때문입니다. 슈나이더일렉트릭의 최신 예측 분석 레이어는 AI 워크로드 급증에 맞추어 냉각기 가동 순서를 조정하여 에너지 낭비를 12% 절감합니다. 한편, 아리스타의 800기가비트 이더넷 스파인 리프 패브릭은 모델 훈련 주기에 따른 동서 방향의 트래픽 급증을 처리할 수 있습니다.
랙의 높이가 52U, 심지어 60U로 높아짐에 따라 기계 관련 비용도 더욱 증가하고 있습니다. 이는 키가 큰 프레임에는 설계된 보강재, 확장된 케이블 관리 및 더 견고한 공기 흐름 제어 도어가 필요하기 때문입니다. 하이퍼스케일러가 트레이닝 노드를 연결하기 위해 400기가비트 및 800기가비트 광섬유를 채택함에 따라 네트워크 업그레이드도 관련 주제가 되고 있습니다. 이로 인해 랙당 파이버 수가 3배 증가하여 더 높은 정압을 가진 냉각 팬이 필요합니다. NVMe-over-Fabrics를 향한 스토리지 아키텍처의 변화는 플래시 풀을 중앙집중화하여 테라바이트당 비용을 18% 절감했지만, 동서 방향의 네트워크 부하 증가로 인해 냉각 루프에 대한 부담이 증가했습니다. 열교환기 코어의 리드타임이 16주에 달하는 가운데, 특히 세계 AI 수요로 인해 한정된 구리 및 알루미늄 재고가 Tier-1 지역에 우선적으로 유입되는 상황에서 기계 공급업체들은 가격 결정력을 높이고 있습니다. 그 결과, 현재 기계 지출의 성장 곡선이 서버의 갱신 주기를 능가하는 수준에 이르렀으며, 이는 남미의 하이퍼스케일 데이터센터 시장의 기존 추세와는 정반대의 현상입니다.
기타 혜택 :
- 엑셀 형식 시장 예측(ME) 시트
- 3개월간 애널리스트 지원
자주 묻는 질문
목차
제1장 서론
제2장 조사 방법
제3장 주요 요약
제4장 시장 구도
제5장 하이퍼스케일 데이터센터 인공지능(AI) 도입(하위 부문은 데이터 입수 상황에 의해 변경되는 경우가 있습니다)
제6장 규제 및 컴플라이언스 프레임워크
제7장 주요 데이터센터 통계
제8장 시장 규모와 성장 예측
제9장 경쟁 구도
제10장 시장 기회와 향후 전망
KTH 26.05.29The South America hyperscale data center market size is expected to increase from USD 5.66 billion in 2025 to USD 6.69 billion in 2026 and reach USD 15.92 billion by 2031, growing at a CAGR of 18.94% over 2026-2031.
Rapid cloud-region roll-outs, new sub-sea cables, and abundant renewable-energy contracts combine to accelerate capital deployment across every major metro. Hyperscalers continue to build proprietary campuses, yet colocation providers are winning incremental megawatts by shortening time-to-production and diversifying grid exposure for clients that demand uninterrupted service. Data-sovereignty rules introduced in Brazil, Argentina, and Colombia require personal and public-sector data to remain on domestic soil, which effectively locks a rising share of workloads inside the South America hyperscale data center market. Simultaneously, GPU-rich artificial-intelligence clusters are lifting rack power densities beyond 30 kilowatts, forcing operators to invest aggressively in liquid-cooling and heat-exchanger retrofits that reshape mechanical-infrastructure budgets. Key drivers of revenue growth include hyperscaler self-build programs, cross-connect-centric business models inside carrier-neutral campuses, and renewable power purchase agreements that offer 12%-plus discounts relative to regulated tariffs. Challenges remain in the form of grid unreliability, a shortage of high-voltage technicians, and water-stress moratoria that restrict evaporative cooling in certain jurisdictions. Even so, mega campuses above 60 megawatts unlock operating leverage by centralizing substations, chilled-water plants, and fiber rings across a larger denominator of capacity. Competitive intensity sits at a moderate level because the top five providers account for about 62% of total installed megawatts, leaving meaningful headroom for regional specialists and edge-focused entrants to differentiate through local utility relationships, bilingual support teams, and next-generation liquid-cooling deployments.
South America Hyperscale Data Center Market Trends and Insights
Surge in Cloud-Region Launches by Hyperscalers
Aggressive cloud-region roll-outs anchor the strongest single catalyst for the South America hyperscale data center market. Amazon Web Services committed USD 4 billion to a Santiago cloud region that opens with 12 availability zones and an expandable 40-to-80-megawatt footprint, drawing software vendors that need single-digit-millisecond latency to operate payment engines and augmented-reality shopping carts. Microsoft mirrored the move with Azure zones in the same metro, while Google cut per-core pricing by 22% after enabling its M8g Arm-based instances in Sao Paulo. These flagship deployments trigger demand for adjacent colocation because independent software vendors must install application servers inside identical availability spheres to meet stringent service-level objectives. The loop closes when enterprises sign cross-connects to hyperscaler on-ramps, which in turn drives occupancy rates above 85% in Sao Paulo's Vila Olimpia cluster and Santiago's Quilicura corridor. Newly issued Brazilian regulations that classify sovereign workloads further lock in domestic hosting, ensuring the cloud-build momentum sustains through the medium term.
Sub-Sea Cable Landings Enhancing Latency and Redundancy
A second catalyst flows from trans-Pacific and north-south sub-sea fiber investments that drop latency and diversify fail-over paths. Google's 14,800-kilometer Humboldt cable will reduce Santiago-Sydney round-trip delay by 30 milliseconds when it lands in Valparaiso during late 2026, enabling Chilean mining firms to run predictive-maintenance models on Australian analytics platforms with no perceptible lag. Cirion Technologies activated the 72-terabit-per-second SAC-2 link between Brazil and the United States in early 2025, cutting transit charges for content-delivery networks by 18%. Meta's Project Waterworth diversified Brazilian routes in late 2024, reducing single-point-of-failure risk that previously plagued operators during anchor drag or seismic events. The new bandwidth lets cloud providers place larger cache nodes inside Sao Paulo and Santiago, serving consumers with sub-50-millisecond latency and stripping nearly 40% of peak-hour traffic from transcontinental trunks. Financial-services firms now gain dual-path network resilience that fulfils business-continuity mandates and nudges algorithmic-trading engines into regional halls.
Grid Unreliability and High Electricity Tariffs
Power instability and volatile tariffs remain the most acute short-term drag on the South America hyperscale data center market. Enel's November 2024 outage in Sao Paulo left 2.1 million customers without electricity for up to 72 hours, invoking force-majeure clauses that allowed tenants to suspend colocation payments. Industrial tariffs in Argentina jumped 38% during the same year after subsidy reductions, squeezing operating margins for facilities lacking hedged contracts. Chile's tariff regime is more stable, yet still commands a 9% premium over regional averages, prompting operators to negotiate interruptible-load deals that trade curtailment rights for 15% discounts. To maintain contractual uptime, a typical 20-megawatt hall in Sao Paulo now deploys 25 megawatts of on-site generation, which adds USD 3 million in up-front capex and USD 400,000 in recurring annual maintenance. The added expense deters latency-sensitive workloads such as real-time bidding engines, nudging those applications toward North American regions where five-nines uptime is standard.
Other drivers and restraints analyzed in the detailed report include:
- Renewable PPAs Leveraging Abundant Hydro-Solar-Wind
- Digital-Sovereignty Laws Mandating Local Hosting
- Skilled-Talent Shortage in HV Electrical and Mechanical O&M
For complete list of drivers and restraints, kindly check the Table Of Contents.
Segment Analysis
Hyperscale colocation is forecast to expand at 19.54% during 2026-2031, surpassing the 18.94% pace set for self-build campuses, and this divergence underpins a structural shift inside the South America hyperscale data center market. Self-build designs captured 55.76% of 2025 spending because hyperscalers prefer vertical integration that lets them fine-tune cooling topologies for AI workloads. Even so, extended utility lead times and tariff shocks in Brazil and Argentina have persuaded cloud majors to hedge with leased hall blocks that can be activated within 90 days, sidestepping the 18-month greenfield timeline. Amazon Web Services exemplified this approach by reserving 5 megawatts within Equinix SP11 to backstop its Sao Paulo cloud region during maintenance windows, demonstrating that even capital-rich players value agility. Financial-services firms bolster colocation growth because Banco Central do Brasil's operational-resilience rules stipulate geographic separation between primary and disaster-recovery footprints, a requirement most economically met through multi-campus leasing rather than proprietary duplication.
Interconnection density amplifies colocation's edge by clustering tenant servers near multiple cloud on-ramps, internet exchanges, and carrier meet-me rooms. Scala Data Centers reported that 42% of 2025 revenue originated from cross-connects and peering services rather than pure rack rental, reflecting how network effects create sticky occupancy and premium yields. By contrast, self-build estates often select ex-urban land parcels where real-estate costs are 30% lower but fiber routes limited, which can constrain latency-sensitive AI inference pipelines that require multi-cloud federation. As workloads evolve toward federated learning models demanding simultaneous access to multiple public clouds, the interconnection premium inside carrier-neutral campuses will likely sustain colocation's above-market growth. Consequently, the South America hyperscale data center market appears to be tilting toward a hybrid procurement mix in which even hyperscalers blend owned and leased capacity to balance capex discipline with speed-to-capacity.
IT hardware retained the largest 42.18% share of 2025 expenditure, yet mechanical systems are positioned for the fastest 19.62% CAGR because power density continues its structural climb. GPU arrays such as NVIDIA H100 already drive cabinet loads beyond 30 kilowatts, and direct-to-chip cold plates or rear-door heat exchangers capable of 45 kilowatts per rack are now mandatory for retrofit projects. Electrical outlays rise at 18.7% because a 20-megawatt hall needs a 25-megawatt utility connection to guarantee N+1 redundancy, which requires substation upgrades that easily exceed USD 2 million. General construction lags at 18.3% because operators increasingly lease pre-built shells from industrial landlords, deploying modular white-space kits rather than breaking raw ground. Schneider Electric's latest predictive-analytics layer synchronizes chiller sequencing with AI workload surges, trimming energy waste by 12%, while Arista's 800-gigabit Ethernet spine-leaf fabrics handle east-west traffic bursts that accompany model training cycles.
Rising rack heights to 52U and even 60U further shift mechanical bills because taller frames require engineered bracing, expanded cable management, and heavier-duty airflow doors. Network upgrades form an allied theme as hyperscalers adopt 400-gigabit and 800-gigabit optics to link training nodes, which triples fiber count per rack and necessitates higher static-pressure cooling fans. Storage architecture transformation toward NVMe-over-Fabrics has centralized flash pools, reducing per-terabyte cost by 18%, yet the heavier east-west network load places added stress on cooling loops. Mechanical suppliers gain pricing power as lead times for heat-exchanger cores stretch to 16 weeks, particularly when global AI demand funnels limited copper and aluminum inventory into Tier-1 regions first. The overall result is a mechanical-spend growth curve that now exceeds server refresh trajectories, a reversal of historic patterns inside the South America hyperscale data center market.
The South America Hyperscale Data Center Market Report is Segmented by Data Center Type (Hyperscale Self-Build, and Hyperscale Colocation), Component (IT Infrastructure, Electrical Infrastructure, Mechanical Infrastructure, and General Construction), Tier Standard (Tier III, and Tier IV), Data Center Size (Large, Massive, and Mega), and Country(Brazil, Chile, and More). The Market Forecasts are Provided in Terms of Value (USD).
List of Companies Covered in this Report:
- Amazon Web Services
- Microsoft Corporation
- Google LLC
- Meta Platforms Inc.
- Digital Realty (Ascenty)
- Equinix Inc.
- Scala Data Centers
- ODATA
- EdgeConneX
- Cirion Technologies
- NTT Global Data Centers
- Vantage Data Centers LLC
- Kio Networks
- Lumen Technologies
- IBM (Kyndryl)
- Oracle Corporation
- Tencent Holdings Ltd.
- Alibaba Group Holding Ltd.
- TIVIT
- Sonda S.A.
- Ativy Data Centers
- InterNexa
Additional Benefits:
- The market estimate (ME) sheet in Excel format
- 3 months of analyst support
TABLE OF CONTENTS
1 INTRODUCTION
- 1.1 Study Assumptions and Market Definition
- 1.2 Scope of the Study
2 RESEARCH METHODOLOGY
3 EXECUTIVE SUMMARY
4 MARKET LANDSCAPE
- 4.1 Market Overview
- 4.2 Market Drivers
- 4.2.1 Surge in Cloud-Region Launches by Hyperscalers
- 4.2.2 Sub-Sea Cable Landings Enhancing Latency and Redundancy
- 4.2.3 Renewable PPAs Leveraging Abundant Hydro-Solar-Wind
- 4.2.4 Digital-Sovereignty Laws Mandating Local Hosting
- 4.2.5 5G Open-RAN Roll-Outs Spawning Micro-Hyperscale Edge
- 4.2.6 Lithium-Mining AI and HPC Workloads Needing Local Capacity
- 4.3 Market Restraints
- 4.3.1 Grid Unreliability and High Electricity Tariffs
- 4.3.2 Skilled-Talent Shortage in HV Electrical and Mechanical O&M
- 4.3.3 Water-Stress Moratoria on Evaporative Cooling
- 4.3.4 GPU or Optic Allocation Bias Toward Tier-1 Regions
- 4.4 Industry Value Chain Analysis
- 4.5 Technological Outlook
- 4.6 Impact of Macroeconomic Factors on the Market
5 ARTIFICIAL INTELLIGENCE (AI) INCLUSION IN HYPERSCALE DATA CENTER (Sub-Segments are Subject to Change Depending on Availability of Data)
- 5.1 AI Workload Impact: Rise of GPU-Packed Racks and High Thermal Load Management
- 5.2 Rapid Shift toward 400G and 800G Ethernet Local OEM Integration and Compatibility Demands
- 5.3 Innovations in Liquid Cooling: Immersion and Cold Plate Trends
- 5.4 AI-Based Data Center Management (DCIM) Adoption Role of Cloud Providers
6 REGULATORY AND COMPLIANCE FRAMEWORK
7 KEY DATA CENTER STATISTICS
- 7.1 Existing Hyperscale Data Center Facilities in South America (in MW) (Hyperscale Self-Build VS Colocation)
- 7.2 List of Upcoming Hyperscale Data Center in South America
- 7.3 List of Hyperscale Data Center Operators in South America
- 7.4 Analysis on Data Center CAPEX in South America
8 MARKET SIZE AND GROWTH FORECASTS (VALUE)
- 8.1 By Data Center Type
- 8.1.1 Hyperscale Self-Build
- 8.1.2 Hyperscale Colocation
- 8.2 By Component
- 8.2.1 IT Infrastructure
- 8.2.1.1 Server Infrastructure
- 8.2.1.2 Storage Infrastructure
- 8.2.1.3 Network Infrastructure
- 8.2.2 Electrical Infrastructure
- 8.2.2.1 Power Distribution Units
- 8.2.2.2 Transfer Switches and Switchgears
- 8.2.2.3 UPS Systems
- 8.2.2.4 Generators
- 8.2.2.5 Other Electrical Infrastructure
- 8.2.3 Mechanical Infrastructure
- 8.2.3.1 Cooling Systems
- 8.2.3.2 Racks
- 8.2.3.3 Other Mechanical Infrastructure
- 8.2.4 General Construction
- 8.2.4.1 Core and Shell Development
- 8.2.4.2 Installation and Commissioning Services
- 8.2.4.3 Design Engineering
- 8.2.4.4 Fire Detection, Suppression and Physical Security
- 8.2.4.5 DCIM/BMS Solutions
- 8.2.1 IT Infrastructure
- 8.3 By Tier Standard
- 8.3.1 Tier III
- 8.3.2 Tier IV
- 8.4 By Data Center Size
- 8.4.1 Large ( Less than or equal to 25 MW)
- 8.4.2 Massive (Greater than 25 MW and Less than equal to 60 MW)
- 8.4.3 Mega (Greater than 60 MW)
- 8.5 By Country
- 8.5.1 Brazil
- 8.5.2 Chile
- 8.5.3 Colombia
- 8.5.4 Argentina
- 8.5.5 Peru
- 8.5.6 Rest of South America
9 COMPETITIVE LANDSCAPE
- 9.1 Market Share Analysis
- 9.2 Company Profiles (Includes Global level Overview, Market level overview, Core Segments, Financials as Available, Strategic Information, Market Rank/Share for Key Companies, Products and Services, and Recent Developments)
- 9.2.1 Amazon Web Services
- 9.2.2 Microsoft Corporation
- 9.2.3 Google LLC
- 9.2.4 Meta Platforms Inc.
- 9.2.5 Digital Realty (Ascenty)
- 9.2.6 Equinix Inc.
- 9.2.7 Scala Data Centers
- 9.2.8 ODATA
- 9.2.9 EdgeConneX
- 9.2.10 Cirion Technologies
- 9.2.11 NTT Global Data Centers
- 9.2.12 Vantage Data Centers LLC
- 9.2.13 Kio Networks
- 9.2.14 Lumen Technologies
- 9.2.15 IBM (Kyndryl)
- 9.2.16 Oracle Corporation
- 9.2.17 Tencent Holdings Ltd.
- 9.2.18 Alibaba Group Holding Ltd.
- 9.2.19 TIVIT
- 9.2.20 Sonda S.A.
- 9.2.21 Ativy Data Centers
- 9.2.22 InterNexa
10 MARKET OPPORTUNITIES AND FUTURE OUTLOOK
- 10.1 White-Space and Unmet-Need Assessment