
|
시장보고서
상품코드
2062480
온디맨드 창고 시장 : 시장 점유율 분석, 업계 동향 및 통계, 성장 예측(2026-2031년)On-demand Warehousing - Market Share Analysis, Industry Trends & Statistics, Growth Forecasts (2026 - 2031) |
||||||
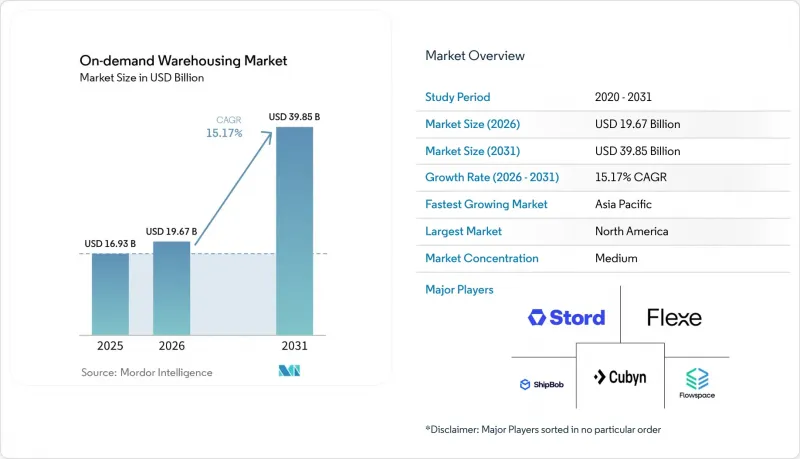
Mordor Intelligence에 의하면, 온디맨드 창고 시장은 2025년 169억 3,000만 달러로 평가되었고, 2026년 196억 7,000만 달러로 추정되고, 2031년까지 398억 5,000만 달러로 확대될 전망이며, 2026-2031년 CAGR 15.17%를 나타낼 것으로 예측됩니다.
인플레이션에 따른 임대료 변동에 대응하기 위해 변동비형 창고 용량의 도입이 급증하고 있는 데다, 팬데믹 이후 사업 연속성을 확보하기 위한 완충 장치 마련이 의무화됨에 따라, 신용 환경이 긴축되고 있음에도 불구하고 수요는 높은 수준을 유지하고 있습니다. 본 보고서는 서비스 유형별(창고 및 보관, 물류 및 풀필먼트, 부가가치 서비스), 보관 기간별(단기, 중기, 장기), 창고 규모별(소규모, 중규모, 대규모), 업종별(전자상거래 및 소매, 소비재 등) 및 지역별(북미 등)로 분류되어 있습니다. 시장 전망은 금액(달러) 기준으로 제시되어 있습니다.
세계 온디맨드 창고 시장 동향 및 인사이트
팬데믹 이후의 회복탄력성 전략이 오버플로 보관을 촉진하고 있습니다.
경영진 차원의 지침에 따르면, 순수한 비용 효율성보다 여유 용량을 우선시하도록 되어 있습니다. 이는 팬데믹 당시의 물자 부족이 기업 수익을 감소시키고 브랜드 충성도를 훼손했다는 교훈을 반영한 것입니다. 유연한 계약을 통해 고정 비용을 수요가 급증할 때만 발생하는 온디맨드 비용으로 전환함으로써, 서비스 수준을 유지하면서 유동성을 확보할 수 있습니다. 조사 결과, 가변 용량을 보유한 기업은 공급 중단으로부터의 회복 속도가 30% 더 빠른 것으로 나타났습니다. 수요가 가장 높은 분야는 가전제품이나 의류 등 변동성이 큰 부문이며, 이러한 분야에서는 재고 부족이 큰 기회 손실로 이어집니다. 그 결과, 즉시 활용 가능한 공간에 대한 프리미엄이 발생하여 온디맨드 창고 시장의 지속적인 성장을 뒷받침하고 있습니다.
인플레이션 연동에 따른 임대료 변동이 변동비형 계약을 촉진
에스컬레이션 조항으로 인해 기존의 리스는 예측 불가능해졌으며, 재무 담당자들은 유연한 창고 활용을 업무상의 도구이자 헤지 수단으로 인식하게 되었습니다. 사용량에 따른 요금 체계는 점유 비용과 수익 주기를 밀접하게 연계하여, 인플레이션 환경에서의 이익률 관리를 개선합니다. 공실 위험 증가에 직면한 임대인들은 계약 기간 단축을 제안하기 시작하며, 변동형 계약으로의 진입 장벽을 낮추고 있습니다. 기업들이 고정비와 변동비 구조를 재조정하는 가운데, 이러한 요인들이 맞물려 온디맨드 창고 시장에 대한 수요가 더욱 증가하고 있습니다.
창고 업계에서 근로자의 이직률이 급증하면서 서비스 수준의 신뢰도가 떨어지고 있습니다.
창고 운영 회사는 특히 연간 이직률이 30%를 초과하는 경우, 인력 유동화라는 중대한 과제에 직면해 있습니다. 이러한 높은 이직률은 채용 및 교육 비용을 증가시킬 뿐만 아니라 실수 발생 가능성을 높여, 결국 고객들이 풀필먼트 네트워크의 신뢰성에 대해 갖는 신뢰를 훼손하게 됩니다. 이에 대응하기 위해 운영사는 임금 인상과 반복 작업의 자동화에 주력하고 있습니다. 그러나 이러한 해결책은 간접비 증가를 수반하여, 고정 시설의 비용 효율성을 저해할 가능성이 있습니다.
부문별 분석
2025년 온디맨드 창고 시장 규모에서 창고 보관 및 관리 서비스는 54.28%의 점유율을 차지했으며, 해당 부문의 핵심 수익원으로서의 역할을 반영하고 있습니다. 그러나 상품의 대중화로 인해 이익률이 압박받고 있기 때문에 투자는 반품 처리, 키트 구성, 맞춤형 포장 등 프리미엄 요금이 부과되는 차별화된 서비스로 전환되고 있습니다. 부가가치 서비스는 규모는 작지만, 각 브랜드 기업이 경쟁 우위를 확보하기 위해 물류 운영 경험을 활용함에 따라 2031년까지 연평균 17.80%의 성장률을 보일 것으로 예상되며, 이는 기본적인 보관 서비스의 성장률을 상회하는 수치입니다. 업계에서는 유연성이 중요시되고 있지만, 창고 관리 시스템(WMS), OMS(주문 관리 시스템), 역물류를 원활하게 통합할 수 있는 공급업체들이 장기 계약을 따내고 있습니다. 이러한 전문화를 통해 고객의 전환 비용이 증가함에 따라, 인건비 및 보험료 상승분을 상쇄할 수 있는 단계적 가격 책정이 가능해집니다. 그 결과, 첨단 기술을 갖춘 물류센터는 신제품 출시나 시즌 한정 프로모션에서 전략적 파트너로서의 입지를 확고히 하며, 고객의 업무에 더욱 깊이 통합될 것입니다.
두 번째 요인은 신속한 SKU 구성, 정기 구독 박스 구성, 그리고 매우 신속한 반품 처리가 필요한 D2C(소비자 직접 판매) 모델의 확산입니다. 이러한 워크플로는 획일적인 시설로는 대응할 수 없어, 틈새 시장 사업자나 전문 거점을 연결하는 플랫폼에 대한 수요를 높이고 있습니다. 그 결과, 온디맨드 창고 시장은 양극화 추세를 이어가고 있습니다. 일반적인 용량 공급업체들은 주로 가격으로 경쟁하는 반면, 서비스 중심 거점들은 두 자릿수의 프리미엄 수익률을 추구하고 있습니다. 이러한 양극화는 대규모 사업자들이 가동률을 희생하지 않으면서도 서비스를 확충하기 위해 틈새 전문 업체를 인수하는 등, 지속적인 업계 재편을 촉진하고 있습니다.
2025년 기준으로 온디맨드 창고 시장의 52.11%를 단기 공간(1개월 이하)이 차지했으며, 이는 기업들이 장기 계약을 통한 비용 절감보다 민첩성을 더 중요시하고 있음을 반영합니다. 안전 재고를 줄여주는 AI 기반 예측 도구가 이러한 변화를 주도하고 있으며, 브랜드들은 몇 달 후가 아닌 며칠 후까지 생산 능력을 확보할 수 있게 되어, 예측 기간 동안 연평균 성장률(CAGR) 16.24%로 시장을 더욱 가속화하고 있습니다. 팬데믹으로 인한 혼란이 수습되는 가운데, 기업들은 불투명한 거시 수요를 배경으로 과도한 계약 체결을 경계하고 있으며, 팔레트 단가 상승에도 불구하고 유동성을 중시하고 있습니다. 항공사는 한정된 도크 용량과 실시간 수요 간의 균형을 맞추는 동적 가격 책정 엔진을 통해 변동성에 대응하고 있으며, 이는 마진을 확보하기 위한 항공사의 수익 관리 모델을 반영한 것입니다.
중기(1-6개월) 계약은 수요 예측이 가능한 계절성 사업에 대응하는 것으로, 해당 부문의 약 3분의 1을 차지하고 있습니다. 반면, 장기 계약(6개월 초과)은 재고 가시성이 향상됨에 따라 자본을 묶어둘 타당성이 줄어들면서 감소하는 추세에 있습니다. 그렇긴 하지만, 지정학적 충격에 대비해 전략적 완충 장치를 확보하고 있는 내구재 기업들은 여전히 고도로 자동화된 창고 시설 내의 장기 임대 계약을 중요하게 여기고 있습니다. 전반적으로 단기 계약의 확산은 용량 계획을 복잡하게 만들지만, 정교한 슬롯 배정 알고리즘을 통해 관리한다면 평방피트당 수익을 향상시킬 수 있으며, 평균 계약 기간이 단축되더라도 온디맨드 창고 시장은 수익 성장의 모멘텀을 유지할 수 있습니다.
지역별 분석
북미는 2025년에 35.06%의 시장 점유율을 유지했으나, 임금 인플레이션과 부동산 대출 긴축으로 인해 성장세가 둔화되고 있습니다. 강력한 3PL 생태계, 촘촘한 운송 네트워크, 그리고 WMS의 광범위한 도입이 지속적인 확장을 뒷받침하고 있지만, 주거지 인근의 새로운 구역 지정 규제로 인해 개발 기간이 길어지고 있습니다. 허리케인이 빈번히 발생하는 멕시코만 연안이나 산불 위험에 노출된 서부 주들에서 보험료가 상승하면서 비용 부담이 커지고, 이로 인해 고객들은 위험 프로파일이 낮은 내륙 지역으로 이동하고 있습니다. 미국 기업들은 자본을 확보하기 위해 세일 앤 리스백 거래를 점점 더 많이 활용하고 있으며, 온디맨드 창고 시장 모델에 부합하는 하이브리드 임대 구조를 통해 유연하게 대응할 수 있는 REIT로 소유권을 이전하고 있습니다.
아시아태평양에서는 제조업체들이 중국 이외 시장으로의 다각화를 추진하고 있으며, 인도, 인도네시아, 베트남에서 전자상거래의 확산이 가속화되고 있어 연평균 성장률(CAGR)은 17.57%로 견조한 모습을 보이고 있습니다. 정부 차원의 산업단지 우대 조치와 모바일 상거래의 급속한 확산이 맞물리면서, 교외 및 도심 지역의 소규모 부지에 대한 수요가 촉진되고 있습니다. '차이나 플러스 원(China Plus One)' 조달 전략을 활용하는 다국적 기업들은 아세안(ASEAN)에 지역 허브를 설립하고 있으며, 공급망 재구축이 진행되는 가운데 일시적인 보관 수요를 주도하고 있습니다. 이에 각 플랫폼은 이중 언어 인터페이스와 현지화된 결제 옵션을 추가하는 방식으로 대응하여, 해당 지역 내 중소기업들이 서비스를 쉽게 이용할 수 있도록 하고 있습니다.
유럽도 이에 뒤를 잇고 있습니다. 공유형 창고 모델을 뒷받침하는 견고한 ESG 규제의 지지를 받고 있습니다. 그러나 데이터 주권에 관한 규제가 통합의 걸림돌이 되어 대륙을 여러 개의 규제 구역으로 분할하고, 플랫폼의 운영 비용을 상승시키고 있습니다. 남미의 성장세는 멕시코로의 니어쇼어링과 브라질의 전자상거래 붐에 기인하고 있지만, 물류 인프라의 부족이 성장 속도를 저해하고 있습니다. 중동 및 아프리카에서는 자프자 물류 단지(Jafza Logistics Park)와 같은 대규모 자유무역지대 프로젝트가 현대적인 다중 임차형 창고를 제공하며, 이 지역을 아시아, 유럽, 아프리카를 잇는 중계 거점으로 자리매김하고 있습니다. 이러한 다양한 동향이 맞물리면서, 지역별 특성이 있음에도 불구하고 온디맨드 창고 시장은 전 세계적으로 두 자릿수 성장을 유지하고 있습니다.
기타 혜택 :
- 엑셀 형식 시장 예측(ME) 시트
- 3개월간의 애널리스트 지원
자주 묻는 질문
목차
제1장 서론
제2장 조사 방법
제3장 주요 요약
제4장 시장 구도
제5장 시장 규모 및 성장 예측
제6장 경쟁 구도
제7장 시장 기회 및 향후 전망
AJY 26.06.22According to Mordor Intelligence, the on-demand warehousing market is projected to expand from USD 16.93 billion in 2025 and USD 19.67 billion in 2026 to USD 39.85 billion by 2031, registering a 15.17% CAGR between 2026 and 2031.

Surging adoption of variable-cost capacity in response to inflation-linked lease volatility, coupled with mandates for post-pandemic resiliency buffers, is keeping demand elevated even as credit conditions tighten. This report is Segmented by Service Type (Warehousing and Storage, Distribution and Fulfilment, Value-Added Services), by Storage Duration (Short-Term, Medium-Term, Long-Term), by Warehouse Size (Small, Medium, Large), by Industry Vertical (E-Commerce and Retail, Consumer Packaged Goods, and More), and Geography (North America, and More). The Market Forecasts are Provided in Terms of Value (USD).
Global On-demand Warehousing Market Trends and Insights
Post-pandemic Resiliency Agendas Boosting Overflow Storage
Board-level mandates now prioritize overflow capacity over pure cost efficiency, reflecting lessons from pandemic shortages that cut revenue and eroded brand loyalty. Flexible contracts convert fixed costs into on-demand expenses that activate only during surges, preserving liquidity while protecting service levels. Research found companies with variable capacity recovered 30% faster from disruptions. Demand is strongest in volatile sectors such as consumer electronics and apparel, where stockouts carry steep opportunity costs. The resulting premium for readily activatable space underpins sustained growth in the on-demand warehousing market.
Inflation-linked Lease-rate Volatility Incentivizing Variable-cost Contracts
Escalation clauses have made traditional leases unpredictable, prompting finance chiefs to view flexible warehousing as both an operational and hedging tool. Usage-based pricing closely aligns occupancy cost with revenue cycles, improving margin control in inflationary environments. Landlords contending with rising vacancy risk have begun offering shorter terms, lowering barriers to variable arrangements. These factors collectively channel more volume toward the on-demand warehousing market as firms rebalance fixed and variable cost structures.
Soaring Warehouse Labor Turnover Undermining Service-level Reliability
Warehouse operators face a significant challenge with labor turnover, especially when attrition rates exceed 30% annually. Such high turnover not only escalates hiring and training expenses but also heightens the likelihood of errors, ultimately eroding client trust in the reliability of fulfillment networks. In response, operators have turned to offering higher wages and automating repetitive tasks. However, these solutions come with increased overhead costs, potentially diminishing the cost benefits of fixed facilities.
Other drivers and restraints analyzed in the detailed report include:
- Accelerated Reshoring / Nearshoring Creating Unplanned Inventory Buffers
- Retail Omni-channel Convergence Requiring Distributed Safety-stock Nodes
- Rising Insurance Premiums for Multi-tenant Facilities
For complete list of drivers and restraints, kindly check the Table Of Contents.
Segment Analysis
Warehousing and storage contributed to the on-demand warehousing market size in 2025, equal to 54.28% share, reflecting its role as the sector's core revenue stream. Yet commoditization is squeezing margins, steering investment toward differentiated offerings such as returns processing, kitting, and custom packaging that command premium rates. Value-added services, while smaller, are slated to expand 17.80% annually through 2031, outpacing basic storage as brands leverage fulfillment experience for competitive advantage. Providers able to integrate WMS, OMS, and reverse logistics seamlessly are winning long-term contracts despite the industry's preference for flexibility. This specialization raises switching costs for clients and supports tiered pricing that offsets rising labor and insurance expenses. In turn, technology-rich warehouses position themselves as strategic partners during product launches and seasonal promotions, further embedding themselves within client operations.
A second catalyst is the proliferation of direct-to-consumer models that require rapid SKU configuration, subscription box assembly, and hyper-responsive returns handling. These workflows are incompatible with one-size-fits-all facilities, reinforcing demand for niche operators or platform matching of specialized nodes. Consequently, the on-demand warehousing market continues to bifurcate: general capacity providers compete largely on price, while service-rich nodes chase double-digit premium yields. This divergence supports continued consolidation, as scale operators acquire niche specialists to broaden offerings without sacrificing utilization.
Short-term space (<= 1 month) accounted for 52.11% of the On-demand warehousing market share in 2025, reflecting enterprises' emphasis on agility over cost savings from longer commitments. AI-driven forecasting tools that reduce safety stocks are driving this shift, enabling brands to book capacity days rather than months in advance, further accelerating the market with a 16.24% CAGR over the forecast period. As pandemic disruptions recede, companies remain wary of over-committing amid uncertain macro demand, favoring liquidity despite higher per-pallet rates. Providers counter volatility through dynamic pricing engines that balance real-time demand with finite dock capacity, mirroring airline yield management models to protect margins.
Medium-term (1-6 months) contracts serve predictable seasonal businesses and account for roughly one-third of the segment, while long-term agreements (over 6 months) trend down as improved inventory visibility weakens the rationale for tying up capital. Nonetheless, durable goods firms that stock strategic buffers against geopolitical shocks still value extended leases within high-automation buildings. Overall, the prevalence of short spans complicates capacity planning but unlocks higher revenue per square foot when managed through sophisticated slotting algorithms, ensuring the on-demand warehousing market maintains its revenue growth momentum even as average contract length declines.
Geography Analysis
North America retained 35.06% market share in 2025, but growth moderates amid wage inflation and real estate credit tightening. Strong 3PL ecosystems, dense transportation networks, and widespread WMS adoption underpin continued expansion, yet new zoning restrictions near residential areas elevate development timelines. Insurance premiums in hurricane-prone Gulf Coast and wildfire-exposed Western states add cost pressure, nudging clients toward inland nodes with lower risk profiles. United States corporations increasingly deploy sale-leaseback deals to unlock capital, shifting ownership to REITs that are more open to hybrid lease structures aligned with the on-demand warehousing market model.
Asia Pacific is reflecting a strong 17.57% CAGR as manufacturers diversify beyond China and e-commerce penetration accelerates in India, Indonesia, and Vietnam. Government incentives for industrial parks, coupled with rapid adoption of mobile commerce, spur demand for suburban and urban micro-sites. Multinationals leveraging "China-plus-one" sourcing strategies establish regional hubs in ASEAN, driving transitory storage needs while supply chains recalibrate. Platforms have responded by adding bilingual interfaces and localized payment options, easing onboarding for SMEs across the region.
Europe follows closely, buoyed by robust ESG regulations that favor shared capacity models. However, data-sovereignty rules create integration hurdles, splitting the continent into multiple compliance zones that raise platform operating costs. South America's momentum stems from nearshoring to Mexico and Brazil's e-commerce boom, though logistics infrastructure gaps constrain speed. In the Middle East and Africa, large-scale free-zone projects such as Jafza Logistics Park offer modern multi-tenant warehousing, positioning the region as a trans-shipment hub between Asia, Europe, and Africa. Collectively, these diverse dynamics ensure the on-demand warehousing market maintains double-digit global growth despite regional idiosyncrasies.
- Flexe
- Flowspace
- Stord
- ShipBob
- Darkstore / FastAF
- Cubyn
- Stockspots
- SpaceFill
- Storeganise
- Saltbox
- Ohi
- NinjaVan Warehousing
- ShipHype
- Flexport Logistics Centers
- DHL Group
- GXO Logistics
- ShipHero
- Airhouse
- Parcelhub
- Extensiv
Additional Benefits:
- The market estimate (ME) sheet in Excel format
- 3 months of analyst support
TABLE OF CONTENTS
1 Introduction
- 1.1 Study Assumptions and Market Definition
- 1.2 Scope of the Study
2 Research Methodology
3 Executive Summary
4 Market Landscape
- 4.1 Market Overview
- 4.2 Market Drivers
- 4.2.1 Post-Pandemic Resiliency Agendas Boosting Overflow Storage
- 4.2.2 Inflation-Linked Lease-Rate Volatility Incentivizing Variable-Cost Contracts
- 4.2.3 Accelerated Reshoring / Nearshoring Creating Unplanned Inventory Buffers
- 4.2.4 Retail Omni-Channel Convergence Requiring Distributed Safety-Stock Nodes
- 4.2.5 Scope-3 Emission Reporting Propelling Platform-Enabled Idle-Space Sharing
- 4.2.6 Generative-AI Demand Forecasting Enabling Micro-Seasonal Capacity Swaps
- 4.3 Market Restraints
- 4.3.1 Soaring Warehouse Labor Turnover Undermining Service-Level Reliability
- 4.3.2 Rising Insurance Premiums for Multi-Tenant Facilities
- 4.3.3 Data-Sovereignty Laws Complicating Cross-Border WMS Deployments
- 4.3.4 Bank Credit Tightening Limiting Landlord Appetite for Short-Term Tenancies
- 4.4 Porter's Five Forces Analysis
- 4.4.1 Threat of New Entrants
- 4.4.2 Bargaining Power of Buyers
- 4.4.3 Bargaining Power of Suppliers
- 4.4.4 Threat of Substitutes
- 4.4.5 Competitive Rivalry
- 4.5 Value / Supply-Chain Analysis
- 4.6 Technological Innovations in the Industry
- 4.7 Government Regulations and Policies
- 4.8 Impact of Geopolitical Events on the Market
5 Market Size and Growth Forecasts
- 5.1 By Service Type
- 5.1.1 Warehousing and Storage
- 5.1.2 Distribution and Fulfilment
- 5.1.3 Value-added Services (kitting, returns)
- 5.2 By Storage Duration
- 5.2.1 Short-term (Less than 1 month)
- 5.2.2 Medium-term (1-6 months)
- 5.2.3 Long-term (More than 6 months)
- 5.3 By Warehouse Size
- 5.3.1 Small (less than 50 k sq ft)
- 5.3.2 Medium (50-200 k sq ft)
- 5.3.3 Large (greater than 200 k sq ft)
- 5.4 By Industry Vertical
- 5.4.1 E-commerce and Retail
- 5.4.2 Consumer Packaged Goods
- 5.4.3 Food and Beverage (incl. Cold-chain)
- 5.4.4 Healthcare and Pharma
- 5.4.5 Industrial and Manufacturing
- 5.4.6 Others
- 5.5 By Geography
- 5.5.1 North America
- 5.5.1.1 United States
- 5.5.1.2 Canada
- 5.5.1.3 Mexico
- 5.5.2 South America
- 5.5.2.1 Brazil
- 5.5.2.2 Peru
- 5.5.2.3 Chile
- 5.5.2.4 Argentina
- 5.5.2.5 Rest of South America
- 5.5.3 Asia-Pacific
- 5.5.3.1 India
- 5.5.3.2 China
- 5.5.3.3 Japan
- 5.5.3.4 Australia
- 5.5.3.5 South Korea
- 5.5.3.6 Southeast Asia (Singapore, Malaysia, Thailand, Indonesia, Vietnam, and Philippines)
- 5.5.3.7 Rest of Asia-Pacific
- 5.5.4 Europe
- 5.5.4.1 United Kingdom
- 5.5.4.2 Germany
- 5.5.4.3 France
- 5.5.4.4 Spain
- 5.5.4.5 Italy
- 5.5.4.6 BENELUX (Belgium, Netherlands, and Luxembourg)
- 5.5.4.7 NORDICS (Denmark, Finland, Iceland, Norway, and Sweden)
- 5.5.4.8 Rest of Europe
- 5.5.5 Middle East and Africa
- 5.5.5.1 United Arab Emirates
- 5.5.5.2 Saudi Arabia
- 5.5.5.3 South Africa
- 5.5.5.4 Nigeria
- 5.5.5.5 Rest of Middle East and Africa
- 5.5.1 North America
6 Competitive Landscape
- 6.1 Market Concentration
- 6.2 Strategic Moves
- 6.3 Market Share Analysis
- 6.4 Company Profiles {(Includes Global Level Overview, Market Level Overview, Core Segments, Financials as Available, Strategic Information, Market Rank/Share for Key Companies, Products and Services, and Recent Developments)}
- 6.4.1 Flexe
- 6.4.2 Flowspace
- 6.4.3 Stord
- 6.4.4 ShipBob
- 6.4.5 Darkstore / FastAF
- 6.4.6 Cubyn
- 6.4.7 Stockspots
- 6.4.8 SpaceFill
- 6.4.9 Storeganise
- 6.4.10 Saltbox
- 6.4.11 Ohi
- 6.4.12 NinjaVan Warehousing
- 6.4.13 ShipHype
- 6.4.14 Flexport Logistics Centers
- 6.4.15 DHL Group
- 6.4.16 GXO Logistics
- 6.4.17 ShipHero
- 6.4.18 Airhouse
- 6.4.19 Parcelhub
- 6.4.20 Extensiv
