
|
시장보고서
상품코드
2063697
매니지드 스위치 : 시장 점유율 분석, 업계 동향 및 통계, 성장 예측(2026-2031년)Managed Switch - Market Share Analysis, Industry Trends & Statistics, Growth Forecasts (2026 - 2031) |
||||||
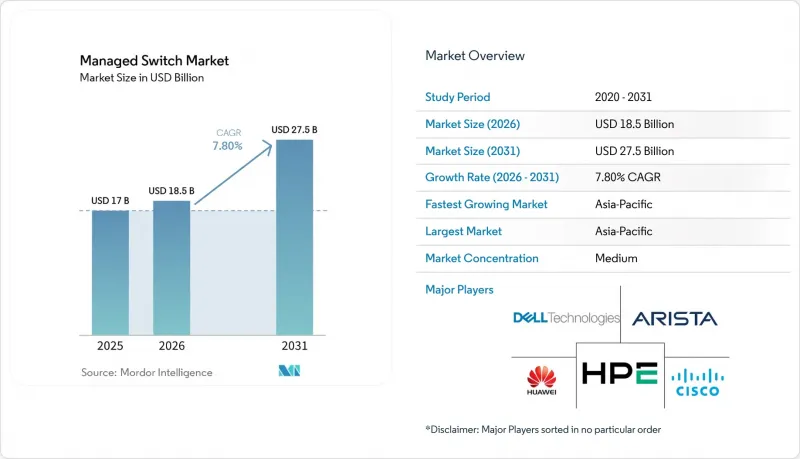
Mordor Intelligence에 의하면, 매니지드 스위치 시장 규모는 2025년 170억 달러로 평가되었습니다. 2026년 185억 달러에서 2031년까지 275억 달러로 확대되어 2026년부터 2031년까지 연평균 복합 성장률(CAGR)은 7.8%를 나타낼 것으로 예측됩니다.

본 보고서는 관리 기능(매니지드 및 스마트/라이트 매니지드), 포트 속도(패스트 이더넷, 기가비트 이더넷, 10기가비트 이더넷, 25/40기가비트 이더넷 및 100기가비트 이더넷 이상), 관리 아키텍처(온디바이스, 클라우드 관리 및 하이브리드), 최종 사용자 산업(IT 및 통신, 은행, 금융서비스 및 보험(BFSI), 정부·국방, 기타) 및 지역별로 분류되어 있습니다. 시장 전망은 금액(달러) 기준으로 제시되어 있습니다.
세계의 매니지드 스위치 시장 동향 및 인사이트
기가비트 및 멀티기가비트 캠퍼스 네트워크로의 전환이 가속화되고 있습니다.
Wi-Fi 6E 및 Wi-Fi 7 액세스 포인트가 기존의 기가비트 업링크 대역폭을 포화시키고 있어, 기업들은 설비를 교체할 수밖에 없는 상황에 처해 있습니다. 조지타운 대학교는 2025년에 4,000대의 액세스 포인트를 교체하고, 액세스 포인트당 5Gbps의 속도를 유지하기 위해 배포 스위치를 멀티 기가비트 모델로 업그레이드했습니다. 이와 유사한 병목 현상은 여러 대의 Wi-Fi 6E 클라이언트가 동시에 4K 동영상을 스트리밍하거나 대규모 데이터 세트를 동기화하는 기업 및 정부 기관의 캠퍼스에서도 발생하고 있습니다. 네트워크 팀은 슬롯별 업그레이드만으로는 충분하지 않다는 점을 깨닫고, 서비스 품질(QoS) 및 정밀한 모니터링 기능을 갖춘 관리형 디바이스로 스위치 스택 전체를 교체하고 있습니다. 비관리형 장비의 경우, 지연에 민감한 트래픽의 우선순위 지정이나 포트별 사용률의 가시화가 불가능하기 때문에 경제성 측면에서 관리형 스위치의 도입이 유리합니다. 그 결과, 고등교육 기관, 기업 본사, 공공시설에서 2.5GbE, 5GbE, 10 GbE를 지원하는 액세스 스위치에 대한 수요가 급증하고 있습니다.
매니지드 스위치 도입을 추진하는 에지부터 클라우드까지의 보안 요구 사항
제로 트러스트 아키텍처는 검사 및 세분화을 네트워크의 모든 홉으로 이전하여, 액세스 스위치를 적용 엔진으로 전환합니다. 포티넷은 2024년, 방화벽 규칙을 FortiSwitch 하드웨어에 직접 내장함으로써, 중앙 집중형 어플라이언스를 통해 트래픽을 헤어핀 연결할 필요 없이 마이크로 세분화을 구현했습니다. PCI-DSS나 HIPAA와 같은 프레임워크에서는 기밀성이 높은 트래픽을 격리된 상태로 유지해야 하므로, 금융 서비스 및 의료 분야의 사업자들이 이를 조기에 도입하고 있습니다. 라이선싱 기능
특수 스위칭 ASIC 공급망의 변동
브로드컴은 엔터프라이즈 및 데이터센터용 스위치용 범용 실리콘 시장의 상당 부분을 차지하고 있기 때문에 생산에 어떠한 차질이 발생하더라도 전체 공급업체에 파급 효과가 미칩니다. 구글은 향후 설계를 마블 실리콘으로 전환했으나, 이러한 변경 사항은 마블의 2025년도 결산에서 밝혀졌으며, 단일 공급업체에 대한 의존으로 인한 고객들의 우려를 부각시켰습니다. TSMC 등 파운드리 업체들의 3nm 및 5nm 공정 웨이퍼 생산 능력 부족으로 인해, 스위칭 ASIC의 리드타임이 52주를 초과하고 있습니다. 할당량을 확보하지 못한 중소 벤더들은 효율이 낮은 구형 칩을 출하하거나, 출시를 연기해 시장 점유율을 잃는 두 가지 선택지 중 하나를 택해야 합니다. Tier 1 OEM 제조업체는 선불 결제를 통해 파운드리 생산 할당량을 확보할 수 있지만, 보다 광범위한 매니지드 스위치 시장에서는 간헐적인 공급 부족이 발생하고 있으며, 이로 인해 매출 인식이 저해되고 재고 비용이 증가하고 있습니다.
부문별 분석
엔터프라이즈급 플랫폼은 고급 라우팅 기능과 보안 기능을 강점으로 삼아, 2025년에는 매니지드 스위치 시장의 64.8%를 차지했습니다. 스마트하고 가벼운 관리형 디바이스는 복잡성을 숨겨주며, 전문가가 아닌 사용자도 단 몇 분 만에 지점을 구축할 수 있게 해주는 클라우드 컨트롤러 덕분에 연평균 성장률(CAGR) 10.42%의 성장이 예상됩니다. 엔터프라이즈용 장비가 누려왔던 매니지드 스위치 시장 규모에서의 우위는 새로운 스마트 플랫폼이 하이엔드 ASIC을 채택하여 더 낮은 비용으로 라인 레이트 성능을 구현함에 따라 점차 줄어들고 있습니다. 각 벤더사는 다년 계약 방식의 클라우드 구독 서비스를 묶음 상품으로 제공함으로써 계약 조건을 매력적으로 만들고, 설비 투자를 운영비로 전환하며, 예산의 예측 가능성을 높이고 있습니다. 그러나 클라우드 도메인 간 마이그레이션 시에는 모든 스위치의 재프로비저닝이 필요하고, 담당자가 워크플로를 다시 익혀야 하기 때문에 고객은 락인 현상에 직면하게 됩니다. 예측 기간 동안 스위치를 50대 미만으로 보유한 조직은 클라우드 우선 방식의 스마트 디바이스로 직접 전환할 것으로 예상되지만, 포춘 1000대 기업은 세밀한 가시성을 확보하기 위해 On-Premise 기반 제어를 계속 선호할 것으로 보입니다.
2차 공급업체들은 제조 프로토콜에 맞추어 사전 설정된 견고한 스마트 스위치 등 업계 특화형 펌웨어를 제공함으로써 틈새 시장을 개척하고 있습니다. 그 결과, 조달 결정에 있어 기능의 폭과 업계에 대한 심도 있는 이해가 모두 점점 더 중요시되고 있습니다. 매니지드 스위치 업계에서는 2계층 구조의 채널 전략이 등장할 것으로 보입니다. 즉, 전 세계 OEM 업체들은 풀스택 솔루션에 주력하고, 지역 전문 업체들은 규정 준수 및 환경 측면의 세부적인 요건에 대응한다는 것입니다.
2025년에도 기가비트 지원 장치는 매니지드 스위치 시장 점유율의 46.35%를 차지했습니다. 이는 대부분의 노트북과 IoT 센서의 최대 통신 속도가 1Gbps이기 때문입니다. 그러나 데이터센터 내의 동서 방향 트래픽이 급증함에 따라, 100GbE 이상의 스위치 시장은 연평균 성장률(CAGR) 9.51%로 급성장할 것으로 전망됩니다. 2025년에 출시된 Arista의 800 GbE 7060X6은 1RU에 64개의 포트를 탑재하고 있으며, 이전 세대 모델에 비해 전력 효율을 40% 향상시켰습니다. 얼리 어답터는 초고속으로 기울기 정보를 교환하는 대규모 언어 모델을 훈련하고 있는 하이퍼스케일러 기업입니다. 모듈당 1만 달러를 넘는 광모듈의 비용이 보급의 걸림돌이 되고 있기 때문에 많은 기업들은 규격이 확정되는 대로 1.6 Tbps로 단숨에 전환할 것입니다. 중견 기업의 구매 담당자들은 비용, 전력 소비, 용량의 균형을 고려하여 랙 상단 연결에는 여전히 10 GbE 및 25GbE를 채택하고 있습니다. 그 결과, 하이엔드 관리형 스위치 시장 규모 확대는 중속 대역 수요가 정체되어 있는 탓에 일부 상쇄되고 있습니다.
5nm 공정의 수율 향상과 실리콘 포토닉스를 통한 부품 가격 하락으로 인해 이 격차는 점차 좁혀질 것으로 보이지만, CFO는 여전히 기가비트당 비용을 신중하게 검토하고 있습니다. 각 벤더사는 단순한 처리량뿐만 아니라, 실시간 혼잡 제어, AI 워크로드용 지터 감소, 가시성 스택용 플로우 텔레메트리 기능 등을 통해 차별화를 꾀하고 있습니다.
지역별 분석
아시아태평양은 2025년에 매니지드 스위치 시장의 34.1%를 차지하며 1위를 차지했으며, 2031년까지 연평균 성장률(CAGR) 9%를 나타낼 것으로 전망됩니다. 2025년에 주목받은 19.4GW 규모의 데이터센터 건설 계획은 말레이시아 조호르주와 인도 뭄바이에 집중되어 있으며, 스파인 및 탑 오브 랙 플랫폼 수주를 뒷받침하고 있습니다. 인도의 ‘BharatNet 3단계’는 14조 루피(161억 달러)를 투자해 21만 4,000개의 마을 클러스터에 광섬유를 확장하고 있으며, 이 모든 구간은 대칭형 기가비트 관리형 액세스 스위치로 종단 처리됩니다. 인도와 베트남의 데이터 현지화 법에 따라 하이퍼스케일러들은 국내 시설 건설을 강요받고 있으며, 이에 따라 고속 집약형 장비에 대한 수요가 증가하고 있습니다. 한편, 공급망 다각화에 따라 제조업체들은 베트남과 말레이시아로 진출하고 있으며, 이들 지역에 신설되는 스마트 팩토리에서는 가동 첫날부터 TSN을 지원하는 산업용 스위치가 채택되고 있습니다.
북미는 2위를 차지했으며, 이는 고등교육 기관의 캠퍼스 현대화 및 농촌 지역의 광섬유 인프라 구축에 425억 달러를 투자하는 ‘광대역 형평성·접근성·배포(BEAD)’ 프로그램의 지원 덕분입니다. 미국의 기업에서는 Wi-Fi 7 지원 단말기 및 IoT 센서를 지원하기 위해 멀티 기가비트 PoE가 도입되고 있으며, 이를 통해 안정적인 업데이트 주기가 촉진되고 있습니다. 유럽에서는 ‘Connecting Europe Facility Digital’ 프로그램의 혜택을 받고 있습니다. 이 프로그램에서는 첨단 광통신 및 라우팅 기능을 갖춘 관리형 스위치를 기반으로 한 백본 업그레이드에 8억 6,500만 유로(9억 7,500만 달러)가 배정되었습니다.
중동에서는 소버린 클라우드 관련 지침을 계기로, AWS가 사우디아라비아에 50억 달러 이상을 투자할 계획인 등 하이퍼스케일 규모의 투자가 잇따르고 있습니다. 이러한 인프라 구축에서는 고도의 암호화 기능과 규정 준수 보고 기능을 갖춘 장비가 선호되고 있습니다. 남미와 아프리카는 현재 규모는 작지만, 통신 사업자들이 광 백홀을 구축하고 각국 정부가 디지털 포용을 우선시하고 있어 견조한 성장세를 보이고 있습니다. 각 공급업체들은 아시아태평양에서는 가격 압박, 중동에서는 높은 이익률, 신흥 시장에서는 결제 주기의 장기화에 직면해 있어, 다양한 시장 진출 전략이 요구되고 있습니다.
기타 혜택 :
- 엑셀 형식 시장 예측(ME) 시트
- 3개월간의 애널리스트 지원
자주 묻는 질문
목차
제1장 서론
제2장 조사 방법
제3장 주요 요약
제4장 시장 구도
제5장 시장 규모 및 성장 예측
제6장 경쟁 구도
제7장 시장 기회 및 향후 전망
KTH 26.06.24According to Mordor Intelligence, the managed switch market size is projected to expand from USD 17 billion in 2025 and USD 18.5 billion in 2026 to USD 27.5 billion by 2031, registering a CAGR of 7.8% between 2026 to 2031.
This report is Segmented by Managed Capability (Managed, and Smart/Light Managed), Port Speed (Fast Ethernet, Gigabit Ethernet, 10 Gigabit Ethernet, 25/40 Gigabit Ethernet, and ≥100 Gigabit Ethernet), Management Architecture (On-Device, Cloud-Managed, and Hybrid), End User Industry (IT and Telecom, BFSI, Government and Defense, and More), and Geography. The Market Forecasts are Provided in Terms of Value (USD).
Global Managed Switch Market Trends and Insights
Accelerated Migration to Gigabit and Multi-Gigabit Campus Networks
Enterprises are in the midst of a forced refresh because Wi-Fi 6E and Wi-Fi 7 access points saturate legacy gigabit uplinks. Georgetown University swapped 4,000 access points in 2025 and refreshed its distribution switches with multi-gigabit models to sustain 5 Gbps per access point. Similar bottlenecks are showing up in corporate and government campuses where multiple Wi-Fi 6E clients concurrently stream 4K video or sync large datasets. Network teams find that slot-by-slot upgrades are insufficient, so entire switch stacks are replaced with managed devices supporting quality-of-service and granular monitoring. The economics favor managed switch market deployments because unmanaged units cannot prioritize latency-sensitive traffic or expose per-port utilization. As a result, demand for 2.5 GbE, 5 GbE and 10 GbE access switches is accelerating across higher education, corporate headquarters and public-sector buildings.
Edge-to-Cloud Security Requirements Driving Managed Switch Adoption
Zero-trust architecture shifts inspection and segmentation into every hop of the network, turning access switches into enforcement engines. Fortinet embedded its firewall rules directly into FortiSwitch hardware in 2024, enabling micro-segmentation without hair-pinning traffic through centralized appliances. Financial-services and healthcare operators are early adopters because frameworks such as PCI-DSS and HIPAA require sensitive flows to remain isolated. Managed switches equipped with posture assessment can quarantine non-compliant devices in real time and feed telemetry to security information and event-management tools. This moves the managed switch market beyond basic connectivity toward an active security role, which increases attach rates for licenses and maintenance contracts. Vendors that integrate analytics and automation gain an advantage as enterprises seek platforms that merge networking and security skill sets.
Supply Chain Volatility for Specialized Switching ASICs
Broadcom commands most of the merchant silicon in enterprise and data-center switches, so any production hiccup reverberates across vendors. Google moved future designs to Marvell silicon, a shift disclosed in Marvell's fiscal 2025 earnings, highlighting customer concern about dependence on a single supplier. Tight 3-nm and 5-nm wafer capacity at foundries such as TSMC has pushed lead times for switching ASICs beyond 52 weeks. Smaller vendors without secured allocations either ship older, less efficient chips or delay launches, surrendering share. While tier-one OEMs can pre-pay and lock foundry slots, the broader managed switch market faces intermittent shortages that impede revenue recognition and inflate inventory costs.
Other drivers and restraints analyzed in the detailed report include:
- Industrial Ethernet Expansion in Smart Factories
- Rising Demand for Power over Ethernet in Converged Networks
- Growing Preference for Wireless-First Architectures in SMBs
For complete list of drivers and restraints, kindly check the Table Of Contents.
Segment Analysis
Enterprise-grade platforms held 64.8% of the managed switch market in 2025 on the strength of deep routing and security features. Smart and light managed devices are on track for a 10.42% CAGR thanks to cloud controllers that hide complexity and let non-specialists roll out branch offices in minutes. The managed switch market size advantage enjoyed by enterprise gear narrows as newer smart platforms adopt high-end ASICs, delivering line-rate performance at lower cost. Vendors sweeten deals by bundling multiyear cloud subscriptions, converting capital spend to operating expense and improving budget predictability. However, customers face lock-in when migrating between cloud domains because every switch needs re-provisioning and staff must relearn workflows. Over the forecast, organizations with fewer than 50 switches are expected to jump straight to cloud-first smart devices, while Fortune 1000 enterprises continue to favor on-premises control for granular visibility.
Second-tier suppliers are carving niches by offering vertical-specific firmware, for example, ruggedized smart switches pre-configured for manufacturing protocols. As a result, procurement decisions increasingly weigh both feature breadth and vertical depth. The managed switch industry is likely to witness a two-tier channel strategy: global OEMs focus on full-stack solutions, and regional specialists address compliance or environmental nuances.
Gigabit devices still comprised 46.35% of the managed switch market share in 2025 because most laptops and IoT sensors max out at 1 Gbps. Yet switches rated at 100 GbE and higher are forecast to sprint at a 9.51% CAGR as east-west traffic inside data centers mushrooms. Arista's 800 GbE 7060X6, launched in 2025, delivers 64 ports in a single rack unit, achieving 40% better power efficiency than its prior generation. Early adopters are hyperscalers training large language models that exchange gradients at extreme speeds. Optics cost, north of USD 10,000 per module, restrains broader uptake, so many enterprises will leapfrog to 1.6 Tbps once standards firm up. Mid-tier buyers remain on 10 GbE and 25 GbE for top-of-rack connections because they balance cost, power and capacity. Consequently, the managed switch market size expansion at the high end is offset partly by plateauing demand in mid-range speeds.
Component price declines, driven by 5 nm yields and silicon photonics, should gradually close the gap, yet CFOs still weigh the dollar per delivered gigabit carefully. Vendors differentiate through real-time congestion control, reduced jitter for AI workloads and flow-telemetry hooks for observability stacks rather than raw throughput alone.
Geography Analysis
Asia-Pacific led with 34.1% of the managed switch market in 2025 and is forecast to post a 9% CAGR through 2031. A 19.4-GW data-center construction pipeline spotlighted in 2025, concentrated in Johor, Malaysia and Mumbai, India, underpins orders for spine and top-of-rack platforms. India's BharatNet Phase 3, funded at INR 1.4 lakh crore (USD 16.1 billion), is extending fiber to 214,000 village clusters, all terminating in symmetrical-gigabit managed access switches. Data-localization statutes in India and Vietnam prompt hyperscalers to build domestic facilities, elevating demand for high-speed aggregation gear. Meanwhile, supply-chain diversification is pushing manufacturers into Vietnam and Malaysia, where newly built smart factories specify TSN-ready industrial switches from day one.
North America ranks second, buoyed by higher-education campus refreshes and the Broadband Equity, Access and Deployment program, which directs USD 42.5 billion toward rural fiber builds. Enterprises across the United States are adopting multi-gigabit PoE to support Wi-Fi 7 handsets and IoT sensors, driving steady replacement cycles. Europe benefits from the Connecting Europe Facility Digital program, which earmarked EUR 865 million (USD 975 million) for backbone upgrades that rely on managed switches with advanced optical and routing features.
The Middle East, spurred by sovereign-cloud directives, is attracting hyperscale investments such as AWS's plan to invest more than USD 5 billion in Saudi Arabia. These builds prefer equipment that offers advanced encryption and compliance reporting. South America and Africa are smaller today yet post healthy growth as operators roll out fiber backhaul and governments prioritize digital inclusion. Vendors face price pressure in Asia-Pacific, premium margins in the Middle East, and elongated payment cycles in emerging markets, requiring diversified go-to-market tactics.
- Cisco Systems, Inc.
- Juniper Networks, Inc.
- Hewlett Packard Enterprise Company
- Arista Networks, Inc.
- Huawei Technologies Co., Ltd.
- Extreme Networks, Inc.
- Dell Technologies Inc.
- D-Link Corporation
- TP-Link Technologies Co., Ltd.
- Netgear, Inc.
- Fortinet, Inc.
- ZTE Corporation
- Edgecore Networks Corporation
- Allied Telesis Holdings K.K.
- Avaya LLC
- MikroTik SIA
- H3C Technologies Co., Limited
- Lenovo Group Limited
- Ubiquiti Inc.
- ALE International SAS (Alcatel-Lucent Enterprise)
Additional Benefits:
- The market estimate (ME) sheet in Excel format
- 3 months of analyst support
TABLE OF CONTENTS
1 INTRODUCTION
- 1.1 Study Assumptions and Market Definition
- 1.2 Scope of the Study
2 RESEARCH METHODOLOGY
3 EXECUTIVE SUMMARY
4 MARKET LANDSCAPE
- 4.1 Market Overview
- 4.2 Market Drivers
- 4.2.1 Accelerated Migration to Gigabit and Multi-Gigabit Campus Networks
- 4.2.2 Edge-to-Cloud Security Requirements Driving Managed Switch Adoption
- 4.2.3 Industrial Ethernet Expansion in Smart Factories
- 4.2.4 Rising Demand for Power over Ethernet (PoE) in Converged Networks
- 4.2.5 Government-Backed Broadband Modernization Programs
- 4.2.6 AI-Optimized Network Management Platforms Reducing OPEX
- 4.3 Market Restraints
- 4.3.1 Supply Chain Volatility for Specialized Switching ASICs
- 4.3.2 Growing Preference for Wireless-First Architectures in SMBs
- 4.3.3 Cyber-Security Skill Shortage Hindering Complex Switch Deployments
- 4.3.4 Increasing Adoption of White-Box Switching by Hyperscalers
- 4.4 Industry Ecosystem Analysis
- 4.5 Regulatory Landscape
- 4.6 Technological Outlook
- 4.7 Impact of Macroeconomic Factors on the Market
- 4.8 Porter's Five Forces Analysis
- 4.8.1 Threat of New Entrants
- 4.8.2 Bargaining Power of Suppliers
- 4.8.3 Bargaining Power of Buyers
- 4.8.4 Threat of Substitutes
- 4.8.5 Competitive Rivalry
5 MARKET SIZE AND GROWTH FORECASTS (VALUE)
- 5.1 By Managed Capability
- 5.1.1 Managed (Enterprise-grade)
- 5.1.2 Smart/Light Managed (SMB/edge)
- 5.2 By Port Speed
- 5.2.1 Fast Ethernet (<=100 Mb/s)
- 5.2.2 Gigabit Ethernet (1 Gb/s)
- 5.2.3 10 Gigabit Ethernet
- 5.2.4 25/40 Gigabit Ethernet
- 5.2.5 >=100 Gigabit Ethernet
- 5.3 By Management Architecture
- 5.3.1 On-device (CLI/Web)
- 5.3.2 Cloud-managed
- 5.3.3 Hybrid
- 5.4 By End User Industry
- 5.4.1 IT and Telecom
- 5.4.2 BFSI
- 5.4.3 Manufacturing
- 5.4.4 Healthcare
- 5.4.5 Education
- 5.4.6 Government and Defense
- 5.4.7 Energy and Utilities
- 5.4.8 Other End User Industries
- 5.5 By Geography
- 5.5.1 North America
- 5.5.1.1 United States
- 5.5.1.2 Canada
- 5.5.1.3 Mexico
- 5.5.2 South America
- 5.5.2.1 Brazil
- 5.5.2.2 Argentina
- 5.5.2.3 Rest of South America
- 5.5.3 Europe
- 5.5.3.1 Germany
- 5.5.3.2 United Kingdom
- 5.5.3.3 France
- 5.5.3.4 Italy
- 5.5.3.5 Spain
- 5.5.3.6 Russia
- 5.5.3.7 Rest of Europe
- 5.5.4 Asia-Pacific
- 5.5.4.1 China
- 5.5.4.2 Japan
- 5.5.4.3 India
- 5.5.4.4 South Korea
- 5.5.4.5 Australia and New Zealand
- 5.5.4.6 Rest of Asia-Pacific
- 5.5.5 Middle East
- 5.5.5.1 Saudi Arabia
- 5.5.5.2 United Arab Emirates
- 5.5.5.3 Turkey
- 5.5.5.4 Rest of Middle East
- 5.5.6 Africa
- 5.5.6.1 South Africa
- 5.5.6.2 Nigeria
- 5.5.6.3 Rest of Africa
- 5.5.1 North America
6 COMPETITIVE LANDSCAPE
- 6.1 Market Concentration
- 6.2 Strategic Moves
- 6.3 Market Share Analysis
- 6.4 Company Profiles (includes Global Level Overview, Market Level Overview, Core Segments, Financials as available, Strategic Information, Market Rank/Share, Products and Services, Recent Developments)
- 6.4.1 Cisco Systems, Inc.
- 6.4.2 Juniper Networks, Inc.
- 6.4.3 Hewlett Packard Enterprise Company
- 6.4.4 Arista Networks, Inc.
- 6.4.5 Huawei Technologies Co., Ltd.
- 6.4.6 Extreme Networks, Inc.
- 6.4.7 Dell Technologies Inc.
- 6.4.8 D-Link Corporation
- 6.4.9 TP-Link Technologies Co., Ltd.
- 6.4.10 Netgear, Inc.
- 6.4.11 Fortinet, Inc.
- 6.4.12 ZTE Corporation
- 6.4.13 Edgecore Networks Corporation
- 6.4.14 Allied Telesis Holdings K.K.
- 6.4.15 Avaya LLC
- 6.4.16 MikroTik SIA
- 6.4.17 H3C Technologies Co., Limited
- 6.4.18 Lenovo Group Limited
- 6.4.19 Ubiquiti Inc.
- 6.4.20 ALE International SAS (Alcatel-Lucent Enterprise)
7 MARKET OPPORTUNITIES AND FUTURE OUTLOOK
- 7.1 White-Space and Unmet-Need Assessment
