
|
시장보고서
상품코드
2073139
액세스 계층 스위치 시장 : 점유율 분석, 업계 동향과 통계, 성장 예측(2026-2031년)Access Layer Switch - Market Share Analysis, Industry Trends & Statistics, Growth Forecasts (2026 - 2031) |
||||||
 Mordor Intelligence
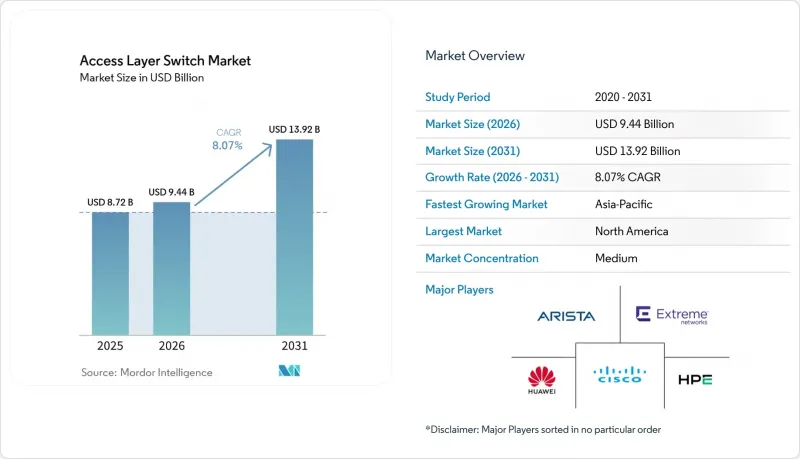
Mordor Intelligence에 의하면, 액세스 계층 스위치 시장 규모는 2025년 87억 2,000만 달러, 2026년 94억 4,000만 달러에서 2031년까지 139억 2,000만 달러로 확대한다고 예측되고 있어 2026년부터 2031년까지 연평균 복합 성장률(CAGR)은 8.07%를 나타낼 전망입니다.
본 보고서는 포트 속도(1 GbE 이하, 2.5/5GbE 멀티기가, 기타), 포트 밀도(스몰 폼 팩터, 미드레인지, 고밀도, 기타), 최종 사용자 기업 규모(대기업, 중소기업), 최종 사용자 산업 분야(IT 및 통신, 은행, 금융서비스 및 보험(BFSI), 헬스케어 및 생명과학, 제조, 정부·국방, 기타), 지역별로 분류되어 있습니다. 시장 전망은 금액(달러) 기준으로 제시되어 있습니다.
전 세계 액세스 계층 스위치 시장 동향 및 인사이트
교육 분야에서의 캠퍼스 디지털화 가속화
대학에서는 하이브리드 학습, IoT 지원 캠퍼스, 그리고 멀티 기가비트 처리량에 의존하는 연구 클러스터를 지원하기 위해 레거시 스위치의 교체가 진행되고 있습니다. 2025년에 미국 고등교육 기관의 IT 책임자를 대상으로 실시한 설문조사에 따르면, 60%가 2년 이내에 네트워크 업그레이드를 계획하고 있는 것으로 나타났습니다. UCLA는 4만 5,000명의 학생을 대상으로 Wi-Fi 6E 서비스를 지원하기 위해 419개 건물에 2.5GbE를 지원하는 Catalyst 9000 스위치를 도입했습니다(CISCO.COM). 워싱턴 대학교는 대규모 역할 기반 세분화를 구현하기 위해 HPE Aruba CX 스위치를 도입했습니다. 동적 프로비저닝과 클라우드 오케스트레이션 덕분에 업데이트 주기가 단축되면서, 학술 기관은 액세스 계층 스위치 시장에서 꾸준한 성장세를 보이고 있습니다.
Wi-Fi 6 및 Wi-Fi 7 액세스 포인트 도입이 급증하고 있습니다.
Wi-Fi 7은 2025년 말까지 주류가 될 전망이며, 현재 기업들의 무선 관련 지출에서 상당한 비중을 차지하고 있습니다. IEEE 802.11be를 지원하는 무선 기기에는 멀티 기가비트급 업링크가 요구되지만, IEEE 802.3bz 규격 덕분에 기업들은 배선 공사로 인한 혼란 없이 기존의 Cat 5e 및 Cat 6 케이블을 재사용할 수 있게 되었습니다. Arista와 Dell은 단일 소프트웨어 플레인 아래에서 무선 텔레메트리를 통합한 2.5/5GbE 지원 캠퍼스 스위치를 발표했습니다. IEEE 802.3bt 규격에 따라 Power-over-Ethernet의 전력 공급 한도가 포트당 90W로 상향 조정됨에 따라, 1GbE 전용 플랫폼의 폐지가 더욱 가속화되고 있습니다.
범용 스위치용 ASIC 공급망 변동
Tomahawk, Trident, Jericho 칩 분야에서 Broadcom이 사실상 독점하고 있는 상황이 리스크를 집중시키고 있습니다. TSMC의 첨단 노드 리드타임은 2024년 초 6주에서 2025년 말에는 6개월로 늘어났으며, 공급업체들은 재고 배분 제한을 피할 수 없게 되었습니다. 수출 규제의 불확실성과 다층 PCB의 병목 현상도 공급 상황에 추가적인 압박을 가하고 있습니다. 마블이나 인텔이 개발한 대체 실리콘 칩이 존재하기는 하지만, 재설계 주기가 2년을 넘기 때문에 당분간은 브로드컴에 대한 의존이 지속될 것으로 보입니다.
부문별 분석
기존의 1 GbE 이하 포트는 2025년에 52.18%의 시장 점유율을 차지했습니다. 이는 레거시 엔드포인트의 도입 기반과, 지원 종료 시한이 다가올 때까지 인프라 업데이트를 미루는 조직의 경제적 관성에 의해 뒷받침되고 있습니다. IEEE 802.3bz를 기반으로 하는 2.5/5GbE 계층은 2031년까지 연평균 성장률(CAGR) 12.84%를 기록하며, 다른 모든 속도 등급을 능가하는 성장을 보일 것으로 전망됩니다. 기업들은 멀티기가를 기존의 1 GbE 엔드포인트와 향후 도입될 10 GbE 광섬유를 연결하는 가교로 삼아, 기존의 동선 배선을 유지하면서 Wi-Fi 7의 백홀 요구 사항을 충족하고 있습니다. 벤더의 로드맵에 따르면, 현재 멀티기가 및 IEEE 802.3bt의 전력 예산이 표준으로 자리 잡고 있으며, 1 GbE가 점차 유지보수 모드로 전환될 것임을 시사하고 있습니다.
성숙기에 접어든 10 GbE 광 모듈은 가격 하락에 따라 업링크 및 서버 액세스를 지원하고 있지만, 25/40 GbE 이상은 이스트-웨스트 방향의 처리량이 필요한 데이터센터 랙에 여전히 집중되어 있습니다. 멀티기가 액세스 계층 스위치 시장 규모는 2028년까지 1 GbE와 실질적으로 동일한 수준에 도달할 것으로 예상되며, 새로운 표준으로서의 입지가 확고해질 것입니다. 동시에, 상호 운용성 향상과 벤더 간 표준화를 통해 도입 장벽이 낮아지면서, 멀티기가 인프라의 전사적 도입이 가속화되고 있습니다.
2025년 배선실 시장에서는 구형 장비의 대수가 많기 때문에 24-48포트급 중급 기종이 42.26%의 시장 점유율을 차지하며 시장을 주도했으나, 교체 예산은 포트당 전력 소비를 줄이는 대형 고정 폼팩터 모델로 점점 더 이동하고 있습니다. 고밀도 48-96포트 스위치는 캠퍼스 통합 및 배선을 최소화하는 데이터센터의 톱 오브 랙(Top-of-Rack) 설계의 이점을 바탕으로 연평균 성장률(CAGR) 9.26%를 기록하며 성장할 것으로 예측됩니다. 이러한 변화는 네트워크 아키텍처의 단순화와 사이트당 물리적 장치 수를 줄여야 할 필요성에 의해서도 촉진되고 있습니다.
Extreme Networks와 Arista는 하나의 섀시 내에 1 GbE, 멀티기가, 25GbE를 혼합한 모듈식 포트 그룹을 제공하여, 대규모 일괄 교체(포크리프트 업그레이드) 없이도 단계적인 전환을 가능하게 하고 있습니다. 조직이 배선실의 합리화를 추진하고 운영 측면에서의 규모의 경제를 추구함에 따라, 고밀도 플랫폼의 액세스 계층 스위치 시장 점유율은 상승할 것으로 전망됩니다. 또한, 고밀도 구성은 랙 공간의 최적화와 자동화 중심의 네트워크 설계를 지원하기 때문에 현대의 캠퍼스 구축에서 점점 더 매력적인 선택지로 떠오르고 있습니다.
지역별 분석
북미는 캠퍼스 현대화의 정착, 고등교육 기관의 장비 교체, 그리고 의료 및 연방 정부 기관에서의 제로 트러스트 조기 도입에 힘입어 2025년 매출의 38.46%를 차지했습니다. 예산의 확실성과 성숙한 파트너 생태계가 예측 가능한 업데이트 주기를 뒷받침하고 있지만, 소규모 지점에서의 업데이트 속도가 둔화되면서 상향 조정이 억제되고 있습니다. 또한, 클라우드 기반 네트워크와 첨단 보안 프레임워크의 광범위한 도입이 기업 캠퍼스 전반에 걸쳐 꾸준한 수요를 지속적으로 견인하고 있습니다.
유럽도 이에 발맞추고 있으며, 인증된 기기의 접근 및 지속적인 모니터링을 의무화하는 NIS2 및 DORA의 요건이 이를 뒷받침하고 있습니다. 넷 제로 공약과 연계된 고효율 이더넷 목표가 기업 캠퍼스 내 PoE 스위치의 업그레이드를 촉진하고 있는 반면, 공공 부문의 승인 절차로 인해 계약 주기가 길어지고 있습니다. 동유럽의 제조업 집적지에서는 산업용 IoT 시범 프로젝트가 확대됨에 따라 수요가 서서히 증가하고 있으며, 디지털 인프라 현대화를 목표로 하는 EU의 자금 지원 프로그램에 힘입어 더욱 가속화되고 있습니다.
아시아태평양은 연평균 성장률(CAGR) 9.54%를 기록하며 가장 빠르게 성장하고 있는 지역입니다. 인도의 “디지털 인디아” 프로그램에서는 스마트시티 및 광대역 프로젝트에 1조 5,000억 루피(180억 달러)가 배정된 반면, 중국의 “제14차 5개년 계획”에서는 산업용 인터넷 구축이 최우선 과제로 꼽히고 있습니다. 아세안의 ‘스마트 시티 네트워크”와 일본의 “사회 5.0” 구상 역시 마찬가지로 지역 전체의 지출을 끌어올리고 있습니다. 이러한 수년에 걸친 정책 덕분에 해당 지역의 액세스 계층 스위치 시장은 지속적인 성장세를 유지하고 있으며, 신규 도입과 기업의 급속한 사업 확장이 추가적인 성장을 이끌고 있습니다.
기타 혜택:
- 엑셀 형식 시장 예측(ME) 시트
- 3개월간의 애널리스트 지원
자주 묻는 질문
목차
제1장 서론
제2장 조사 방법
제3장 주요 요약
제4장 시장 구도
제5장 시장 규모와 성장 예측
제6장 경쟁 구도
제7장 시장 기회와 향후 전망
JHS 26.07.07According to Mordor Intelligence, the access layer switch market size is projected to expand from USD 8.72 billion in 2025 and USD 9.44 billion in 2026 to USD 13.92 billion by 2031, registering a CAGR of 8.07% between 2026 and 2031.
This report is Segmented by Port Speed (1 GbE and Below, 2. 5/5 GbE Multi-Gig, and More), Port Density (Small Form Factor, Mid-Range, High-Density, and More), End-User Enterprise Size (Large Enterprises, and SMEs), End-User Industry (IT and Telecom, BFSI, Healthcare and Lifesciences, Manufacturing, Government and Defense, and More), and Geography. The Market Forecasts are Provided in Terms of Value (USD).
Global Access Layer Switch Market Trends and Insights
Accelerated Campus Digitalization in the Education Vertical
Universities are replacing legacy switches to power hybrid learning, IoT-enabled campuses, and research clusters that depend on multi-gigabit throughput. A 2025 survey of United States higher-education IT leaders found that 60% planned network upgrades within 2 years. UCLA deployed 2.5 GbE-enabled Catalyst 9000 switches across 419 buildings to support Wi-Fi 6E services for 45,000 students CISCO.COM. Washington University adopted HPE Aruba CX switches to enforce role-based segmentation at scale. Dynamic provisioning and cloud orchestration shorten refresh cycles, making academia a steady growth pocket for the access layer switch market.
Surge in Wi-Fi 6 and Wi-Fi 7 Access Point Roll-outs
Wi-Fi 7 reached mainstream status by late 2025 and now represents a sizable share of enterprise wireless spend. IEEE 802.11be radios demand multi-gig uplinks, and the IEEE 802.3bz standard lets enterprises reuse existing Cat 5e and Cat 6 cabling without disruptive rewiring. Arista and Dell introduced 2.5/5 GbE-ready campus switches that integrate wireless telemetry under a single software plane. Power-over-Ethernet budgets rose to 90 W per port under IEEE 802.3bt, further accelerating the retirement of 1 GbE-only platforms.
Supply Chain Volatility of Merchant Switch ASICs
Broadcom's near-monopoly in Tomahawk, Trident, and Jericho chips concentrates risk. TSMC lead times for advanced nodes stretched from six weeks in early 2024 to six months by late 2025, forcing vendors to ration inventory. Export-control uncertainty and multilayer PCB bottlenecks further strain availability. Alternative silicon from Marvell or Intel exists, yet redesign cycles exceed two years, maintaining dependency on Broadcom in the near term.
Other drivers and restraints analyzed in the detailed report include:
- Edge Computing Workload Densification at Branch Sites
- Mandatory Network Access Control Compliance in Regulated Industries
- Skills Gap in Managing Policy-Driven Fabric Architectures
For complete list of drivers and restraints, kindly check the Table Of Contents.
Segment Analysis
Traditional 1 GbE and below ports held 52.18% market share in 2025, sustained by the installed base of legacy endpoints and the economic inertia of organizations deferring infrastructure refresh until end-of-support deadlines force action. The 2.5/5 GbE tier, anchored in IEEE 802.3bz, is forecast to outpace every other speed class with a 12.84 % CAGR through 2031. Enterprises treat multi-gig as a bridge between legacy 1 GbE endpoints and future 10 GbE fiber, preserving existing copper runs while meeting Wi-Fi 7 backhaul needs. Vendor roadmaps now default to multi-gig plus IEEE 802.3bt power budgets, signaling that 1 GbE will gradually enter maintenance mode.
Mature 10 GbE optics support uplinks and server access at falling price points, while 25/40 GbE and above remain concentrated in data-center racks that require east-west throughput. The access layer switch market size for multi-gig is projected to reach meaningful parity with 1 GbE by 2028, solidifying its role as the new default. At the same time, improved interoperability and vendor standardization are reducing deployment friction, accelerating enterprise-wide adoption of multi-gig infrastructure.
Mid-range 24-48-port devices dominated the market with 42.26% market share in 2025 wiring closets due to legacy device counts, yet refresh budgets increasingly tilt toward larger fixed-form-factor models that cut per-port power consumption. High-density 48-96-port switches are expected to grow at 9.26 % CAGR, benefiting from campus-aggregation consolidation and data-center top-of-rack designs that minimize cabling. This shift is also driven by the need to simplify network architecture and reduce the number of physical devices per site.
Extreme Networks and Arista offer modular port groups that mix 1 GbE, multi-gig, and 25 GbE in one chassis, enabling phased migrations without forklift upgrades. The access layer switch market share for high-density platforms is set to climb as organizations rationalize closets and seek operational economies of scale. Additionally, higher-density configurations help optimize rack space and support automation-driven network designs, making them increasingly attractive for modern campus deployments.
Complete Report Scope:
- By Port Speed
- 1 GbE and Below
- 2.5/5 GbE Multi-Gig
- 10 GbE
- 25/40 GbE
- 100 GbE
- 400 GbE and Above
- By Port Density
- Small Form Factor (8-24 ports)
- Mid-Range (24-48 ports)
- High-Density (48-96 ports)
- Ultra-High-Density (100+ ports)
- By End-user Enterprise Size
- Large Enterprises
- SMEs
- By End-User Industry
- IT and Telecom
- BFSI
- Healthcare and Lifesciences
- Manufacturing
- Government and Defense
- Education
- Retail and E-commerce
- Other End User Industries
- By Geography
- North America
- United States
- Canada
- Mexico
- South America
- Brazil
- Argentina
- Rest of South America
- Europe
- Germany
- United Kingdom
- France
- Italy
- Spain
- Russia
- Rest of Europe
- Asia-Pacific
- China
- Japan
- India
- South Korea
- Australia and New Zealand
- Rest of Asia-Pacific
- Middle East
- Saudi Arabia
- United Arab Emirates
- Turkey
- Rest of Middle East
- Africa
- South Africa
- Nigeria
- Rest of Africa
- North America
Geography Analysis
North America held 38.46 % of 2025 revenue due to entrenched campus modernizations, higher-education refreshes, and early zero-trust adoption across healthcare and federal agencies. Budget certainty and mature partner ecosystems underpin a predictable refresh cadence, although slowing replacement in small branches caps upside. In addition, widespread adoption of cloud-managed networking and advanced security frameworks continues to reinforce steady demand across enterprise campuses.
Europe follows closely, propelled by NIS2 and DORA mandates that require authenticated device access and continuous monitoring. Energy-efficient Ethernet goals tied to net-zero pledges spur PoE switch upgrades in corporate campuses, while public-sector approvals prolong deal cycles. Eastern European manufacturing corridors add incremental demand as industrial IoT pilots scale, further supported by EU funding programs aimed at digital infrastructure modernization.
Asia-Pacific is the fastest-growing geography at 9.54 % CAGR. India's Digital India program earmarked INR 1.5 trillion (USD 18 billion) for smart-city and broadband projects, while China's 14th Five-Year Plan prioritizes industrial internet build-outs. ASEAN's Smart Cities Network and Japan's Society 5.0 schemes likewise elevate regional spending. These multi-year directives ensure sustained momentum for the access layer switch market in the region, with greenfield deployments and rapid enterprise expansion driving incremental growth.
- Cisco Systems, Inc.
- Huawei Technologies Co., Ltd.
- Hewlett Packard Enterprise Company
- Arista Networks, Inc.
- Extreme Networks, Inc.
- Dell Technologies Inc.
- Fortinet, Inc.
- TP-Link Technologies Co., Ltd.
- D-Link Corporation
- Alcatel-Lucent Enterprise (ALE International SAS)
- Ubiquiti Inc.
- Zyxel Communications Corporation
- Ruijie Networks Co., Ltd.
- Edgecore Networks Corporation
- Allied Telesis Holdings K.K.
- MikroTikls SIA
- Avaya LLC
- NETGEAR, Inc.
- Cumulus Networks
- Sophos Ltd.
Additional Benefits:
- The market estimate (ME) sheet in Excel format
- 3 months of analyst support
TABLE OF CONTENTS
1 INTRODUCTION
- 1.1 Study Assumptions and Market Definition
- 1.2 Scope of the Study
2 RESEARCH METHODOLOGY
3 EXECUTIVE SUMMARY
4 MARKET LANDSCAPE
- 4.1 Market Overview
- 4.2 Market Drivers
- 4.2.1 Accelerated Campus Digitalization in Education Vertical
- 4.2.2 Surge in Wi-Fi 6 and Wi-Fi 7 Access Point Roll-outs
- 4.2.3 Edge Computing Workload Densification at Branch Sites
- 4.2.4 Mandatory Network Access Control Compliance in Regulated Industries
- 4.2.5 Open-Networking Disaggregation Momentum in Telecom Access
- 4.2.6 Energy-Efficient Ethernet Adoption Targets under Net-Zero Mandates
- 4.3 Market Restraints
- 4.3.1 Supply Chain Volatility of Merchant Switch ASICs
- 4.3.2 Skills Gap in Managing Policy-Driven Fabric Architectures
- 4.3.3 Rising Substitution by High-End WLAN for SMB Segments
- 4.3.4 Prolonged Capex Cycles in Public Sector Networks
- 4.4 Industry Value Chain Analysis
- 4.5 Regulatory Landscape
- 4.6 Technological Outlook
- 4.7 Impact of Macroeconomic Factors on the Market
- 4.8 Porter's Five Forces Analysis
- 4.8.1 Threat of New Entrants
- 4.8.2 Bargaining Power of Suppliers
- 4.8.3 Bargaining Power of Buyers
- 4.8.4 Threat of Substitutes
- 4.8.5 Intensity of Competitive Rivalry
5 MARKET SIZE AND GROWTH FORECASTS (VALUE)
- 5.1 By Port Speed
- 5.1.1 1 GbE and Below
- 5.1.2 2.5/5 GbE Multi-Gig
- 5.1.3 10 GbE
- 5.1.4 25/40 GbE
- 5.1.5 100 GbE
- 5.1.6 400 GbE and Above
- 5.2 By Port Density
- 5.2.1 Small Form Factor (8-24 ports)
- 5.2.2 Mid-Range (24-48 ports)
- 5.2.3 High-Density (48-96 ports)
- 5.2.4 Ultra-High-Density (100+ ports)
- 5.3 By End-user Enterprise Size
- 5.3.1 Large Enterprises
- 5.3.2 SMEs
- 5.4 By End-User Industry
- 5.4.1 IT and Telecom
- 5.4.2 BFSI
- 5.4.3 Healthcare and Lifesciences
- 5.4.4 Manufacturing
- 5.4.5 Government and Defense
- 5.4.6 Education
- 5.4.7 Retail and E-commerce
- 5.4.8 Other End User Industries
- 5.5 By Geography
- 5.5.1 North America
- 5.5.1.1 United States
- 5.5.1.2 Canada
- 5.5.1.3 Mexico
- 5.5.2 South America
- 5.5.2.1 Brazil
- 5.5.2.2 Argentina
- 5.5.2.3 Rest of South America
- 5.5.3 Europe
- 5.5.3.1 Germany
- 5.5.3.2 United Kingdom
- 5.5.3.3 France
- 5.5.3.4 Italy
- 5.5.3.5 Spain
- 5.5.3.6 Russia
- 5.5.3.7 Rest of Europe
- 5.5.4 Asia-Pacific
- 5.5.4.1 China
- 5.5.4.2 Japan
- 5.5.4.3 India
- 5.5.4.4 South Korea
- 5.5.4.5 Australia and New Zealand
- 5.5.4.6 Rest of Asia-Pacific
- 5.5.5 Middle East
- 5.5.5.1 Saudi Arabia
- 5.5.5.2 United Arab Emirates
- 5.5.5.3 Turkey
- 5.5.5.4 Rest of Middle East
- 5.5.6 Africa
- 5.5.6.1 South Africa
- 5.5.6.2 Nigeria
- 5.5.6.3 Rest of Africa
- 5.5.1 North America
6 COMPETITIVE LANDSCAPE
- 6.1 Market Concentration
- 6.2 Strategic Moves
- 6.3 Market Share Analysis
- 6.4 Company Profiles (includes Global Level Overview, Market Level Overview, Core Segments, Financials as available, Strategic Information, Market Rank/Share, Products and Services, Recent Developments)
- 6.4.1 Cisco Systems, Inc.
- 6.4.2 Huawei Technologies Co., Ltd.
- 6.4.3 Hewlett Packard Enterprise Company
- 6.4.4 Arista Networks, Inc.
- 6.4.5 Extreme Networks, Inc.
- 6.4.6 Dell Technologies Inc.
- 6.4.7 Fortinet, Inc.
- 6.4.8 TP-Link Technologies Co., Ltd.
- 6.4.9 D-Link Corporation
- 6.4.10 Alcatel-Lucent Enterprise (ALE International SAS)
- 6.4.11 Ubiquiti Inc.
- 6.4.12 Zyxel Communications Corporation
- 6.4.13 Ruijie Networks Co., Ltd.
- 6.4.14 Edgecore Networks Corporation
- 6.4.15 Allied Telesis Holdings K.K.
- 6.4.16 MikroTikls SIA
- 6.4.17 Avaya LLC
- 6.4.18 NETGEAR, Inc.
- 6.4.19 Cumulus Networks
- 6.4.20 Sophos Ltd.
7 MARKET OPPORTUNITIES AND FUTURE OUTLOOK
- 7.1 White-Space and Unmet-Need Assessment