
|
시장보고서
상품코드
2065741
비디오 스트리밍 시장 : 점유율 분석, 업계 동향과 통계, 성장 예측(2026-2031년)Video Streaming - Market Share Analysis, Industry Trends & Statistics, Growth Forecasts (2026 - 2031) |
||||||
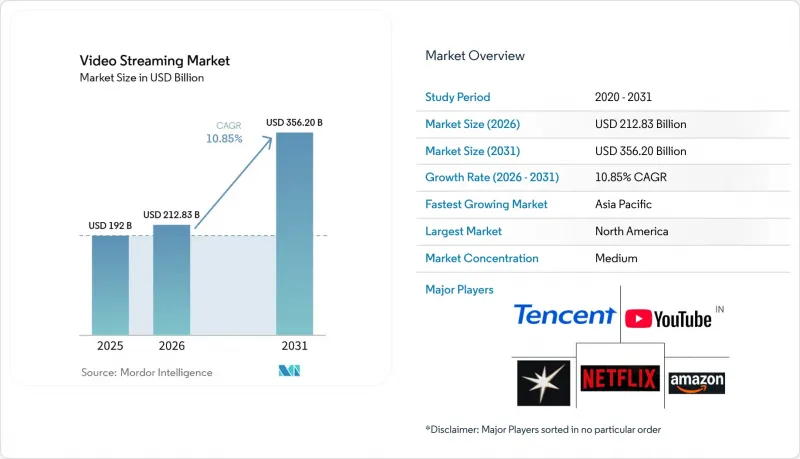
Mordor Intelligence에 의하면, 2026년 비디오 스트리밍 시장 규모는 2,128억 3,000만 달러로 추정되고 있어 2025년 1,920억 달러에서 확대해, 2031년에는 3,562억 달러에 이를 것으로 예측됩니다.
2026년부터 2031년까지 연평균 성장률(CAGR) 10.85%로 성장할 것으로 전망됩니다.
본 보고서는 스트리밍의 유형(라이브 비디오 스트리밍, 비선형/VOD 스트리밍), 구성 요소(소프트웨어, 서비스), 솔루션(OTT, IP TV 등), 플랫폼(스마트폰·태블릿, 스마트 TV, 노트북·데스크톱 PC 등), 수익 모델(구독, 광고, 대여/거래형), 배포 유형(클라우드, On-Premise), 최종 사용자(일반 소비자, 기업), 지역별로 분류되어 있습니다.
세계 비디오 스트리밍 시장 동향과 인사이트
고속 인터넷 접속 이용 확대
광섬유 및 5G의 보급으로 인해 높은 비트레이트가 필요한 서비스의 한계가 비약적으로 높아졌으며, 비디오 스트리밍 시장을 위한 더욱 견고한 기반이 마련되었습니다. 2025년까지 5G 가입자 수는 28억 건을 넘어섰으며, 미국에서는 고정 무선 접속 서비스가 분기마다 수십만 가구씩 증가했습니다. 인도 및 인도네시아의 통신사들은 주요 스트리밍 앱을 우선적으로 이용할 수 있는 저가형 5G 데이터 요금제를 도입하여, 해당 앱을 처음 이용하는 사용자를 프리미엄 컨텐츠 생태계로 직접 유입시켰습니다. 이와 동시에, 라틴아메리카 전역의 캠퍼스에서 Wi-Fi 6로 업그레이드함에 따라 지속적인 4K 처리량이 향상되었으며, 현지 방송사는 스튜디오의 보안 요건을 충족하는 부가적인 스트리밍 서비스를 제공할 수 있게 되었습니다. 클라우드 플랫폼에서는 지역별 통신 속도가 향상될 때마다 두 자릿수의 트래픽 급증세가 기록되었으며, 이는 대역폭이 여전히 구독 및 광고 수익 확대의 주요 원동력임을 입증했습니다.
스포츠 중계 및 이벤트 스트리밍의 인기 상승
2025년, 주요 리그들이 ‘디지털 퍼스트’ 패키지를 출시함에 따라 스포츠 생중계는 케이블 TV에서 온라인으로 급속히 전환되었습니다. Hub사의 조사에 따르면, 팬의 69%가 스트리밍 서비스를 통해 경기를 시청하고 있으며, 이는 처음으로 기존 TV 방송 시청률을 넘어선 수치입니다. NFL, NBA, 라 리가, IPL과의 중계권 계약으로 인해 매일 밤 동시 접속자 수가 급증하면서, 네트워크 사업자들은 저지연 경로의 최적화와 실시간 광고 삽입 기술의 정교화를 요구받게 되었습니다. 35세 미만의 젊은 시청자들이 스포츠 스트리밍 서비스 신규 가입자의 거의 절반을 차지하면서, 라이브 비디오와 상호작용형 통계 정보를 결합한 플랫폼 업체들의 적극적인 노력이 그 정당성을 입증받았습니다. 광고주들도 이에 발맞추어 브랜드 예산을 라이브 방송에 포함된 미드롤 광고나 다이내믹 배너 형식으로 전환함에 따라, 일반적인 엔터테인먼트 컨텐츠에 비해 CPM이 상승했습니다.
컨텐츠의 불법 복제 및 무단 배포
단속이 강화되었음에도 불구하고, 불법 재전송으로 인해 수익이 유출되었습니다. 『2024년 아시아 비디오 산업 보고서』에 따르면, 인도, 말레이시아, 베트남에서는 불법 복제 IPTV 박스를 대상으로 한 새로운 차단법이 제정되었습니다. 스포츠 유료 시청(PPV) 컨텐츠는 여전히 불법 복제가 가장 많이 발생하는 분야로, 저작권자들은 각 계정을 추적할 수 있는 포렌식 워터마크를 삽입하기 시작했습니다. 기술적 대책을 통해 우발적인 불법 복제물 이용은 감소했으나, 도메인 삭제와 미러 사이트의 재등장이라는 끝없는 공방으로 인해 강력한 법무팀을 갖추지 못한 소규모 서비스들은 계속해서 잠재 가입자를 잃게 되었고, 이는 비디오 스트리밍 시장 전체의 성장 가능성을 저해하는 결과를 낳았습니다.
부문별 분석
라이브 스트리밍은 가장 빠른 성장세를 보였으며, 리그 및 콘서트 주최자들이 직접 중계를 선택함에 따라 2026년부터 2031년까지 연평균 성장률(CAGR) 14.4%를 기록하며 증가했습니다. 라이브 형식의 비디오 스트리밍 시장 규모는 2025년에 744억 2,060만 달러에 달해, 2031년까지 1,693억 달러를 넘어설 것으로 전망되어 급격한 성장세를 보이고 있습니다. 비선형/VOD는 2025년에 61.25%의 점유율을 차지했으며, 주요 서비스의 총 재생 횟수의 80% 이상을 주도한 방대한 컨텐츠 라이브러리와 견고한 추천 엔진의 뒷받침을 받아 계속해서 우위를 유지했습니다.
스포츠 생중계는 주요 토너먼트 개최 기간 동안 스트리밍 플랫폼을 주요 시청 채널로 탈바꿈시켰으며, 케이블 방송의 신뢰성과 온라인의 유연성 사이에서 존재하던 인식의 격차를 좁혔습니다. 대체 해설 트랙이나 앱 내 상품 판매 링크와 같은 실시간 참여 유도 도구는 새로운 수익원을 개척하고 세션 시간을 연장했습니다. 한편, 온디맨드 서비스는 비용 효율성과 더 선명한 화질 간의 균형을 맞추기 위한 압축 및 프리페치 전략을 지속적으로 개선함으로써, 보다 광범위한 비디오 스트리밍 시장에서 기반이 되는 역할을 강화했습니다.
소프트웨어 구성 요소(기업, CMS, 분석 레이어)는 2025년 매출의 59.15%를 차지했습니다. 그러나 퍼블리셔들이 고도로 전문화된 배포 업무를 외부에 위탁함에 따라, 멀티 CDN 오케스트레이션 및 서버사이드 광고 삽입과 같은 매니지드 서비스 시장은 연평균 성장률(CAGR) 16.1%를 나타낼 것으로 전망됩니다. 엣지 지원 트래픽 스티어링을 통해 전 세계적인 피크 이벤트 시에도 낮은 지연 시간을 확보함으로써, 소프트웨어의 조기 도입을 통해 확보한 비디오 스트리밍 시장 규모 면에서의 우위를 지킬 수 있었습니다.
서비스의 급증은 광고 지원형 요금제의 확대와 맞물려 있었습니다. 이는 SSAI(서버 측 광고 삽입)가 눈에 띄는 버퍼링 없이 라이브 스트림에 맞춤형 광고를 삽입했기 때문입니다. Akamai와 같은 제공업체들은 2024년에 200 Tbps를 넘어서는 피크를 기록한 트래픽 급증에 대응하며, 인프라가 제3자의 전문 지식에 의존하고 있음을 보여주었습니다. 규정 준수 및 접근성 관련 규제가 강화되는 가운데, 턴키 방식의 자막 제작 및 DRM 서비스는 스토리텔링에 주력하면서도 리스크 관리를 원하는 중견 플랫폼들의 관심을 끌었습니다.
OTT는 기기에 구애받지 않는 도달 범위와 직접 과금 시스템 덕분에 2025년에도 여전히 수익의 56.20%를 차지했습니다. 맞춤형 프로파일부터 ‘워치 파티’ 모드에 이르기까지, 지속적인 기능 확대를 통해 이미 여러 구독 서비스를 동시에 이용하고 있는 가구의 유지율이 높아졌습니다. 통신 사업자가 대칭형 대역폭을 보장하고 현지 언어 패키지를 묶은 FTTH(Fiber-to-the-Home) 번들 상품을 개편함에 따라, IPTV는 연평균 성장률(CAGR) 13.1%를 기록하며 회복세를 보였고, 지속적으로 진화하는 비디오 스트리밍 시장에 안정성을 가져다주었습니다.
사업자가 OTT 앱을 셋톱박스에 통합하여, 기술에 익숙하지 않은 시청자에게도 매력적인 ‘리모컨 하나로 조작 가능한’ 환경을 구현함으로써 하이브리드 비즈니스 모델이 등장했습니다. 첨단 멀티캐스트 기술을 통해 Ultra HD 라이브 채널이 효율적으로 전송되었으며, AI를 활용한 EPG(전자 프로그램 가이드)가 카탈로그 속에 묻혀 있던 숨겨진 명작들을 시청자들에게 소개했습니다. 케이블 및 위성 방송의 기존 사업자들은 기존의 스포츠 중계 계약을 활용해 4K 스트리밍 옵션을 패키지로 묶어 제공했지만, 시장 점유율이 완전한 IP 전송 방식으로 전환되는 것을 지연시킬 수는 있었을지 몰라도, 이를 막을 수는 없었습니다.
지역별 분석
2025년, 북미는 전 세계 매출의 41.85%를 차지했습니다. 이는 광대역의 보급, 오리지널 컨텐츠에 대한 적극적인 투자, 그리고 광고가 포함된 하이브리드 서비스의 조기 도입이 맞물려 실현된 결과입니다. 미국에서만 해도 스트리밍 매출이 2024년 1,120억 달러에서 2029년까지 1,400억 달러로 증가할 것으로 예상되며, 이는 비디오 스트리밍 시장에서 핵심적인 역할을 더욱 공고히 하고 있습니다. 각 가구가 평균 5개의 유료 서비스를 동시에 이용하고 있었기 때문에 경쟁사로의 이탈률은 여전히 높은 수준을 유지하고 있었으며, 각 플랫폼은 월간 해지율을 3% 미만으로 억제하기 위해 할인 번들 상품의 순환 적용 및 극장 개봉에서 스트리밍 서비스로의 전환 기간 조정을 불가피하게 실시해야 했습니다. 캐나다에서도 비슷한 경향이 나타났지만, 지역 방송국이 현지 스포츠 중계권을 확보하고 있었기 때문에 국가를 중시하는 시청자들의 취향이 지켜질 수 있었습니다.
아시아태평양은 16.8%라는 지역별 최고 연평균 성장률(CAGR)을 기록했으며, 2029년까지 162억 달러의 매출 증가가 예상됩니다. 인도는 할인된 모바일 데이터 요금제와 크리켓 독점 중계의 호조에 힘입어, 이 매출 증가분의 4분의 1 이상을 차지했습니다. 한편, 중국은 국영 통신 사업자에 의존하여 FTTH 보급을 가속화했습니다. 일본은 애니메이션과 고예산 연속 드라마를 결합함으로써 ARPU(사용자 1인당 평균 수익) 부문에서 1위 자리를 유지했습니다. JioCinema와 같은 현지 플랫폼들은 저가 요금제와 일일 결제 옵션을 결합한 비즈니스 모델을 확립했으며, 이 모델은 현재 동남아시아에서도 모방되고 있습니다. 비디오 스트리밍 시장 규모는 프리미엄 장편 컨텐츠 라이브러리로 사용자를 유도하는 역할을 한 사용자 제작 단편 영상을 통해 더욱 탄력을 받았습니다.
유럽에서는 견조한 성장세가 이어지고 있으며, 영국은 2027년까지 유럽 최대의 엔터테인먼트 시장이 될 전망입니다. 이는 광고 지원형 플랜이 비용에 민감한 가구에서 타겟 시청자층을 확보하고 있기 때문입니다. 2025년 1분기 영국에서 신규 가입자의 33%가 광고 포함 요금제를 선택했으며, 그중 Prime Video는 17%의 점유율을 차지했습니다. 독일 등 일부 시장에서는 데이터센터의 이산화탄소 배출량 공개 규제가 강화되어 보다 친환경적인 코덱 전략이 촉진된 반면, 프랑스에서는 현지 컨텐츠 할당 기준이 상향 조정되어 컨텐츠 확보 계획에 영향을 미쳤습니다.
라틴아메리카, 중동 및 아프리카에서는 절대적인 수익은 감소했으나, 스마트폰 보급률과 모바일 광대역의 업그레이드가 임계점에 도달함에 따라 두 자릿수의 견조한 사용자 증가를 기록했습니다. SVOD의 성장에 힘입어 해당 지역 전체에서 Wi-Fi 6 도입이 촉진되었으며, 그 결과 스트리밍의 평균 비트레이트가 향상되었습니다. 나이지리아의 통신 사업자는 교육 채널에 대한 데이터 통신 요금 무료화(제로레이팅)를 시범 도입하여, 이를 통해 상업용 엔터테인먼트에 대한 추가 수요를 유도했습니다. 이는 계속 확대되고 있는 비디오 스트리밍 시장에서 통신 사업자와 OTT 제공업체 사이에 상호 이익이 존재함을 보여줍니다.
기타 혜택:
- 엑셀 형식 시장 예측(ME) 시트
- 3개월간의 애널리스트 지원
자주 묻는 질문
목차
제1장 서론
제2장 조사 방법
제3장 주요 요약
제4장 시장 구도
제5장 시장 규모와 성장 예측
제6장 경쟁 구도
제7장 시장 기회와 향후 전망
JHS 26.06.29According to Mordor Intelligence, video streaming market size in 2026 is estimated at USD 212.83 billion, growing from 2025 value of USD 192.0 billion with 2031 projections showing USD 356.2 billion, growing at 10.85% CAGR over 2026-2031.

This report is Segmented by Streaming Type (Live Video Streaming, Non-Linear / VOD Streaming), Component (Software, Services), Solutions (Over-The-Top, Internet Protocol TV, and More), Platform (Smartphones and Tablets, Smart TV, Laptops and Desktops, and More), Revenue Model (Subscription, Advertising, Rental / Transactional), Deployment Type (Cloud, On-Premises), End User (Consumer, Enterprise), and Geography.
Global Video Streaming Market Trends and Insights
Growing Availability of High-Speed Internet Connectivity
The rollout of fiber and 5G radically raised the ceiling for bit-rate-intensive services and set a stronger baseline for the video streaming market. By 2025 more than 2.8 billion 5G subscriptions were in service, and fixed-wireless access added several hundred thousand households each quarter in the United States . Operators in India and Indonesia introduced low-cost 5G data packs that prioritized major streaming apps, pulling first-time viewers directly into premium content ecosystems. In parallel, campus-wide Wi-Fi 6 upgrades in Latin America lifted sustained 4 K throughput, enabling local broadcasters to launch companion streaming services that met studio security requirements. Cloud platforms recorded double-digit traffic spikes with every regional speed upgrade, confirming that bandwidth remains the primary flywheel for subscription and advertising revenue expansion.
Rising Popularity of Live Sports and Event Streaming
Live sports migrated quickly from cable to online in 2025 as top leagues sold digital-first packages. A Hub study showed that 69% of fans viewed matches on streaming services, edging out linear broadcast for the first time. Rights deals with the NFL, NBA, La Liga, and IPL translated into nightly surges in concurrent streams, pressuring networks to refine low-latency paths and real-time ad stitching. Younger viewers under 35 drove nearly half of all new sports subscriptions, validating aggressive bids by platforms that pair live feeds with interactive stats overlays. Advertisers followed, shifting brand budgets toward mid-roll and dynamic banner formats embedded in live streams, thus boosting CPMs relative to general entertainment content.
Content Piracy and Unauthorized Distribution
Illicit restreaming siphoned revenue even as enforcement improved. The Asia Video Industry Report for 2024 documented new blocking statutes in India, Malaysia, and Vietnam that targeted pirate IPTV boxes. Sports pay-per-view content remained the most pirated category, prompting rightsholders to embed forensic watermarking that traces each account. While technical counter-measures reduced casual piracy, the perpetual game of domain takedown versus mirror site re-appearance meant that smaller services without robust legal teams continued to lose prospective subscribers, cutting into the aggregate video streaming market growth potential.
Other drivers and restraints analyzed in the detailed report include:
- Proliferation of Smart-TVs and Connected OTT Devices
- AI-Driven Localized Dubbing Unlocking Non-English Audiences
- Escalating Content Licensing and Production Costs
For complete list of drivers and restraints, kindly check the Table Of Contents.
Segment Analysis
Live streaming posted the fastest trajectory, rising at a 14.4% CAGR from 2026 to 2031 as leagues and concert promoters chose direct distribution. The video streaming market size for live formats stood at USD 74420.6 million in 2025 and is expected to surpass USD 169.3 billion by 2031, indicating a dramatic scaling curve. Non-linear/VOD retained dominance due to its 61.25% share in 2025, backed by expansive libraries and robust recommendation engines that propelled over 80% of total plays on major services.
Live sports coverage turned streaming platforms into primary destinations during key tournaments, narrowing the perception gap between cable reliability and online flexibility. Real-time engagement tools such as alternate commentary tracks and in-app merch links unlocked fresh revenue streams and extended session duration. Meanwhile, on-demand services continued to refine compression and pre-fetching strategies that balanced cost efficiency with sharper picture quality, reinforcing their foundational role inside the broader video streaming market.
Software components-players, CMS, analytics layers-accounted for 59.15% of 2025 revenue. However, managed services such as multi-CDN orchestration and server-side ad insertion registered a 16.1% CAGR forecast as publishers outsourced highly specialized delivery tasks. Edge-aware traffic steering ensured low latency during peak global events, which safeguarded the video streaming market size advantages secured by early software adoption.
The surge in services aligned with ad-supported tier expansion because SSAI blended personalized ads into live streams without overt buffering. Providers like Akamai handled traffic bursts that peaked at more than 200 Tbps in 2024, demonstrating infrastructure reliance on third-party expertise. As compliance and accessibility rules tightened, turnkey captioning and DRM services attracted mid-tier platforms keen to manage risk while staying focused on storytelling.
OTT retained a 56.20% grip on revenue in 2025 thanks to its device-agnostic reach and direct billing. Continuous feature rollouts-from personalized profiles to watch-party modes-raised stickiness among households already juggling multiple subscriptions. IPTV rebounded with a 13.1% CAGR after telcos refreshed fiber-to-the-home bundles that guaranteed symmetric bandwidth and bundled local language packs, thereby adding stability to the evolving video streaming market.
Hybrid business models emerged as operators integrated OTT apps into set-top boxes, ensuring single-remote access that appealed to less tech-savvy viewers. Advanced multicast pushed ultra-HD linear channels efficiently, and AI-enhanced EPGs exposed hidden catalog gems. Cable and satellite incumbents leveraged existing sports contracts to package optional 4K streams, delaying but not preventing a long-term share drift toward full IP delivery.
Geography Analysis
North America held 41.85% of global revenue in 2025 as ubiquitous broadband, aggressive original content budgets, and early adoption of advertising hybrids converged. The United States alone is projected to lift streaming revenue from USD 112 billion in 2024 to USD 140 billion by 2029, reinforcing its anchor role in the video streaming market. Competitive churn remained high because households stacked an average of five paid services, prompting platforms to rotate discount bundles and theater-to-stream windows to keep churn below 3% monthly. Canada mirrored these patterns, although regional broadcasters preserved local sports rights that sheltered nationalist viewer preferences.
Asia-Pacific delivered the fastest regional CAGR at 16.8% and is forecast to add USD 16.2 billion in incremental revenue by 2029. India contributed more than one-quarter of the uplift, fueled by discounted mobile data plans and exclusive cricket streaming, while China leaned on state-owned telcos to accelerate FTTH. Japan blended anime with high-budget serials to maintain ARPU leadership. Local platforms such as JioCinema forged low-price tiers paired with daily payment options, a model now copied in Southeast Asia. The video streaming market size gained additional momentum from user generated short-form clips that acted as funnels into premium long-form libraries.
Europe retained solid traction, and the United Kingdom is set to become the continent's largest entertainment market by 2027 as ad-supported tiers find an addressable audience in cost-sensitive households. Thirty-three percent of new UK sign-ups in Q1 2025 selected an ad tier, and Prime Video captured 17% of those activations. Markets such as Germany tightened CO2 disclosure rules for datacenters, prompting greener codec strategies, while France advanced local content quotas that shaped catalog acquisition plans.
Latin America and the Middle East and Africa registered lower absolute revenue but posted healthy double-digit user growth as smart-phone penetration and mobile broadband upgrades reached critical mass. SVOD growth encouraged Wi-Fi 6 adoption across the region, which in turn improved average streaming bit-rates. Nigeria's telcos trialed zero-rated educational channels that steered incremental demand toward commercial entertainment, illustrating mutual benefits between operators and OTT providers in the continually widening video streaming market.
- Netflix Inc.
- Amazon.com Inc. (Prime Video)
- Alphabet Inc. (YouTube)
- The Walt Disney Company (Disney+, Hulu)
- Warner Bros. Discovery Inc. (Max)
- Tencent Holdings Ltd. (Tencent Video)
- Apple Inc. (Apple TV+)
- JioCinema
- Crunchyroll LLC
- Akamai Technologies Inc.
- iQIYI Inc.
- DAZN Group
- fuboTV Inc.
- Kaltura Inc.
- Vimeo Inc.
- Disney+ Hotstar
- iQIYI Inc.
- Bilibili Inc.
- PCCW Media (Viu)
- Rakuten Group Inc. (Rakuten Viki)
- Reliance Industries Ltd. (JioCinema)
- Zee Entertainment Enterprises Ltd. (ZEE5)
- Sky Group Ltd. (NOW)
- Telefonica S.A. (Movistar+)
- Dish Network Corp. (Sling TV)
Additional Benefits:
- The market estimate (ME) sheet in Excel format
- 3 months of analyst support
TABLE OF CONTENTS
1 INTRODUCTION
- 1.1 Study Assumptions and Market Definition
- 1.2 Scope of the Study
2 RESEARCH METHODOLOGY
3 EXECUTIVE SUMMARY
4 MARKET LANDSCAPE
- 4.1 Market Overview
- 4.2 Market Drivers
- 4.2.1 Growing availability of high-speed internet connectivity
- 4.2.2 Rising popularity of live sports and event streaming
- 4.2.3 Proliferation of smart-TVs and connected OTT devices
- 4.2.4 AI-driven localized dubbing unlocking non-English audiences
- 4.2.5 Telco zero-rating of OTT data in emerging markets
- 4.2.6 5G multicast/broadcast (eMBMS) for in-stadium live feeds
- 4.3 Market Restraints
- 4.3.1 Content piracy and unauthorized distribution
- 4.3.2 Escalating content licensing and production costs
- 4.3.3 Carbon-footprint scrutiny of streaming delivery
- 4.3.4 Codec-standard fragmentation causing device issues
- 4.4 Value Chain Analysis
- 4.5 Regulatory Landscape
- 4.6 Technological Outlook
- 4.7 Porter's Five Forces Analysis
- 4.7.1 Bargaining Power of Suppliers
- 4.7.2 Bargaining Power of Buyers/Consumers
- 4.7.3 Threat of New Entrants
- 4.7.4 Threat of Substitutes
- 4.7.5 Competitive Rivalry
- 4.8 Investment Analysis
- 4.9 Assessment of the Impact of Macroeconomic factors on the Market
5 MARKET SIZE AND GROWTH FORECASTS (VALUE)
- 5.1 By Streaming Type
- 5.1.1 Live Video Streaming
- 5.1.2 Non-Linear / VOD Streaming
- 5.2 By Component
- 5.2.1 Software
- 5.2.2 Services
- 5.3 By Solutions
- 5.3.1 Over-the-Top (OTT)
- 5.3.2 Internet Protocol TV (IPTV)
- 5.3.3 Cable TV
- 5.3.4 Pay-TV
- 5.4 By Platform
- 5.4.1 Smartphones and Tablets
- 5.4.2 Smart TV
- 5.4.3 Laptops and Desktops
- 5.4.4 Gaming Consoles
- 5.5 By Revenue Model
- 5.5.1 Subscription (SVOD)
- 5.5.2 Advertising (AVOD/FAST)
- 5.5.3 Rental / Transactional (TVOD)
- 5.6 By Deployment Type
- 5.6.1 Cloud
- 5.6.2 On-Premises
- 5.7 By End User
- 5.7.1 Consumer
- 5.7.2 Enterprise
- 5.8 By Geography
- 5.8.1 North America
- 5.8.1.1 United States
- 5.8.1.2 Canada
- 5.8.1.3 Mexico
- 5.8.2 South America
- 5.8.2.1 Brazil
- 5.8.2.2 Argentina
- 5.8.2.3 Rest of South America
- 5.8.3 Europe
- 5.8.3.1 United Kingdom
- 5.8.3.2 Germany
- 5.8.3.3 France
- 5.8.3.4 Italy
- 5.8.3.5 Spain
- 5.8.3.6 Russia
- 5.8.3.7 Rest of Europe
- 5.8.4 Asia-Pacific
- 5.8.4.1 China
- 5.8.4.2 India
- 5.8.4.3 Japan
- 5.8.4.4 South Korea
- 5.8.4.5 Australia and New Zealand
- 5.8.4.6 Rest of Asia-Pacific
- 5.8.5 Middle East and Africa
- 5.8.5.1 Middle East
- 5.8.5.1.1 GCC Countries (Saudi Arabia, UAE, Qatar)
- 5.8.5.1.2 Turkey
- 5.8.5.1.3 Rest of Middle East
- 5.8.5.2 Africa
- 5.8.5.2.1 South Africa
- 5.8.5.2.2 Nigeria
- 5.8.5.2.3 Rest of Africa
- 5.8.5.1 Middle East
- 5.8.1 North America
6 COMPETITIVE LANDSCAPE
- 6.1 Market Concentration
- 6.2 Strategic Moves
- 6.3 Market Share Analysis
- 6.4 Company Profiles {(includes Global level Overview, Market level overview, Core Segments, Financials as available, Strategic Information, Market Rank/Share for key companies, Products and Services, and Recent Developments)}
- 6.4.1 Netflix Inc.
- 6.4.2 Amazon.com Inc. (Prime Video)
- 6.4.3 Alphabet Inc. (YouTube)
- 6.4.4 The Walt Disney Company (Disney+, Hulu)
- 6.4.5 Warner Bros. Discovery Inc. (Max)
- 6.4.6 Tencent Holdings Ltd. (Tencent Video)
- 6.4.7 Apple Inc. (Apple TV+)
- 6.4.8 JioCinema
- 6.4.9 Crunchyroll LLC
- 6.4.10 Akamai Technologies Inc.
- 6.4.11 iQIYI Inc.
- 6.4.12 DAZN Group
- 6.4.13 fuboTV Inc.
- 6.4.14 Kaltura Inc.
- 6.4.15 Vimeo Inc.
- 6.4.16 Disney+ Hotstar
- 6.4.17 iQIYI Inc.
- 6.4.18 Bilibili Inc.
- 6.4.19 PCCW Media (Viu)
- 6.4.20 Rakuten Group Inc. (Rakuten Viki)
- 6.4.21 Reliance Industries Ltd. (JioCinema)
- 6.4.22 Zee Entertainment Enterprises Ltd. (ZEE5)
- 6.4.23 Sky Group Ltd. (NOW)
- 6.4.24 Telefonica S.A. (Movistar+)
- 6.4.25 Dish Network Corp. (Sling TV)
7 MARKET OPPORTUNITIES AND FUTURE OUTLOOK
- 7.1 White-space and Unmet-Need Assessment
