
|
시장보고서
상품코드
2066762
전기자동차용 리튬 이온 배터리 시장 : 시장 점유율 분석, 업계 동향 및 통계, 성장 예측(2026-2031년)Lithium-ion Battery For Electric Vehicle - Market Share Analysis, Industry Trends & Statistics, Growth Forecasts (2026 - 2031) |
||||||
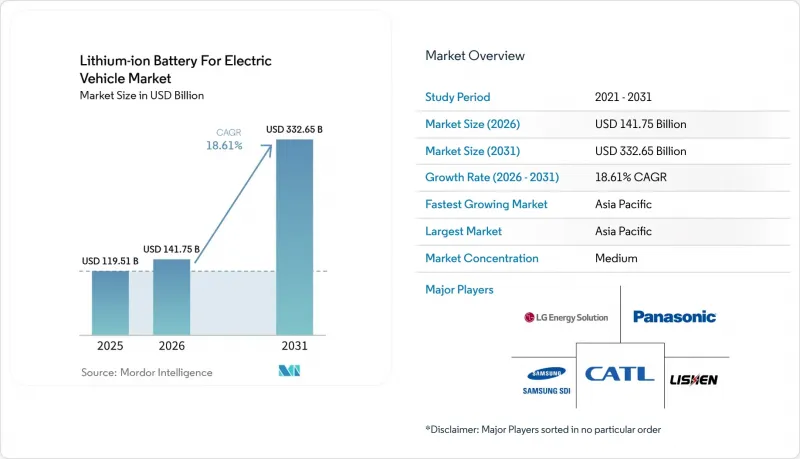
Mordor Intelligence에 의하면, 전기자동차용 리튬 이온 배터리 시장 규모는 2026년 1,417억 5,000만 달러로 추정되고, 2025년 1,195억 1,000만 달러에서 확대해, 2031년에는 3,326억 5,000만 달러에 이를 것으로 예측됩니다.
2026-2031년 연평균 성장률(CAGR)은 18.61%가 될 것으로 전망됩니다.
본 보고서는 배터리의 화학 조성별(리튬 이온, 신기술, 납산, 니켈 금속 수소 배터리), 셀 형태별(원통형, 각형, 파우치형), 구동 방식별(배터리식 전기차, 플러그인 하이브리드차, 하이브리드차), 차량 유형별(승용차, 소형 상용차 등), 지역별(북미, 유럽, 아시아태평양 등)로 분류되어 있습니다.
세계의 전기자동차용 리튬 이온 배터리 동향 및 인사이트
2029년까지 리튬 이온 배터리 팩 가격이 80달러/kWh 아래로 떨어질 전망
리튬 탄산염 가격 하락과 기가팩토리 규모 확대를 배경으로, 2024년에는 배터리 팩 평균 비용이 전년 대비 14% 감소한 115달러/kWh까지 떨어졌습니다. 중국산 LFP(인산철 리튬) 배터리의 입찰 가격이 kWh당 95달러까지 하락하면서, 아시아 전역에서 보조금 없이도 보급형 차량의 보급이 가능해졌습니다. 테슬라는 ‘4680 프로그램’을 통해 2026년까지 kWh당 70달러를 달성할 전망을 제시하며, 수직 통합형 OEM이 자체 공급을 통해 얻을 수 있는 차익의 중요성을 부각시키고 있습니다.
대형 트럭의 급속한 전기화를 위한 규제
중국, EU, 미국은 배터리식 전기 트럭의 판매를 주류로 자리매김하기 위한 일정을 조율하고 있습니다. 중국은 2030년까지 1급 도시에서 대형 트럭의 신규 등록 대수 중 50%를 무공해 차량으로할 것을 의무화하고 있으며, EU는 2040년까지 배출량을 90% 감축하는 것을 목표로 하고 있으며, 미국 환경보호청(EPA)은 2032년까지 클래스 8 배터리식 전기 트럭의 판매 비율을 40%로 높일 것을 요구하고 있습니다. 각 트랙터에는 최대 400kWh의 배터리가 필요하며, 이로 인해 셀 수요는 승용차 평균을 훨씬 웃도는 수준으로 확대될 것입니다.
원자재 가격 변동
리튬 탄산염 가격은 2024년 1월부터 12월 사이에 85% 급락하면서, 알베마르 등 광산 기업들은 호주 내 생산을 줄일 수밖에 없게 되었습니다. 같은 기간 동안 황산니켈 가격은 46% 변동하며 NMC 제조업체의 이익률을 압박했지만, 반면 LFP 공급업체는 비교적 안정적인 원자재 비용을 누릴 수 있었습니다. 배터리용 수산화 리튬의 90%를 수입에 의존하고 있는 유럽의 배터리 제조업체들은 특히 환율 위험에 노출되어 있습니다.
부문별 분석
2025년, 전기자동차용 리튬 이온 배터리 시장 수요 중 90.87%를 리튬 NMC, LFP 및 NCA가 차지했습니다. NMC는 20-30%의 비용 프리미엄이 있음에도 불구하고, 400마일급의 프리미엄 모델 시장에서 주류를 이루고 있습니다. 한편, LFP는 코발트를 포함하지 않아 안정성이 뛰어나, 현재 중국 승용차 시장의 44.65%를 차지하고 있습니다. 나트륨 이온 배터리는 보급형 용도로 등장했으며, 전고체 배터리는 2028년 상용화를 목표로 연평균 성장률(CAGR) 30.90%로 성장할 것으로 전망됩니다. 아시아의 스쿠터와 버스에 LFP가 채택됨에 따라, LFP 단독 리튬 이온 배터리 시장 규모는 2031년까지 1,247억 달러를 넘어설 것으로 전망됩니다. 그러나 고체 배터리 생산 비용이 120달러/kWh 아래로 떨어질 경우, 기존의 액체 전해질 기가팩토리는 감가상각 가속화에 직면하게 될 것입니다.
따라서 전기자동차용 리튬 이온 배터리는 두 가지 측면의 위협에 대처해야 합니다. 전고체 배터리는 에너지 밀도가 60% 향상될 것으로 예상되며, 장거리 주행 부문에서는 니켈 함량이 높은 NMC 배터리에 한계가 있는 반면, 나트륨 이온 배터리는 비용을 중시하는 차량 대여 시장에서 LFP 배터리의 가격보다 저렴합니다. 각 제조업체들은 양극재 포트폴리오를 다각화하고 있으며, SVOLT사는 ESG(환경·사회·지배구조) 측면에서의 감시를 피하기 위해 코발트가 포함되지 않은 NMX를 상용화하고 있습니다. 규제 당국의 탄소 발자국 공개 규정에 따라 화학 조성 선정 기준이 더욱 엄격해지고 있으며, 2025년 이후 유럽에서는 저배출 양극재가 조달 시 우선적으로 선정될 예정입니다.
2025년 전기자동차용 리튬 이온 배터리 시장의 출하량 중 프리즘형 셀이 47.55%를 차지했습니다. BYD의 ‘Blade’는 긴 프리즘형 유닛을 섀시에 통합함으로써 모듈 하우징을 제거하고, 무게를 15% 줄였습니다. CATL의 ‘Qilin’은 측벽에 냉각 수로를 내장함으로써 255 Wh/kg의 팩 밀도를 실현했습니다. 반면, 테슬라의 ‘4680’과 같은 원통형 설계는 35.25%의 점유율을 차지하고 있으며, 자동 생산에 유리합니다. 타블레스 전극을 통해 내부 저항을 50% 줄여, 5분간의 급속 충전을 실현했습니다.
시장 점유율 17.20%를 차지하는 파우치형 배터리는 BMW의 ‘노이에 클라세’가 차량 실내 공간을 극대화하는 유연한 레이아웃을 중시하고 있기 때문에 2031년까지의 연평균 성장률(CAGR)이 22.80%를 나타낼 것으로 예측됩니다. 유럽의 기가팩토리가 생산을 확대함에 따라, 파우치형 리튬 이온 배터리 시장 규모는 향후 10년 말까지 600억 달러에 달할 가능성이 있습니다. 지역별 경향은 분명합니다. 아시아에서는 프리즘형이 주류를 이루고, 북미에서는 원통형이 선호되며, 유럽에서는 파우치형이 주목받고 있어, 공급업체들은 여러 가지 포맷에 대응할 수 있는 생산 라인을 유지하지 않으면 고객을 잃을 위험에 직면해 있습니다.
지역별 분석
2025년, 아시아태평양은 전기자동차용 리튬 이온 배터리 시장의 50.35%를 차지했으며, 중국의 550 GWh에 달하는 설치 용량은 유럽과 북미를 합친 것을 훨씬 웃돌았습니다. 인도의 PLI(생산 연계형 인센티브) 제도의 지원을 받는 공장들과 동남아시아의 이륜차 붐으로 인해 배터리 수요가 증가함에 따라, 2031년까지 해당 지역 전체의 연평균 성장률(CAGR)은 20.92%를 유지할 것으로 전망됩니다. 전 세계 리튬 정제량의 70%를 차지하는 중국의 수직 통합형 공급망은 수입에 의존하는 경쟁사들에 비해 15-20%의 비용 우위를 제공합니다.
북미에서는 IRA(인플레이션 억제법)에 따른 인센티브가 연평균 성장률(CAGR) 22.05%를 뒷받침하고 있습니다. 2024년 현재 발표된 미국의 생산 능력은 80GWh에 달하며, 2025-2027년 가동을 시작할 예정인 테슬라, GM-LG, 포드-SK, 파나소닉의 프로젝트가 이를 주도하고 있습니다. 국내 조달 요건에 따라 공급 계약의 형태가 재편되면서, 아시아의 거대 기업들은 신용을 확보하기 위해 현지에서의 기술 라이선싱을 촉진하고 있습니다.
유럽은 EU 배터리 규제와 32억 유로 규모의 합작 사업을 통한 공동 자금 조달을 바탕으로 연평균 성장률(CAGR) 19.35%를 기록하며 그 뒤를 따르고 있습니다. 이로써 2024년 파이프라인은 700GWh에 달했습니다. 노스볼트, ACC, 그리고 CATL의 헝가리 거점은 비용 경쟁력이 있는 유럽 내 조달의 실례이며, 중국의 수출 마진을 압박하고 있습니다.
남미와 중동 및 아프리카의 점유율은 합쳐서 8.25%에 그치고 있지만, 성장세가 가속화되고 있습니다. 브라질의 스텔란티스(Stellantis)사의 생산 라인과 사우디아라비아의 Ceer사가 추진하는 합작 사업은 2026년 가동을 목표로 하고 있으며, 현지 조달을 위한 초기 기반을 마련하고 있습니다. 지역 내 도입은 연료비 절감 효과를 즉시 얻을 수 있는 버스나 카풀용 차량에 중점을 두고 있습니다.
기타 혜택 :
- 엑셀 형식 시장 예측(ME) 시트
- 3개월간의 애널리스트 지원
자주 묻는 질문
목차
제1장 서론
제2장 조사 방법
제3장 주요 요약
제4장 시장 구도
제5장 시장 규모 및 성장 예측
제6장 경쟁 구도
제7장 시장 기회 및 향후 전망
AJY 26.06.30According to Mordor Intelligence, lithium-ion battery for electric vehicle market size in 2026 is estimated at USD 141.75 billion, growing from 2025 value of USD 119.51 billion with 2031 projections showing USD 332.65 billion, growing at 18.61% CAGR over 2026-2031.

This report is Segmented by Battery Chemistry (Lithium-Ion, Emerging, Lead-Acid, and Nickel-Metal-Hydride), Cell Format (Cylindrical, Prismatic, and Pouch), Propulsion (Battery Electric Vehicle, Plug-In Hybrid Electric Vehicle, and Hybrid Electric Vehicle), Vehicle Type (Passenger Cars, Light Commercial Vehicles, and More), and Geography (North America, Europe, Asia-Pacific, and More).
Global Lithium-ion Battery For Electric Vehicle Market Trends and Insights
Declining Lithium-Ion Battery Pack Prices Below USD 80/kWh by 2029
Average pack costs fell to USD 115/kWh in 2024, down 14% year-on-year, driven by lithium carbonate deflation and gigafactory scale. Chinese LFP bids dipped to USD 95/kWh, enabling unsubsidized entry-level cars across Asia. Tesla projects USD 70/kWh by 2026 on its 4680 program, underscoring the captive-supply arbitrage available to vertically integrated OEMs.
Rapid Electrification Mandates for Heavy-Duty Trucks
China, the EU, and the United States have aligned timelines that push battery-electric trucks toward mainstream sales. China requires 50% zero-emission heavy-truck registrations in tier-1 cities by 2030, the EU is targeting a 90% emissions cut by 2040, and the U.S. EPA calls for 40% Class 8 battery-electric sales by 2032. Each tractor needs up to 400 kWh, amplifying cell demand far beyond passenger-car averages.
Raw-Material Price Volatility
Lithium carbonate collapsed 85% between January and December 2024, forcing miners such as Albemarle to throttle Australian output. Nickel sulfate swung 46% during the same period, squeezing NMC producers' margins, whereas LFP suppliers faced relatively stable input costs. European cell makers, importing 90% of battery-grade lithium hydroxide, are especially exposed to currency risk.
Other drivers and restraints analyzed in the detailed report include:
- OEM Vertical Integration Driving Captive Cell Demand
- Geopolitical Race to On-Shore Gigafactories
- Solid-State and Sodium-Ion Commercialization Risk
For complete list of drivers and restraints, kindly check the Table Of Contents.
Segment Analysis
In 2025, lithium NMC, LFP, and NCA held 90.87% of demand inside the Lithium-ion battery for electric vehicle market. NMC rules premium 400-mile models despite a 20-30% cost premium, while LFP now owns 44.65% of China's passenger segment due to cobalt-free stability. Sodium-ion debuted for entry-level applications, and solid-state cells are projected at a 30.90% CAGR toward 2028 commercialization. The Lithium-ion battery market size for LFP alone is on track to surpass USD 124.7 billion by 2031 as Asian scooters and buses adopt the chemistry. Yet, if solid-state production costs fall under USD 120/kWh, incumbent liquid-electrolyte gigafactories face accelerated depreciation.
The Lithium-ion battery for the electric vehicle market must therefore manage a dual-front threat. Solid-state promises 60% higher energy density that challenges nickel-rich NMC in long-range segments, while sodium-ion undercuts LFP in cost-sensitive fleets. Producers are diversifying cathode portfolios, with SVOLT commercializing cobalt-free NMX to hedge against ESG scrutiny. Regulators' carbon-footprint disclosure rules intensify chemistry selection; low-emission cathodes earn procurement preference in Europe beginning 2025.
Prismatic cells delivered 47.55% of 2025 shipments within the Lithium-ion battery for electric vehicle market. BYD's Blade integrates long prismatic units into the chassis, removing module housings and cutting weight by 15%. CATL's Qilin achieves 255 Wh/kg pack density by embedding coolant channels within sidewalls. In contrast, cylindrical designs like Tesla's 4680 held a 35.25% share and excel at automated production; tabless electrodes lower internal resistance by 50% to support 5-minute fast charging.
Pouch cells, at 17.20% share, are forecast for 22.80% CAGR through 2031 as BMW's Neue Klasse favors flexible footprints that maximize cabin space. The Lithium-ion battery market size tied to pouch formats could reach USD 60 billion by decade-end as European gigafactories ramp up. Regional bias is evident: Asia champions prismatic, North America leans cylindrical, and Europe eyes pouch, forcing suppliers to maintain multi-format lines or risk customer attrition.
Geography Analysis
Asia-Pacific accounted for 50.35% of the Lithium-ion battery for electric vehicle market in 2025, with China's 550 GWh installed capacity dwarfing Europe and North America combined. Regional CAGR of 20.92% persists through 2031 as India's PLI-backed plants and Southeast Asia's two-wheeler boom raise cell offtake. China's vertically integrated chain, covering 70% of global lithium refining, provides a 15-20% cost advantage versus import-dependent rivals.
North America's IRA incentives underpin a 22.05% CAGR. Announced U.S. capacity reached 80 GWh in 2024, led by Tesla, GM-LG, Ford-SK, and Panasonic projects scheduled for 2025-2027 commissioning. Domestic sourcing requirements reshape supply deals, encouraging Asian giants to license technology locally to capture credits.
Europe follows at 19.35% CAGR on the back of the EU Battery Regulation and EUR 3.2 billion of joint-undertaking co-funding, which lifted the pipeline to 700 GWh in 2024. Northvolt, ACC, and CATL's Hungarian site illustrate cost-competitive continental sourcing that erodes Chinese export margins.
South America and the Middle East-Africa collectively stood at 8.25% share but are accelerating. Brazil's Stellantis line and Saudi Arabia's Ceer venture target 2026 starts, creating early footholds for localized supply. Regional adoption focuses on buses and ride-hailing fleets where fuel savings are immediate.
- Contemporary Amperex Technology (CATL)
- BYD Company Ltd (FinDreams)
- LG Energy Solution Ltd
- Panasonic Energy Co Ltd
- Samsung SDI Co Ltd
- SK On Co Ltd
- CALB Group Co Ltd
- Gotion High-tech Co Ltd
- Eve Energy Co Ltd
- Sunwoda Electronic Co Ltd
- AESC (Envision)
- Northvolt AB
- SVOLT Energy Technology
- Farasis Energy
- ProLogium Technology Co Ltd
- StoreDot Ltd
- Tata Agratas Energy Storage
- ACC Automotive Cells Company
- QuantumScape Corp.
- Redwood Materials Inc.
- International Battery Co. (IBC)
- Italvolt SpA
- Britishvolt Ltd (in administration)
Additional Benefits:
- The market estimate (ME) sheet in Excel format
- 3 months of analyst support
TABLE OF CONTENTS
1 Introduction
- 1.1 Study Assumptions & Market Definition
- 1.2 Scope of the Study
2 Research Methodology
3 Executive Summary
4 Market Landscape
- 4.1 Market Overview
- 4.2 Market Drivers
- 4.2.1 Declining lithium-ion battery pack prices less than USD 80 /kWh by 2029
- 4.2.2 Rapid electrification mandates for heavy-duty trucks in China, EU & U.S.
- 4.2.3 OEM vertical-integration (BYD, Tesla, Geely) driving captive cell demand
- 4.2.4 Geopolitical race to on-shore Gigafactories (IRA, EU BJT, India PLI)
- 4.2.5 Fast-charging 800-V architectures lifting average battery size
- 4.2.6 LFP's cobalt-free cost edge expanding addressable price-sensitive 2-W/3-W markets
- 4.3 Market Restraints
- 4.3.1 Raw-material spot price volatility (lithium carbonate, nickel sulfate)
- 4.3.2 Solid-state & sodium-ion commercialisation risk cannibalising Li-ion post-2028
- 4.3.3 ESG scrutiny on Chinese supply chain traceability
- 4.3.4 Battery-fire recalls eroding consumer confidence in emerging markets
- 4.4 Supply-Chain Analysis
- 4.5 Regulatory Landscape
- 4.6 Technological Outlook
- 4.7 Porters Five Forces
- 4.7.1 Bargaining Power of Suppliers
- 4.7.2 Bargaining Power of Buyers
- 4.7.3 Threat of New Entrants
- 4.7.4 Threat of Substitutes
- 4.7.5 Intensity of Competitive Rivalry
5 Market Size & Growth Forecasts
- 5.1 By Battery Chemistry
- 5.1.1 Lithium-ion (NMC, LFP, NCA)
- 5.1.2 Emerging (Solid-state, Li-S, Na-ion)
- 5.1.3 Lead-acid
- 5.1.4 Nickel-metal-hydride
- 5.2 By Cell Format
- 5.2.1 Cylindrical
- 5.2.2 Prismatic
- 5.2.3 Pouch
- 5.3 By Propulsion
- 5.3.1 Battery Electric Vehicle (BEV)
- 5.3.2 Plug-in Hybrid Electric Vehicle (PHEV)
- 5.3.3 Hybrid Electric Vehicle (HEV)
- 5.4 By Vehicle Type
- 5.4.1 Passenger Cars
- 5.4.2 Light Commercial Vehicles
- 5.4.3 Medium and Heavy Trucks
- 5.4.4 Buses and Coaches
- 5.4.5 Two and Three-wheelers
- 5.5 By Geography
- 5.5.1 North America
- 5.5.1.1 United States
- 5.5.1.2 Canada
- 5.5.1.3 Mexico
- 5.5.2 Europe
- 5.5.2.1 Germany
- 5.5.2.2 United Kingdom
- 5.5.2.3 France
- 5.5.2.4 Italy
- 5.5.2.5 Spain
- 5.5.2.6 NORDIC Countries
- 5.5.2.7 Russia
- 5.5.2.8 Rest of Europe
- 5.5.3 Asia-Pacific
- 5.5.3.1 China
- 5.5.3.2 India
- 5.5.3.3 Japan
- 5.5.3.4 South Korea
- 5.5.3.5 ASEAN Countries
- 5.5.3.6 Australia and New Zealand
- 5.5.3.7 Rest of Asia Pacific
- 5.5.4 South America
- 5.5.4.1 Brazil
- 5.5.4.2 Argentina
- 5.5.4.3 Rest of South America
- 5.5.5 Middle East and Africa
- 5.5.5.1 Saudi Arabia
- 5.5.5.2 United Arab Emirates
- 5.5.5.3 South Africa
- 5.5.5.4 Egypt
- 5.5.5.5 Nigeria
- 5.5.5.6 Rest of Middle East and Africa
- 5.5.1 North America
6 Competitive Landscape
- 6.1 Market Concentration
- 6.2 Strategic Moves (M&A, Partnerships, PPAs)
- 6.3 Market Share Analysis (Market Rank/Share for key companies)
- 6.4 Company Profiles (includes Global level Overview, Market level overview, Core Segments, Financials as available, Strategic Information, Products & Services, and Recent Developments)
- 6.4.1 Contemporary Amperex Technology (CATL)
- 6.4.2 BYD Company Ltd (FinDreams)
- 6.4.3 LG Energy Solution Ltd
- 6.4.4 Panasonic Energy Co Ltd
- 6.4.5 Samsung SDI Co Ltd
- 6.4.6 SK On Co Ltd
- 6.4.7 CALB Group Co Ltd
- 6.4.8 Gotion High-tech Co Ltd
- 6.4.9 Eve Energy Co Ltd
- 6.4.10 Sunwoda Electronic Co Ltd
- 6.4.11 AESC (Envision)
- 6.4.12 Northvolt AB
- 6.4.13 SVOLT Energy Technology
- 6.4.14 Farasis Energy
- 6.4.15 ProLogium Technology Co Ltd
- 6.4.16 StoreDot Ltd
- 6.4.17 Tata Agratas Energy Storage
- 6.4.18 ACC Automotive Cells Company
- 6.4.19 QuantumScape Corp.
- 6.4.20 Redwood Materials Inc.
- 6.4.21 International Battery Co. (IBC)
- 6.4.22 Italvolt SpA
- 6.4.23 Britishvolt Ltd (in administration)
7 Market Opportunities & Future Outlook
- 7.1 White-space & Unmet-need Assessment
