
|
시장보고서
상품코드
2072633
싱가포르의 해상 화물 운송 시장 : 시장 점유율 분석, 업계 동향 및 통계, 성장 예측(2026-2031년)Singapore Sea Freight Transport - Market Share Analysis, Industry Trends & Statistics, Growth Forecasts (2026 - 2031) |
||||||
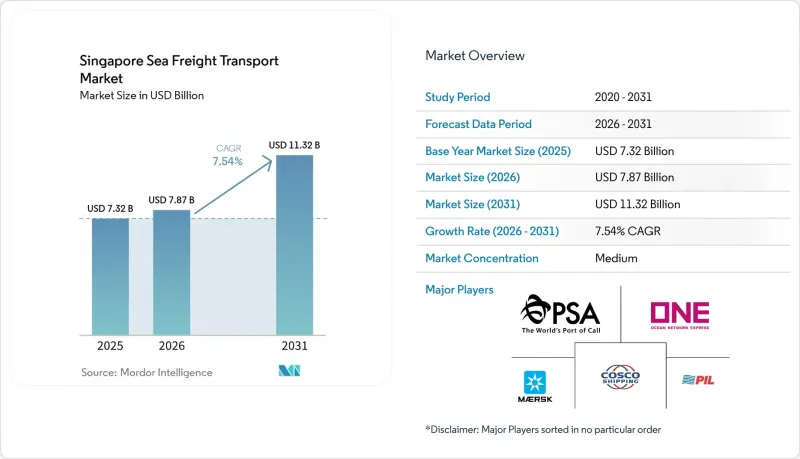
Mordor Intelligence에 의하면, 싱가포르 해상 화물 운송 시장 규모는 2026년 78억 7,000만 달러로 추정되고, 2025년 73억 2,000만 달러에서 확대해, 2031년에는 113억 2,000만 달러에 이를 것으로 예측됩니다.
2026-2031년 연평균 성장률(CAGR) 7.54%로 성장할 것으로 전망됩니다.
본 보고서에서는 업계를 화물 유형별(컨테이너 화물, 건화물 등), 최종 사용자 산업별(일렉트로믹스 및 반도체, 화학제품 및 석유화학제품, 식품 및 음료 등), 무역 경로별(아시아 내, 북미 등), 그리고 지역 및 항만 클러스터별(서부 지역, 중부 지역 등)로 분류하고 있습니다. 시장 전망은 금액(달러) 기준으로 제시되어 있습니다.
싱가포르의 해상 화물 운송 시장 동향 및 인사이트
투아스 메가포트로의 집약에 따라 처리량이 확대됨
기존의 도심 터미널을 투아스 메가포트로 통합하는 움직임에 힘입어, 싱가포르의 경쟁력은 변혁을 맞이하고 있습니다. 이에 따라 2040년대에는 계획 처리 능력이 6,500만 TEU에 달할 것으로 예상되며, 이는 2021년 처리량인 3,750만 TEU의 거의 2배에 해당합니다. 2022년에 개항한 1단계에서는 이미 200대 이상의 무인 운반차(AGV)가 도입되었으며, 이벤트 기반 디지털 백본이 야드 내 이동을 실시간으로 조정하고 있습니다. 시설이 하나의 연속된 해안선에 위치해 있기 때문에 시설 내 환적 횟수가 대폭 감소하여 크레인의 가동률과 선박의 회전율이 향상되고 있습니다. 그 결과, 운항의 예측 가능성이 높아져 해운사는 동일한 루프 내에서 중복 기항을 합리화할 수 있으며, 여유로 생긴 선박 일수를 추가 운항에 활용할 수 있게 됩니다. 이로부터 즉시 도출되는 결론은 선사가 항만 체류 시간 단축을 통해 비용 절감과 온실가스 감축을 동시에 실현함으로써 싱가포르의 허브로서의 위상을 더욱 공고히 하고 있다는 점입니다.
아세안으로의 생산 거점 이전이 수출 TEU를 견인
북아시아에서 아세안(ASEAN)으로 전자기기, 정밀기계, 내구소비재의 생산 거점이 이전됨에 따라, 싱가포르를 경유하는 새로운 수출량이 급증하고 있습니다. 유나이티드 마이크로일렉트로닉스 코퍼레이션(UMC)의 50억 달러 규모 반도체 팹 및 이와 유사한 투자로 인해 웨이퍼 제조 장비, 화학 약품, 완제품 칩이 유입되며, 이들은 아웃바운드 피더 선편으로 운송된 후 원양 루프 선편으로 환적됩니다. 베트남의 산업 확대도 비슷한 양상을 보이고 있으며, YCH 그룹과 베트남 우정공사가 구축 중인 디지털 무역 회랑을 통해 싱가포르를 화물 집하 거점으로 활용하고 있습니다. 공급업체의 거점이 확대됨에 따라 지정학적 리스크가 분산되고, 네트워크 밀도가 높아지고 있습니다. 이는 세계 경기 사이클이 둔화되더라도 아세안(ASEAN) 지역 내 수요가 부두 이용률을 계속 지탱해 줄 것임을 시사합니다.
변동이 심한 연료유 가격이 운임 상승으로 이어지고 있습니다.
홍해 우회 항로에 따른 상하이-유럽 노선의 운임이 256% 급등한 데 힘입어, 2024년 말까지 일부 장거리 무역 노선의 컨테이너 현물 운임이 2배 이상 치솟았습니다. 싱가포르의 바이오연료 공급량은 2023년에 3배로 증가하여, 싱가포르의 선박용 연료 생태계 내에 새로운 가격 지표를 창출하고, 해운사의 연료비에 영향을 미치고 있습니다. 대체 등급 연료는 탈탄소화 목표 달성에 기여하지만, 그 공급망은 아직 발전 단계에 있기 때문에 지수 연동형 연료 할증료에 변동성을 초래하고 있습니다. 따라서 화주들은 벙커유 소비량을 예측할 수 있도록 항만 내 체류 시간이 가장 짧은 항만을 우선적으로 선택하고 있습니다. 싱가포르의 효율성 향상은 그 변동성을 완화하는 것이지, 완전히 제거하는 것은 아닙니다.
부문별 분석
2025년, 컨테이너 화물은 싱가포르 해상 화물 시장에서 60.35%의 점유율을 차지했으며, 냉장 컨테이너의 도입이 확대됨에 따라 이러한 우위는 2031년까지 지속될 것으로 예측됩니다. 백신 및 바이오의약품용 온도 관리 컨테이너의 이용이 확대됨에 따라, PSA는 전원 연결 지점 및 제어 환경 모니터링 시스템을 확충하고 있으며, 컨테이너 사업은 생명과학 분야의 수출업체들에게 전략적 원동력이 되고 있습니다. 액체 벌크 화물은 바이오연료 혼합 및 주롱섬에 전용 부두가 필요한 초기 단계의 그린 암모니아 프로젝트에 힘입어 연평균 성장률(CAGR) 7.75%라는 가장 높은 성장세를 보일 것으로 전망됩니다. 건조 벌크 화물의 취급량은 지역 내 건설 수요를 배경으로 완만하게 증가하고 있는 반면, 일반 화물 및 롤온/롤오프(RO-RO)는 안정적인 틈새 시장으로 자리 잡고 있습니다. 이러한 부문에서 자동화, 디지털 트윈, 블록체인의 상호작용을 통해 예측 가능성이 높아짐에 따라, 터미널 운영자는 각 상품군별로 야드 내 물동량 배치를 미세 조정할 수 있게 됩니다.
기타 혜택 :
- 엑셀 형식 시장 예측(ME) 시트
- 3개월간의 애널리스트 지원
자주 묻는 질문
목차
제1장 서론
제2장 조사 방법
제3장 주요 요약
제4장 시장 구도
제5장 시장 규모 및 성장 예측
제6장 경쟁 구도
제7장 시장 기회 및 향후 전망
AJYAccording to Mordor Intelligence, singapore sea freight transport market size in 2026 is estimated at USD 7.87 billion, growing from 2025 value of USD 7.32 billion with 2031 projections showing USD 11.32 billion, growing at 7.54% CAGR over 2026-2031.

This report Segments the Industry Into by Cargo Type (Containerized Cargo, Dry Bulk Cargo and More), by End User Industry (Electronics and Semiconductors, Chemicals and Petrochemicals, Food and Beverage and More), by Trade Lane (Intra-Asia, North America and More) and by Region/Port Cluster(West Region, Central Region and More). The Market Forecasts are Provided in Terms of Value (USD).
Singapore Sea Freight Transport Market Trends and Insights
Tuas Mega-Port Consolidation Elevating Throughput
The consolidation of legacy city terminals into Tuas Mega-Port is transforming Singapore's competitiveness by pushing planned capacity toward 65 million TEUs in the 2040s-almost double the 37.5 million TEUs handled in 2021. Phase 1, opened in 2022, already deploys more than 200 Automated Guided Vehicles, while an event-driven digital backbone orchestrates yard moves in real time. Because the facility sits on a single contiguous coastline, internal trans-shifts fall sharply, improving crane utilisation and vessel turnaround. The resulting predictability lets carriers rationalise dual calls on the same loop, freeing vessel days for extra sailings. An immediate inference is that shipping lines gain both cost savings and greenhouse-gas reductions through shorter port dwell, tightening Singapore's hold on hub status.
ASEAN Manufacturing Shift Driving Export TEUs
Relocation of electronics, precision-engineering and consumer-durables production from North Asia into ASEAN is pumping new export volumes through Singapore. United Microelectronics Corp.'s USD 5 billion semiconductor fab and similar investments pull in wafer tools, chemicals and finished chips that ride outbound feeder services before transhipment onto deep-sea loops. Vietnam's industrial expansion follows an identical pattern, using Singapore as its load-centre gateway via digital trade corridors being built by YCH Group and Vietnam Post. The widened supplier footprint spreads geopolitical risk and deepens network density, indicating that intra-ASEAN demand will support berth utilisation even when global cycles soften.
Volatile Bunker Prices Translating into Higher Freight Rates
Container spot rates on several long-haul trades more than doubled through late 2024, propelled by a 256 % spike on the Shanghai-Europe route tied to Red Sea diversions. Biofuel bunkering volumes in Singapore tripled in 2023, creating a new pricing reference within the Singapore bunker fuel ecosystem and influencing carriers' fuel costs. Although alternative grades help with decarbonisation targets, their nascent supply chains inject volatility into index-linked fuel surcharges. Shippers therefore prioritise ports with minimal in-harbour delay so that bunker burn remains predictable; Singapore's efficiency gains cushion, but do not eliminate, that volatility.
Other drivers and restraints analyzed in the detailed report include:
- Preferential Trade Agreements Cutting Sea-Freight Costs
- DigitalPORT@SG & Electronic Bill-of-Lading Adoption
- Competitive Pressure from Port Klang and Tanjung Pelepas
For complete list of drivers and restraints, kindly check the Table Of Contents.
Segment Analysis
Containerised cargo commands a 60.35% Singapore Sea Freight market share in 2025, and its prominence is expected to persist through 2031 as reefer adoption widens. Higher uptake of temperature-controlled boxes for vaccines and biologics is pushing PSA to add plug points and controlled-atmosphere monitoring, making container operations a strategic enabler for life-science exporters. Liquid bulk shows the fastest forecast growth at 7.75% CAGR, propelled by biofuel blending and nascent green-ammonia projects that need dedicated berths on Jurong Island. Dry bulk volumes grow modestly on the back of regional construction demand, while general cargo and roll-on/roll-off remain stable niches. The interplay of automation, digital twins, and blockchain within these segments boosts predictability, allowing terminal operators to fine-tune yard staging for each commodity class.
Complete Report Scope:
- By Cargo Type
- Containerized Cargo
- Dry
- Reefer
- Dry Bulk Cargo
- Liquid Bulk Cargo
- General Cargo
- Roll-On/Roll-Off Cargo
- Containerized Cargo
- By End-User Industry
- Electronics & Semiconductors
- Chemicals & Petrochemicals
- Food & Beverage
- Pharmaceuticals & Healthcare
- Retail & E-commerce
- Others
- By Trade Lane
- Intra-Asia
- North America
- Europe
- Middle East
- Africa
- South America
- Oceania
- By Region / Port Cluster
- West Region (Tuas & Jurong)
- Central Region (Pasir Panjang & Keppel)
- North Region (Sembawang)
- East Region (Changi & Loyang)
List of Companies Covered in this Report:
- PSA International
- Ocean Network Express (ONE)
- Pacific International Lines (PIL)
- A.P. Moller-Maersk
- CMA CGM
- Evergreen Marine
- Hapag-Lloyd
- Cosco Shipping Lines
- Yang Ming
- X-Press Feeders
- DHL Group
- Kuehne + Nagel
- NYK Line (Yusen Logistics)
- DSV
- Sinotrans
- Toll Group
- OOCL
- Eastern Pacific Shipping
- ALPS Global Logistics Pte Ltd
- PAL Line Pte Ltd.*
Additional Benefits:
- The market estimate (ME) sheet in Excel format
- 3 months of analyst support
TABLE OF CONTENTS
1 Introduction
- 1.1 Study Assumptions & Market Definition
- 1.2 Scope of the Study
2 Research Methodology
3 Executive Summary
4 Market Landscape
- 4.1 Market Overview
- 4.2 Market Drivers
- 4.2.1 Consolidation of City Terminals into Tuas Mega-Port Elevating Throughput
- 4.2.2 ASEAN Manufacturing Shift Driving Export TEUs from Singapore
- 4.2.3 Preferential Trade Agreements (RCEP, CPTPP) Cutting Sea-Freight Costs
- 4.2.4 DigitalPORT@SG & Electronic Bill-of-Lading Adoption Shortening Dwell-Time
- 4.2.5 Expansion of Cold-Chain TEUs for Pharma & Perishables
- 4.2.6 Green & Digital Shipping-Corridor Initiatives
- 4.3 Market Restraints
- 4.3.1 Volatile Bunker Prices Translating into Higher All-in Freight Rates
- 4.3.2 Competitive Pressure from Port Klang & Tanjung Pelepas Feeder Rates
- 4.3.3 Shortage of 40-ft High-Cube Reefers During Peak Season
- 4.3.4 Tight Trucking Capacity for First/Last-Mile on Jurong Island
- 4.4 Value / Supply-Chain Analysis
- 4.5 Regulatory & Technological Outlook
- 4.6 Porter's Five Forces
- 4.6.1 Threat of New Entrants
- 4.6.2 Bargaining Power of Buyers
- 4.6.3 Bargaining Power of Suppliers
- 4.6.4 Threat of Substitutes
- 4.6.5 Intensity of Competitive Rivalry
5 Market Size & Growth Forecasts (Value, USD)
- 5.1 By Cargo Type
- 5.1.1 Containerized Cargo
- 5.1.1.1 Dry
- 5.1.1.2 Reefer
- 5.1.2 Dry Bulk Cargo
- 5.1.3 Liquid Bulk Cargo
- 5.1.4 General Cargo
- 5.1.5 Roll-On/Roll-Off Cargo
- 5.1.1 Containerized Cargo
- 5.2 By End-User Industry
- 5.2.1 Electronics & Semiconductors
- 5.2.2 Chemicals & Petrochemicals
- 5.2.3 Food & Beverage
- 5.2.4 Pharmaceuticals & Healthcare
- 5.2.5 Retail & E-commerce
- 5.2.6 Others
- 5.3 By Trade Lane
- 5.3.1 Intra-Asia
- 5.3.2 North America
- 5.3.3 Europe
- 5.3.4 Middle East
- 5.3.5 Africa
- 5.3.6 South America
- 5.3.7 Oceania
- 5.4 By Region / Port Cluster
- 5.4.1 West Region (Tuas & Jurong)
- 5.4.2 Central Region (Pasir Panjang & Keppel)
- 5.4.3 North Region (Sembawang)
- 5.4.4 East Region (Changi & Loyang)
6 Competitive Landscape
- 6.1 Market Concentration
- 6.2 Strategic Moves
- 6.3 Market Share Analysis
- 6.4 Company Profiles {(includes Global level Overview, Market level overview, Core Segments, Financials as available, Strategic Information, Market Rank/Share, Products & Services, Recent Developments)}
- 6.4.1 PSA International
- 6.4.2 Ocean Network Express (ONE)
- 6.4.3 Pacific International Lines (PIL)
- 6.4.4 A.P. Moller-Maersk
- 6.4.5 CMA CGM
- 6.4.6 Evergreen Marine
- 6.4.7 Hapag-Lloyd
- 6.4.8 Cosco Shipping Lines
- 6.4.9 Yang Ming
- 6.4.10 X-Press Feeders
- 6.4.11 DHL Group
- 6.4.12 Kuehne + Nagel
- 6.4.13 NYK Line (Yusen Logistics)
- 6.4.14 DSV
- 6.4.15 Sinotrans
- 6.4.16 Toll Group
- 6.4.17 OOCL
- 6.4.18 Eastern Pacific Shipping
- 6.4.19 ALPS Global Logistics Pte Ltd
- 6.4.20 PAL Line Pte Ltd.*
