

|
시장보고서
상품코드
2072763
서버 가상화 에너지 최적화 소프트웨어 시장 : 시장 점유율 분석, 업계 동향 및 통계, 성장 예측(2026-2031년)Server Virtualization Energy Optimization Software - Market Share Analysis, Industry Trends & Statistics, Growth Forecasts (2026 - 2031) |
||||||
 Mordor Intelligence
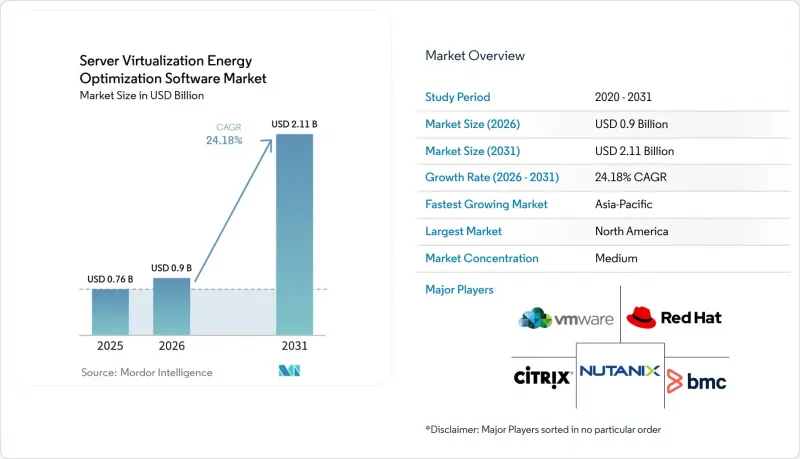
Mordor Intelligence에 의하면, 서버 가상화 에너지 최적화 소프트웨어 시장 규모는 2025년에 7억 6,000만 달러로 평가되었고, 2026년 9억 달러로 추정되고, 2031년까지 21억 1,000만 달러에 이를 것으로 예측되며, 2026-2031년 예측 기간 CAGR은 18.58%를 나타낼 전망입니다.
본 보고서는 구성 요소별(소프트웨어 및 서비스), 배포 방식별(클라우드 기반, 온프레미스형, 하이브리드형), 기업 규모별(대기업, 중소기업), 최종 사용자 산업별(제조업, 에너지 및 유틸리티, 은행, 금융서비스 및 보험(BFSI), 소매 및 소비재 등) 및 지역별로 분류되어 있습니다. 시장 전망치는 금액(달러)으로 표시되어 있습니다.
세계의 서버 가상화 에너지 최적화 소프트웨어 시장 동향 및 인사이트
가상화 서버 환경에서의 전력 밀도 증가
AI 가속기의 도입으로 인해 랙당 전력 소비가 집중되고 있으며, 전력 밀도는 서버 가상화 에너지 최적화 소프트웨어 시장에 있어 직접적인 과제가 되고 있습니다. 국제에너지기구(IEA)는 서버가 이미 데이터센터 전력 수요의 60%를 차지하고 있다고 밝히며, 2030년까지 서버의 전력 소비량이 크게 증가할 것으로 전망하고 있습니다. 이러한 변화가 중요한 이유는 기존의 정적 배치 모델이 범용 서버 환경을 위해 구축된 반면, 단일 AI 지원 랙이 30kW 이상을 소비할 수 있는 혼합 클러스터에는 대응하지 못하기 때문입니다. 『Energy』지에 게재된 2026년 연구에 따르면, 전력, 연산, 냉각의 최적화를 연계함으로써 정풍량 시스템에 비해 데이터센터의 전력 소비를 최대 30.56% 절감할 수 있는 것으로 밝혀졌습니다. 랙 밀도가 높아짐에 따라 VM 배치에 문제가 있을 경우 발생하는 비용이 선형적으로 증가하는 수준을 넘어 급격히 증가하기 때문에 서버 가상화 에너지 최적화 소프트웨어 시장은 핵심 운영 스택과 긴밀하게 연계된 상태를 유지하고 있습니다.
데이터센터의 에너지 비용 절감에 대한 기업의 관심이 높아지고 있습니다.
전력은 데이터센터 사업자에게 있어 점점 더 큰 운영 비용으로 작용하고 있기 때문에 구매자들이 에너지 관리와 인프라 비용 절감을 연계함에 따라 서버 가상화 에너지 최적화 소프트웨어 시장이 그 혜택을 누리고 있습니다. 가동률이 낮은 물리적 서버라도 피크 시간대의 전력 소비량 중 상당 부분을 차지하기 때문에 공식적인 지속가능성 목표가 설정되기 전부터 서버 통합을 통한 경제적 이점은 여전히 매력적입니다. 브로드컴은 2026년 5월, VMware Cloud Foundation 9.1에 지능형 메모리 계층화 및 압축 기능 강화가 도입되어, AI 및 비 AI 워크로드가 혼재된 클러스터에서 서버 비용을 최대 40% 절감했다고 발표했습니다. IBM의 보고서에 따르면, Atruvia사는 Turbonomic을 활용하여 18개월 동안 1,000대 이상의 물리적 서버를 폐기하고, 하드웨어 설치 면적을 20% 줄이는 동시에 에너지 소비량과 이산화탄소 배출량을 감축했습니다. 이에 따라 서버 가상화 에너지 최적화 소프트웨어 시장에서는 운영 효율성, 하드웨어 절감, 지속가능성 보고를 단일 소프트웨어 솔루션으로 통합하는 구매 결정이 늘어나고 있습니다.
멀티클라우드 및 하이브리드 가상화 스택 전반에 걸친 가시성의 한계
서버 가상화 에너지 최적화 소프트웨어 시장에서는 워크로드가 사설 환경과 공용 환경 사이를 이동할 때 여전히 가시성 문제에 직면해 있습니다. 에너지, 이용률 및 탄소 배출량에 관한 정보는 종종 각 공급업체별 콘솔에 분산되어 있어, 이로 인해 귀속의 일관성이 저하되고 대규모 최적화의 효과를 검증하기가 어려워지고 있습니다. 벤더들의 도구 역시 이러한 분산 현상을 반영하고 있는데, 브로드컴은 VMware 환경 내에서 이산화탄소 배출량 및 에너지 소비량 대시보드를 표시하고 있으며, 다이나트레이스는 독자적인 가시성 레이어를 통해 비용 및 이산화탄소 배출량 최적화 정보를 제공합니다. 동일한 보고서 기간 동안 워크로드가 온프레미스 VMware와 퍼블릭 클라우드 간에 이동하는 경우, 측정이 완료되기 전에 기준선 가정이 변경될 수 있습니다. 환경 간 텔레메트리 표준화가 더욱 진전될 때까지, 서버 가상화 에너지 최적화 소프트웨어 시장은 하이브리드 환경에서의 도입 결정 지연이라는 문제에 계속해서 직면하게 될 것입니다.
부문별 분석
2025년, 서버 가상화 에너지 최적화 소프트웨어 시장에서 소프트웨어가 시장 점유율의 70.12%를 차지했으며, 주요 구성 요소 부문으로 자리매김했습니다. 서버 가상화 에너지 최적화 소프트웨어 시장에서 구매자들은 독립형 도구보다 VM 최적화 플랫폼, 리소스 할당 엔진 및 전력 분석을 계속해서 우선시하고 있습니다. 워크로드 균형 조정, VM 통합, 용량 최적화 및 전력 분석을 결합한 번들형 제품 덕분에 개별 제품 카테고리 간의 경계가 점차 모호해지고 있습니다. 이에 따라 서버 가상화 에너지 최적화 소프트웨어 업계 내 경쟁은 플랫폼의 깊이와 통합을 통한 시장 정착도에 계속해서 초점이 맞추어지고 있습니다.
서비스 분야는 2026-2031년 연평균 성장률(CAGR) 20.12%로 확대될 것으로 예상되며, 이는 구성 요소 중 가장 높은 성장률입니다. 서버 가상화 에너지 최적화 소프트웨어 시장이 이러한 성장세를 보이고 있는 배경에는 많은 도입 사례에서 일회성 설치가 아닌 여러 하이퍼바이저 스택에 걸친 지속적인 튜닝이 필요하다는 점이 있습니다. IBM의 보고서에 따르면, Atruvia사는 Turbonomic을 활용하여 18개월 동안 1,000대 이상의 물리적 서버를 폐기하는 동시에 하드웨어 설치 면적을 20% 줄이고, 에너지 소비량과 이산화탄소 배출량을 감소시켰습니다. 또한, IBM은 2025년 5월 Turbonomic의 기능을 GitHub 및 HashiCorp Terraform으로 확장하여, 인프라스트럭처 애즈 코드(IaC) 환경 전반에서 해당 서비스의 역할을 확대했습니다.
2025년, 서버 가상화 에너지 최적화 소프트웨어 시장에서 클라우드 기반 도입이 66.41%를 차지하며, 도입 모델 중 압도적인 선두를 차지했습니다. 서버 가상화 에너지 최적화 소프트웨어 시장에서는 SaaS 모델을 통해 온프레미스 환경에서의 유지보수가 불필요해지고, 분산된 워크로드에 대한 지속적인 텔레메트리 수집이 가능해짐에 따라 클라우드 제공 방식이 선호되었습니다. 이 접근 방식은 온프레미스 소프트웨어 팀을 확대하지 않고도 더 신속한 업데이트와 대시보드에 대한 손쉬운 접근을 원하는 구매자에게도 적합합니다. 그렇긴 하지만, 클라우드가 주도적인 위치를 차지하고 있다고는 해도, 기밀성이 높은 워크로드나 에너지 데이터를 외부 집계 계층에 두는 것에 대한 우려는 여전히 남아 있습니다.
하이브리드 방식은 2031년까지 연평균 성장률(CAGR) 19.95%를 나타낼 것으로 예측되며, 가장 빠르게 성장하는 도입 방식이 될 전망입니다. 기업들은 기밀성이 높은 환경에 대해서는 독자적인 관리를 요구하면서도, 퍼블릭 클라우드상의 전체 워크로드에 대한 가시성을 유지하고자 하기 때문에 서버 가상화 에너지 최적화 소프트웨어 시장은 이러한 방향으로 움직이고 있습니다. 브로드컴은 AI 환경과 비 AI 환경이 혼재된 환경을 위해, 탄소 투명성과 에너지 효율이 높은 클러스터 대시보드를 확장함으로써 VMware Cloud Foundation 9.1을 이러한 균형을 중시하는 위치에 자리매김했습니다. 또한 브로드컴은 2025년 8월, 포춘 500대 기업 중 주요 10개사 중 9곳이 VMware Cloud Foundation 도입을 결정했다고 발표했으며, 이는 서버 가상화 에너지 최적화 소프트웨어 시장에서 하이브리드 아키텍처의 지속적인 강세를 입증하고 있습니다.
지역별 분석
2025년, 북미는 서버 가상화 에너지 최적화 소프트웨어 시장 점유율의 34.56%를 차지하며 최대 지역이 되었습니다. 이 지역은 고밀도 하이퍼스케일 및 엔터프라이즈 데이터센터의 거점일 뿐만 아니라, 에너지 관리와 재무 보고 간의 연계가 더욱 공고하다는 장점이 있습니다. 미국 의회조사국(CRS)에 따르면, 2023년 미국 데이터센터의 연간 에너지 소비량은 176 TWh에 달했으며, 이는 국내 전력 소비량의 4.4%에 해당합니다. 또한, 해당 기관은 이 수치가 2028년까지 2배 또는 3배로 늘어날 가능성이 있다고 지적하고 있습니다. 미국 증권거래위원회(SEC)의 기후 변화 정보 공개 규정에 따라 상장 기업들에게 스코프 1 및 스코프 2 추적의 중요성이 커지면서, 소프트웨어 기반의 에너지 귀속 방식의 타당성이 더욱 강화되었습니다. 캐나다와 멕시코는 여전히 지역 시장 전체에서 차지하는 비중이 작지만, 디지털 인프라 구축과 정보 공개에 대한 기대가 점차 제도화됨에 따라 서버 가상화 및 에너지 최적화 소프트웨어 시장은 이 지역에서도 확대되고 있습니다.
아시아태평양은 2031년까지 연평균 성장률(CAGR) 23.78%를 기록하며 성장할 것으로 예측되며, 지역별 부문 중 가장 높은 성장률을 보일 것으로 전망됩니다. 이 지역에서 서버 가상화 에너지 최적화 소프트웨어 시장이 성장세를 보이고 있는 것은 새로운 데이터센터의 용량 확대, 국가 차원의 데이터 규제, 그리고 더욱 엄격해진 효율 기준에 따라 사업자들이 전력 관리를 더욱 적극적으로 수행해야 하는 상황에 놓여 있기 때문입니다. 싱가포르, 인도, 중국, 호주가 주목을 받고 있는 이유는 사업자들이 이용률, 냉각 부하, 보고의 질에 대한 관리를 소홀히 하지 않으면서도 용량을 확대해야 하기 때문입니다. 이러한 요인들이 복합적으로 작용하여, 인프라 성장이 완만한 지역에 비해 아시아태평양의 서버 가상화 에너지 최적화 소프트웨어 시장에는 더 광범위한 성장 여지가 생겨나고 있습니다.
유럽은 절대값 기준으로 볼 때 아시아태평양보다 성장 속도가 완만하지만, 보고 의무가 선택 사항이 아닌 필수 사항이기 때문에 서버 가상화 에너지 최적화 소프트웨어 시장에서 가장 견실한 지역 중 하나로 자리매김하고 있습니다. 유럽연합 집행위원회는 500 kW를 초과하는 데이터센터에 대해 연례 성과 보고를 의무화하고 있으며, 2026년 5월에 시행된 보고 주기에 따라 규정 준수가 재구매의 요인이 되고 있습니다. 2025년 7월 EU가 실시한 에너지 성능 및 지속가능성 보고서의 향후 방안에 관한 조사에 따르면, 규제는 앞으로 더욱 강화될 전망이며, 스웨덴이나 독일 등 각국의 조치도 이미 이러한 방향을 뒷받침하고 있습니다. 남미, 중동 및 아프리카에서는 아직 도입 초기 단계이지만, 이들 지역 전반에 걸쳐 대규모 신규 디지털 인프라 건설 프로젝트에서 서버 가상화 에너지 최적화 소프트웨어 시장이 부상하기 시작하고 있습니다.
기타 혜택 :
- 엑셀 형식 시장 예측(ME) 시트
- 3개월간의 애널리스트 지원
자주 묻는 질문
목차
제1장 서론
제2장 조사 방법
제3장 주요 요약
제4장 시장 구도
제5장 시장 규모 및 성장 예측
제6장 경쟁 구도
제7장 시장 기회 및 향후 전망
AJY 26.07.07According to Mordor Intelligence, the server virtualization energy optimization software market size was valued at USD 0.76 billion in 2025 and estimated to grow from USD 0.90 billion in 2026 to reach USD 2.11 billion by 2031, at a CAGR of 18.58% during the forecast period 2026-2031.
This report is Segmented by Component (Software and Services), Deployment Mode (Cloud-Based, On-Premises, and Hybrid), Enterprise Size (Large Enterprises, and Small and Medium Enterprises), End-User Industry (Industrial Manufacturing, Energy and Utilities, BFSI, Retail and Consumer Goods, and More), and Geography. The Market Forecasts are Provided in Terms of Value (USD).
Global Server Virtualization Energy Optimization Software Market Trends and Insights
Rising Power Density In Virtualized Server Environments
AI accelerator adoption is concentrating more wattage per rack, turning power density into a direct software issue for the server virtualization energy-optimization software market. The International Energy Agency stated that servers already accounted for 60% of data center electricity demand and projected that server electricity consumption would grow strongly through 2030. That change matters because static placement models were built for general-purpose server estates, not for mixed clusters where a single AI-capable rack can draw 30 kW or more. A 2026 study published in Energy found that coordinated power, computing, and cooling optimization reduced data center power consumption by up to 30.56% versus constant air volume systems. As rack density rises, the cost of poor VM placement increases faster than linearly, keeping the server virtualization energy-optimization software market close to the core operating stack.
Growing Enterprise Focus On Data Center Energy Cost Reduction
Electricity has become a larger operating expense for data center operators, so the server virtualization energy optimization software market is benefiting as buyers link energy control with infrastructure cost reduction. Physical servers that run at low utilization still consume a large share of peak power, which keeps consolidation economics attractive even before formal sustainability targets are applied. Broadcom stated in May 2026 that VMware Cloud Foundation 9.1 introduced intelligent memory tiering and enhanced compression, reducing server costs by up to 40% for clusters running mixed AI and non-AI workloads. IBM reported that Atruvia used Turbonomic to decommission more than 1,000 physical servers in 18 months, cutting hardware footprint by 20% while lowering energy use and carbon emissions. This is pushing the server virtualization energy optimization software market toward purchase decisions that combine operating efficiency, hardware reduction, and sustainability reporting in a single software solution.
Limited Visibility Across Multi-Cloud And Hybrid Virtualization Stacks
The server virtualization energy optimization software market still faces visibility challenges when workloads move between private and public environments. Energy, utilization, and carbon information are often split across provider-specific consoles, which undermines attribution consistency and makes it harder to validate optimization at scale. Vendor tools reflect this fragmentation, with Broadcom surfacing carbon and energy dashboards inside VMware environments and Dynatrace exposing cost and carbon optimization through its own observability layer. When a workload shifts between on-premises VMware and public cloud during the same reporting window, baseline assumptions can change before measurement is complete. Until telemetry becomes more uniform across environments, the server virtualization energy optimization software market will continue to face slower rollout decisions in hybrid estates.
Other drivers and restraints analyzed in the detailed report include:
- Expansion Of Hyperconverged Infrastructure And Consolidated Compute Stacks
- Compliance Pressure For Carbon Reporting And Energy Transparency
- Integration Complexity With Legacy Orchestration And Monitoring Tools
For complete list of drivers and restraints, kindly check the Table Of Contents.
Segment Analysis
Software accounted for 70.12% of the server virtualization energy optimization software market share in 2025, making it the leading component segment. In the server virtualization energy optimization software market, buyers continued to prioritize VM optimization platforms, resource allocation engines, and power analytics over stand-alone tools. Bundled offerings that combine workload balancing, VM consolidation, capacity optimization, and power analytics are reducing the boundary between separate product categories. This keeps competition centered on platform depth and integration stickiness inside the server virtualization energy optimization software industry.
Services are projected to expand at a 20.12% CAGR from 2026 to 2031, the fastest rate within the component mix. The server virtualization energy optimization software market is seeing that growth because many deployments require continuous tuning across mixed hypervisor stacks rather than a one-time installation. IBM reported that Atruvia used Turbonomic to decommission more than 1,000 physical servers in 18 months while reducing its hardware footprint by 20% and lowering energy use and carbon emissions. IBM also extended Turbonomic into GitHub and HashiCorp Terraform in May 2025, which widened the services role across infrastructure-as-code environments.
Cloud-based deployment accounted for 66.41% of the server virtualization energy optimization software market in 2025, giving it a clear lead among deployment models. The server virtualization energy optimization software market favored cloud delivery because SaaS models eliminated local maintenance and enabled continuous telemetry from distributed workloads. This approach also fits buyers that wanted faster updates and easier dashboard access without expanding on-site software teams. Even so, cloud leadership has not removed concerns about placing sensitive workloads and energy data in external aggregation layers.
Hybrid deployment is projected to grow at a 19.95% CAGR through 2031, making it the fastest-growing deployment mode. The server virtualization energy optimization software market is moving in this direction because enterprises want private control for sensitive environments while still maintaining visibility across public cloud workloads. Broadcom positioned VMware Cloud Foundation 9.1 around that balance by extending carbon transparency and energy-efficient cluster dashboards for mixed AI and non-AI environments. Broadcom also stated in August 2025 that 9 of the top 10 Fortune 500 companies had committed to VMware Cloud Foundation, underscoring the staying power of hybrid architectures in the server virtualization energy-optimization software market.
Complete Report Scope:
- By Component
- Software
- VM optimization platforms
- Resource allocation engines
- Energy-aware workload balancing
- VM consolidation tools
- Capacity optimization software
- Power consumption analytics
- Services
- Software
- By Deployment Mode
- Cloud-Based
- On-Premises
- Hybrid
- By Enterprise Size
- Large Enterprises
- Small and Medium Enterprises
- By End-user Industry
- Industrial Manufacturing
- Energy and Utilities
- BFSI
- Retail and Consumer Goods
- IT and Telecom
- Healthcare and Life Sciences
- Government and Public Sector
- Transportation and Logistics
- Other End-user Industries
- By Geography
- North America
- United States
- Canada
- Mexico
- South America
- Brazil
- Argentina
- Rest of South America
- Europe
- Germany
- United Kingdom
- France
- Italy
- Spain
- Russia
- Netherlands
- Rest of Europe
- Asia-Pacific
- China
- Japan
- India
- South Korea
- Australia and New Zealand
- Rest of Asia-Pacific
- Middle East
- Saudi Arabia
- United Arab Emirates
- Rest of Middle East
- Africa
- South Africa
- Nigeria
- Rest of Africa
- North America
Geography Analysis
North America held 34.56% of the server virtualization energy optimization software market share in 2025, making it the largest region. The region benefits from dense hyperscale and enterprise data center footprints, along with stronger links between energy management and financial reporting. The Congressional Research Service stated that U.S. data center annual energy use reached 176 TWh in 2023, equal to 4.4% of national electricity use, and it noted that the figure could double or triple by 2028. The SEC climate disclosure rule heightened the importance of Scope 1 and Scope 2 tracking for listed companies, strengthening the case for software-based energy attribution. Canada and Mexico remain smaller parts of the regional base, but the server virtualization energy optimization software market is expanding there as digital infrastructure and disclosure expectations become more formal.
Asia-Pacific is projected to grow at 23.78% CAGR through 2031, making it the fastest regional segment. The server virtualization energy optimization software market is gaining momentum here because new data center capacity, sovereign data rules, and tighter efficiency standards are pushing operators to manage power more actively. Singapore, India, China, and Australia are drawing attention because operators need to scale capacity without losing control over utilization, cooling pressure, and reporting quality. This combination gives the server virtualization energy optimization software market a broader runway in Asia-Pacific than in regions with slower infrastructure growth.
Europe is growing more slowly than Asia-Pacific on an absolute basis, yet it remains one of the most durable parts of the server virtualization energy optimization software market because reporting obligations are mandatory rather than optional. The European Commission requires annual performance reporting for data centers above 500 kW, and the reporting cycle that came into force in May 2026 has made compliance a repeat-purchase driver. A July 2025 EU study on the next steps for energy performance and sustainability reporting indicated that the rules will become more demanding over time, while national measures in countries such as Sweden and Germany are already reinforcing that direction. South America, the Middle East, and Africa are still earlier adopters, yet the server virtualization energy optimization software market is beginning to appear in large new-build digital infrastructure projects across those regions.
- VMware, Inc.
- Red Hat, Inc.
- Nutanix, Inc.
- BMC Software, Inc.
- Citrix Systems, Inc.
- Nlyte Software, Inc.
- Densify Inc.
- ParkMyCloud, Inc.
- Device42, Inc.
- Turbonomic, Inc.
- Flexera Software LLC
- Dell Technologies Inc.
- Hewlett Packard Enterprise Company
- Lenovo Group Limited
- Oracle Corporation
- Microsoft Corporation
- IBM Corporation
- Broadcom Inc.
- OpenText Corporation
- ManageEngine, a division of Zoho Corporation Pvt. Ltd.
- Karios AI
- Sunbird Software
- SolarWinds Corporation
- Dynatrace, Inc.
- Grafana Labs, Inc.
Additional Benefits:
- The market estimate (ME) sheet in Excel format
- 3 months of analyst support
TABLE OF CONTENTS
1 INTRODUCTION
- 1.1 Study Assumptions and Market Definition
- 1.2 Scope of the Study
2 RESEARCH METHODOLOGY
3 EXECUTIVE SUMMARY
4 MARKET LANDSCAPE
- 4.1 Market Overview
- 4.2 Market Drivers
- 4.2.1 Rising Power Density in Virtualized Server Environments
- 4.2.2 Growing Enterprise Focus on Data Center Energy Cost Reduction
- 4.2.3 Expansion of Hyperconverged Infrastructure and Consolidated Compute Stacks
- 4.2.4 Compliance Pressure for Carbon Reporting and Energy Transparency
- 4.2.5 AI-Assisted Power Scheduling and Workload Placement
- 4.2.6 Demand for Granular VM-Level Energy Attribution
- 4.3 Market Restraints
- 4.3.1 Limited Visibility Across Multi-Cloud and Hybrid Virtualization Stacks
- 4.3.2 Integration Complexity With Legacy Orchestration and Monitoring Tools
- 4.3.3 ROI Uncertainty for Smaller It Environments
- 4.3.4 Data Quality Gaps in Power Telemetry and Asset Mapping
- 4.4 Industry Value-Chain Analysis
- 4.5 Impact of Macroeconomic Factors on the Market
- 4.6 Regulatory Landscape
- 4.7 Technological Outlook
- 4.8 Porter's Five Forces Analysis
- 4.8.1 Threat of New Entrants
- 4.8.2 Bargaining Power of Buyers
- 4.8.3 Bargaining Power of Suppliers
- 4.8.4 Threat of Substitutes
- 4.8.5 Intensity of Competitive Rivalry
5 MARKET SIZE AND GROWTH FORECASTS (VALUE)
- 5.1 By Component
- 5.1.1 Software
- 5.1.1.1 VM optimization platforms
- 5.1.1.2 Resource allocation engines
- 5.1.1.3 Energy-aware workload balancing
- 5.1.1.4 VM consolidation tools
- 5.1.1.5 Capacity optimization software
- 5.1.1.6 Power consumption analytics
- 5.1.2 Services
- 5.1.1 Software
- 5.2 By Deployment Mode
- 5.2.1 Cloud-Based
- 5.2.2 On-Premises
- 5.2.3 Hybrid
- 5.3 By Enterprise Size
- 5.3.1 Large Enterprises
- 5.3.2 Small and Medium Enterprises
- 5.4 By End-user Industry
- 5.4.1 Industrial Manufacturing
- 5.4.2 Energy and Utilities
- 5.4.3 BFSI
- 5.4.4 Retail and Consumer Goods
- 5.4.5 IT and Telecom
- 5.4.6 Healthcare and Life Sciences
- 5.4.7 Government and Public Sector
- 5.4.8 Transportation and Logistics
- 5.4.9 Other End-user Industries
- 5.5 By Geography
- 5.5.1 North America
- 5.5.1.1 United States
- 5.5.1.2 Canada
- 5.5.1.3 Mexico
- 5.5.2 South America
- 5.5.2.1 Brazil
- 5.5.2.2 Argentina
- 5.5.2.3 Rest of South America
- 5.5.3 Europe
- 5.5.3.1 Germany
- 5.5.3.2 United Kingdom
- 5.5.3.3 France
- 5.5.3.4 Italy
- 5.5.3.5 Spain
- 5.5.3.6 Russia
- 5.5.3.7 Netherlands
- 5.5.3.8 Rest of Europe
- 5.5.4 Asia-Pacific
- 5.5.4.1 China
- 5.5.4.2 Japan
- 5.5.4.3 India
- 5.5.4.4 South Korea
- 5.5.4.5 Australia and New Zealand
- 5.5.4.6 Rest of Asia-Pacific
- 5.5.5 Middle East
- 5.5.5.1 Saudi Arabia
- 5.5.5.2 United Arab Emirates
- 5.5.5.3 Rest of Middle East
- 5.5.6 Africa
- 5.5.6.1 South Africa
- 5.5.6.2 Nigeria
- 5.5.6.3 Rest of Africa
- 5.5.1 North America
6 COMPETITIVE LANDSCAPE
- 6.1 Market Concentration
- 6.2 Strategic Moves
- 6.3 Market Share Analysis
- 6.4 Company Profiles (includes Global Level Overview, Market Level Overview, Core Segments, Financials as available, Strategic Information, Market Rank/Share, Products and Services, Recent Developments)
- 6.4.1 VMware, Inc.
- 6.4.2 Red Hat, Inc.
- 6.4.3 Nutanix, Inc.
- 6.4.4 BMC Software, Inc.
- 6.4.5 Citrix Systems, Inc.
- 6.4.6 Nlyte Software, Inc.
- 6.4.7 Densify Inc.
- 6.4.8 ParkMyCloud, Inc.
- 6.4.9 Device42, Inc.
- 6.4.10 Turbonomic, Inc.
- 6.4.11 Flexera Software LLC
- 6.4.12 Dell Technologies Inc.
- 6.4.13 Hewlett Packard Enterprise Company
- 6.4.14 Lenovo Group Limited
- 6.4.15 Oracle Corporation
- 6.4.16 Microsoft Corporation
- 6.4.17 IBM Corporation
- 6.4.18 Broadcom Inc.
- 6.4.19 OpenText Corporation
- 6.4.20 ManageEngine, a division of Zoho Corporation Pvt. Ltd.
- 6.4.21 Karios AI
- 6.4.22 Sunbird Software
- 6.4.23 SolarWinds Corporation
- 6.4.24 Dynatrace, Inc.
- 6.4.25 Grafana Labs, Inc.
7 MARKET OPPORTUNITIES AND FUTURE OUTLOOK
- 7.1 White-Space and Unmet-Need Assessment


