

|
시장보고서
상품코드
2072973
AI 탄소발자국 관리 소프트웨어 시장 : 시장 점유율 분석, 업계 동향 및 통계, 성장 예측(2026-2031년)AI Carbon Footprint Management Software - Market Share Analysis, Industry Trends & Statistics, Growth Forecasts (2026 - 2031) |
||||||
 Mordor Intelligence
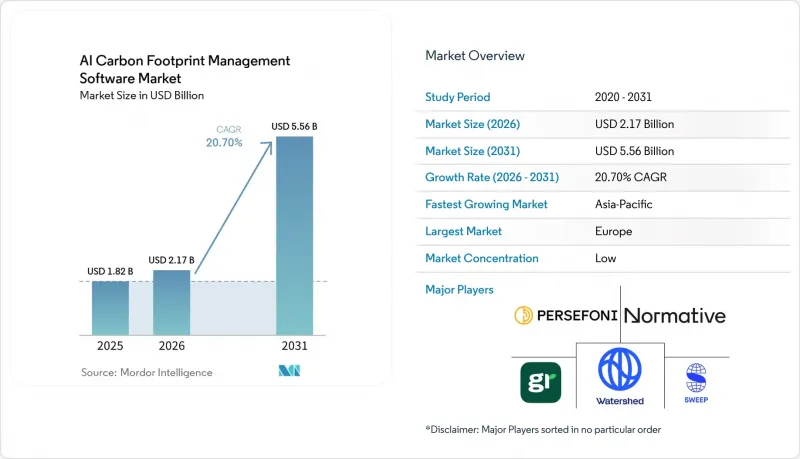
Mordor Intelligence에 의하면, AI 탄소발자국 관리 소프트웨어 시장 규모는 2025년에 18억 2,000만 달러로 평가되었고, 2026-2031년 CAGR 20.70%로 확대될 전망이며, 2031년에는 55억 6,000만 달러에 이를 것으로 예측됩니다.
본 보고서는 구성 요소별(소프트웨어 및 서비스), 배포 방식별(클라우드 기반, 온프레미스형, 하이브리드형), 기업 규모별(대기업 및 중소기업), 최종 이용 산업별(IT 및 통신, 은행, 금융서비스 및 보험(BFSI), 산업 제조, 에너지 및 유틸리티, 소매 및 전자상거래 등) 및 지역별로 분류되어 있습니다. 시장 전망은 금액(달러) 기준으로 제시되어 있습니다.
세계의 AI 탄소 발자국 관리 소프트웨어 시장 동향 및 인사이트
스코프 1, 스코프 2 및 스코프 3 공시에 대한 규제 압력 증가
공시 의무에 관한 규정은 배출량 보고 초기 단계에 비해 현재 기업 보고 대상의 더 큰 비중을 포괄하고 있으며, 이는 AI 탄소 발자국 관리 소프트웨어 시장의 성장을 직접적으로 뒷받침하고 있습니다. EU의 '기업 지속가능성 보고 지침'에서는 직원 수가 500명을 초과하는 약 500개의 대규모 공익 기업을 대상으로 하는 1차 대상 기업들에 대해, 2024년도 데이터에 관한 ESRS 기준의 지속가능성 보고서를 2025년에 공표할 의무가 부과되어 있습니다. 캘리포니아주의 '기후 변화 기업 데이터 책임법'에 따르면, 해당 주에서 사업을 영위하며 연간 매출액이 10억 달러를 초과하는 사업체에 대해 2026년 8월 10일부터 스코프 1 및 스코프 2 보고가 의무화되며, 스코프 3 보고는 2027년부터 시작됩니다. 이번 주기에서 실무상의 변화는 공시가 광범위한 추정이 아니라 추적 가능성 및 외부 심사와 점점 더 밀접하게 연계되고 있다는 점에 있으며, 이에 따라 원본 기록의 보존, 워크플로우 관리 및 보고의 일관성을 보장하는 시스템의 가치가 높아지고 있습니다. 이러한 변화로 인해 소프트웨어 도입은 예전만큼 임의적인 판단에 맡겨지지 않게 되었습니다. 왜냐하면 기업은 더 이상 사내의 지속가능성 검토뿐만 아니라, 규제 당국의 면밀한 검토와 검증 절차를 견뎌낼 수 있는 결과물을 필요로 하기 때문입니다.
기업의 탄소중립 공약과 '과학 기반 목표'의 도입
2025년에는 기업의 탈탄소화 약속이 더욱 공고해지면서, AI 탄소 발자국 관리 소프트웨어 시장의 구조적 수요가 강화되었습니다. '과학 기반 목표(SBTi)'이 이니셔티브에 따르면, 2025년 말 기준으로 검증된 단기 목표를 제시한 기업은 9,764개사에 달하고, 2024년 대비 40% 증가했습니다. 한편, 검증된 탄소중립 목표를 제시한 기업은 61% 증가한 2,325개사가 되었습니다. 해당 추적 기관에 따르면, 검증된 목표나 유효한 약속을 가진 기업의 총 수는 12,353개사에 달하며, 이는 현재의 도입 현황만으로는 추측할 수 있는 것보다 훨씬 더 대규모의 미래 보고 및 모니터링 기반이 존재함을 시사합니다. 아시아에서는 검증 완료된 기업 수가 가장 빠르게 증가했으며, 중국에서는 검증 완료된 목표 수가 92% 증가했습니다. 이에 따라, 그동안 카본 소프트웨어 조달 측면에서 성숙도가 낮은 것으로 여겨졌던 시장에서도 대상 수요층이 확대되고 있습니다. 또한, SBTi가 제안하고 있는 'Corporate Net-Zero Standard'의 개정안에서는 스코프 3의 적용 범위가 더욱 엄격해지는 방향이 제시되어 있으며, 기업들은 더 이상 용납되지 않을 가능성이 있는 대략적인 평균값에 의존하기보다는 1차 데이터 수집 및 정밀도가 높은 인벤토리 시스템에 대한 조기 투자를 촉진하도록 권고받고 있습니다.
스코프 3공급망 전반에 걸쳐 나타나는 데이터 품질의 큰 격차
스코프 3는 기업 온실가스 인벤토리 중에서도 여전히 가장 어려운 부분입니다. 그 이유는 기초가 되는 데이터가 대부분의 경우 직접적인 업무 관리 범위를 벗어나 있으며, 보고 체계의 성숙도가 각기 다른 대규모 공급업체 네트워크를 통해 유통되고 있기 때문입니다. Normative사는 자사가 '라스트 마일 문제'라고 표현되는 과제를 해결하기 위해, 2026년 2월에 '탄소 인벤토리 관리 서비스'를 시작했습니다. 이 회사의 GHG 프로토콜 인증 어드바이저는 2026년 첫 6주 동안만 1,000시간 이상의 고객 지원 시간을 기록했습니다. EcoVadis는 2026년 4월, Carbmee를 통합하여 '카본 데이터 네트워크'를 확충했습니다. Carbmee의 '환경 정보 시스템'은 SKU 수준에서 배출량 집중 발생 지점을 파악하고, 탈탄소화 노력을 재무적 수익 지표와 연계함으로써, 구매자가 공급업체 수준의 보고를 개선하기 위해 현재 필요로 하는 상세한 정보를 보여줍니다. 플랫폼 도구가 개선되기는 했지만, 공급업체 데이터 수집에는 여전히 많은 노력이 필요하고 조사 방법에도 일관성이 부족하기 때문에 소프트웨어 구매부터 완전한 규정 준수에 이르기까지의 과정이 지연되고 있습니다. 이러한 제약은 다층적인 공급망에서 특히 큰 문제가 됩니다. 왜냐하면 소프트웨어는 데이터를 일원화할 수는 있지만, 모든 공급업체 노드에서 제공되는 불충분한 1차 데이터에 즉각적으로 대응할 수는 없기 때문입니다.
부문별 분석
2025년 AI 탄소 발자국 관리 소프트웨어 시장에서 소프트웨어가 70.34%를 차지했습니다. 이는 구매자들이 여전히 스코프 1, 2, 3의 데이터를 단일 운영 환경에 통합하는 확장 가능한 플랫폼을 선호하고 있음을 보여줍니다. 이러한 경향은 기업이 여러 사업체에 걸친 워크플로우, 표준화된 조사 기법, 그리고 사업 부문이나 관할 구역을 아우르는 일관된 보고 체계를 필요로 하는 대규모 도입 사례에서 가장 두드러지게 나타납니다. Workiva는 2026년 5월, CDP 2026 설문조사에 대응하고, AI를 활용한 간소화된 ESRS 인텔리전스 기능을 플랫폼에 추가했습니다. 이는 각 벤더들이 컴플라이언스 관련 기능을 독립적인 자문 업무로 취급하기보다는 제품 계층에 직접 통합하는 경향을 반영한 것입니다. SAP의 Green Ledger 역시 이와 유사한 방향성을 보여주고 있으며, S/4HANA Cloud에 트랜잭션 수준의 탄소 회계 기능을 도입했습니다. 이를 통해 재무팀이 이미 신뢰하고 있는 시스템 내에서 탄소 금융 통합을 위한 광범위한 전환이 촉진되고 있습니다. 카본 데이터가 재무 보고, 내부 통제 및 기업의 업무 흐름과 더욱 밀접하게 연계됨에 따라, 소프트웨어는 대규모 재현성과 통합된 거버넌스를 제공함으로써 여전히 주도적인 역할을 수행하고 있습니다.
서비스 부문은 가장 빠르게 성장하고 있는 분야이며, AI 탄소 발자국 관리 소프트웨어 시장은 2026-2031년 이 부문에서 연평균 성장률(CAGR) 21.45%를 기록하며 확대될 것으로 전망됩니다. 이러한 성장은 플랫폼이 자동화할 수 있는 범위와 조직이 여전히 인적 작업을 필요로 하는 범위 사이에 명확한 실행상의 격차가 존재함을 반영하고 있습니다. 특히 공급업체 데이터의 수집, 정리, 검증이 필요한 경우에는 이러한 경향이 두드러집니다. 2026년에 Normative가 관리형 서비스를 출시한 것은 구매자가 이미 소프트웨어 기능을 이용할 수 있는 상황임에도 불구하고, 실질적인 재고 관리 지원에 대해 계속해서 대가를 지불하고 있음을 보여줍니다. 또한, 보증 처리가 가능한 보고서를 작성하기 위해서는 방법론의 일관성, 증거의 처리, 프로세스의 엄격성이 요구되지만, 많은 조직에서 여전히 사내에 이러한 체계가 갖춰져 있지 않기 때문에 서비스 부문의 중요성도 높아지고 있습니다. 장기적으로는 구독 수익과 배송 지원의 경계가 모호한 상태로 남을 가능성이 높습니다. 왜냐하면 소프트웨어와 실행 지원을 결합할 수 있는 공급업체가 수요를 성공적인 성과로 전환하는 데 있어 유리한 입장에 있기 때문입니다.
2025년에는 클라우드 기반 도입이 매출의 67.12%를 차지했으나, 하이브리드 도입은 2031년까지 연평균 성장률(CAGR) 22.08%로 가장 빠른 성장세를 보일 것으로 전망됩니다. 클라우드가 계속해서 가장 널리 채택되는 모델로 자리매김한 이유는 실시간 API를 지원하고 공급업체의 업데이트를 용이하게 하며, 지속적인 데이터 업데이트에 의존하는 보고서 작성 워크플로우와의 신속한 통합을 가능하게 하기 때문입니다. 또한, 이 모델은 각 거점에 새로운 인프라를 구축하지 않고도 거점, 기능, 외부 파트너 전반에 걸친 통합적인 가시성을 원하는 기업의 운영상의 요구 사항에도 부합합니다. 한편, 일부 구매자들은 모든 운영 데이터를 온프레미스 외부로 이전하지 않으면서도 고급 분석 기능과 보고서 작성의 유연성을 원하고 있기 때문에 하이브리드 모델도 지지를 얻고 있습니다. 이러한 경향은 규제가 엄격한 환경에서 특히 두드러집니다. 이러한 환경에서는 보고서 작성 팀이 클라우드 규모의 모델링 도구가 필요한 반면, 기밀성이 높은 플랜트, 직원 또는 프로세스에 관한 데이터는 보다 엄격한 내부 관리 하에 두어야 하기 때문입니다.
2026년 1월에 일반 서비스가 시작된 Microsoft의 Dynamics 365 Business Central '2025 Wave 2' 릴리스에서는 ERP 구매 워크플로우에 Scope 3 가치사슬 프로세스 자동화 기능이 추가되었습니다. 이는 도입 옵션이 기업이 이미 사용하고 있는 시스템에 따라 점점 더 좌우되고 있음을 보여줍니다. 석유 및 가스, 국방, 그리고 배출량 데이터가 상업적으로 기밀성이 높거나 기밀로 취급되는 운영 정보와 겹치는 공공 부문의 일부 등에서는 온프레미스 도입이 여전히 중요합니다. 이러한 환경에서 하이브리드 아키텍처는 일시적인 타협안이라기보다는 온프레미스에서의 제어와 클라우드 기반의 지능을 결합한 장기적인 운영 모델이라고 할 수 있습니다. 따라서 AI 탄소 발자국 관리 소프트웨어 시장은 데이터 소스는 사내에 유지하면서, 분석, 벤치마킹, 보고서 작성 기능은 유연한 클라우드 환경으로 지속적으로 이전하는 다층적인 도입 설계로 나아가고 있습니다.
지역별 분석
2025년, 유럽은 AI 탄소 발자국 관리 소프트웨어 시장 점유율의 34.56%를 차지하며 1위를 유지했습니다. 이러한 위상은 CSRD(기후 관련 공시 규정)의 단계적 도입과 유럽 주요 기업들의 기후 변화 대응 노력이 전반적으로 성숙해졌습니다는 점에 힘입은 것입니다. 'Science Based Targets' 이니셔티브에 따르면, CAC 40 및 DAX 40 구성 기업들은 2025년 말까지 각각 70% 및 68%의 목표 달성률을 기록했으며, 이는 지속적인 소프트웨어 이용, 계약 갱신 및 업그레이드를 위한 견고한 도입 기반이 마련되어 있음을 시사합니다. 이러한 규제와 목표에 대한 검증이 맞물리면서, 유럽 수요는 규정 준수를 위한 초기 도입 단계에 그치지 않습니다. 많은 구매 기업들은 더 뛰어난 관리 기능, 더 광범위한 Scope 3 적용 범위, 그리고 더 강력한 감사 지원도 필요로 하기 때문입니다. 따라서 이 지역은 AI 탄소 발자국 관리 소프트웨어 시장에서 규제 이행과 기업의 노력이 어떻게 서로를 보완할 수 있는지를 보여주는 가장 명확한 사례로 계속해서 자리 잡고 있습니다.
북미에서는 규제 기한이 다가옴에 따라 도입이 본격화되는 단계로 접어들었습니다. 캘리포니아주 SB 253법에 따라, 해당 주에서 사업을 영위하는 대규모 사업체에 대해 스코프 1 및 스코프 2의 공시 기한이 2026년 8월 10일로 정해졌으며, 스코프 3 보고는 2027년부터 시작됩니다. S&P 500 구성 기업의 SBTi 목표 달성률은 2025년 말 기준 39%에 달했으나, 이는 유럽의 주요 벤치마크보다 낮은 수치로, 해당 지역에는 단순한 업그레이드 수요에 그치지 않고 새로운 도입을 위한 여지가 여전히 많이 남아 있음을 시사합니다. 아시아태평양은 2031년까지 연평균 성장률(CAGR) 22.67%를 나타낼 것으로 예측되며, AI 탄소 발자국 관리 소프트웨어 시장에서 가장 빠르게 성장하는 지역이 될 전망입니다. 2025년에 중국의 SBTi 인증 획득 기업이 92% 증가한 것은 공급망에 강력한 파급 효과를 시사합니다. 한편, 일본 시장은 'ASUENE IMPACT' 등의 제품 출시와 국내 주요 기술 기업들의 보다 상세한 탄소 회계 기준에 힘입고 있습니다.
남미는 여전히 도입 초기 단계에 있는 시장이지만, 보고 요건 및 수출과 관련된 공급망 측의 요구가 지속적으로 확대되고 있어 그 동향은 긍정적이었습니다. 2025년 남미 지역의 SBTi 목표 채택률은 42% 증가했으며, 멕시코에서는 검증 완료 기업 수가 58% 증가했습니다. 이는 국경을 초월한 밸류체인이 이미 해당 지역의 소프트웨어 수요에 영향을 미치고 있음을 보여줍니다. 중동 및 아프리카 역시 도입 초기 단계에 머물러 있으며, 아랍에미리트(UAE)와 사우디아라비아가 보다 광범위한 탄소중립 및 투자 주도형 전환 의제 하에서 주요 수요 거점으로 부상하고 있습니다. 두 지역 모두에서 단기적인 촉발 요인은 충분히 성숙한 국내 공시 제도라기보다는 유럽이나 북미의 구매자들이 공급망에 가하는 압력인 경우가 많으며, 이는 소프트웨어 수요가 여전히 세계 무역 관계 및 고객의 보고에 대한 기대와 밀접하게 연결되어 있을 가능성이 높음을 의미합니다.
기타 혜택 :
- 엑셀 형식 시장 예측(ME) 시트
- 3개월간의 애널리스트 지원
자주 묻는 질문
목차
제1장 서론
제2장 조사 방법
제3장 주요 요약
제4장 시장 구도
제5장 시장 규모 및 성장 예측
제6장 경쟁 구도
제7장 시장 기회 및 향후 전망
AJY 26.07.07According to Mordor Intelligence, the AI carbon footprint management software market size was valued at USD 1.82 billion in 2025 and is forecast to reach USD 5.56 billion by 2031 at a CAGR of 20.70% from 2026 to 2031.
This report is Segmented by Component (Software, and Services), Deployment Mode (Cloud-Based, On-Premise, and Hybrid), Enterprise Size (Large Enterprises, and Small and Medium Enterprises), End-Use Industry (IT and Telecom, BFSI, Industrial Manufacturing, Energy and Utilities, Retail and E-Commerce, and More), and Geography. The Market Forecasts are Provided in Terms of Value (USD).
Global AI Carbon Footprint Management Software Market Trends and Insights
Rising Regulatory Pressure For Scope 1, Scope 2, and Scope 3 Disclosure
Mandatory disclosure rules now cover a larger share of the corporate reporting base than in earlier phases of emissions reporting, providing direct growth support for the AI carbon footprint management software market. The EU Corporate Sustainability Reporting Directive required the first wave of companies, around 500 large public-interest entities with more than 500 employees, to publish ESRS-compliant sustainability statements in 2025 for fiscal 2024 data. California's Climate Corporate Data Accountability Act requires Scope 1 and Scope 2 reporting from August 10, 2026, for entities with more than USD 1 billion in annual revenue that do business in the state, and Scope 3 reporting begins in 2027. The practical change in this cycle is that disclosure is increasingly tied to traceability and external review rather than broad estimation, which raises the value of systems that preserve source records, workflow controls, and reporting consistency. That shift makes software adoption less discretionary because companies now need outputs that can withstand regulatory scrutiny and assurance processes, not just internal sustainability reviews.
Corporate Net-Zero Commitments and Science Based Targets Adoption
Corporate decarbonization commitments deepened further in 2025, reinforcing structural demand in the AI carbon footprint management software market. The Science Based Targets initiative reported 9,764 companies with validated near-term targets by the end of 2025, up 40% from 2024, while validated net-zero targets rose 61% to 2,325 companies. The same tracker showed that the total number of companies with validated targets or active commitments reached 12,353, suggesting a much larger future reporting and monitoring base than current deployments alone indicate. Asia posted the fastest growth in validated companies, and China recorded 92% growth in validated targets, widening the addressable demand pool in markets previously viewed as less mature for carbon software procurement. SBTi's proposed revision of the Corporate Net-Zero Standard also points toward stricter Scope 3 coverage, encouraging companies to invest earlier in primary data capture and higher-fidelity inventory systems rather than relying on broad averages that may no longer be acceptable.
High Data Quality Gaps Across Scope 3 Supply Chains
Scope 3 remains the most difficult part of a corporate inventory because the underlying data often sits outside direct operational control and flows through large supplier networks with varying reporting maturity. Normative launched Carbon Inventory Managed Services in February 2026 to address what it described as the last-mile problem, and its GHG Protocol-certified advisors logged more than 1,000 client-support hours in the first 6 weeks of 2026 alone. EcoVadis expanded its Carbon Data Network in April 2026 by adding Carbmee, whose Environmental Intelligence System identifies emissions hotspots at the SKU level and links decarbonization actions to financial return metrics, demonstrating the level of granularity buyers now need to improve supplier-level reporting. Even with better platform tools, supplier data collection remains labor-intensive and methodologically uneven, which slows the path from software purchase to full compliance. This restraint matters most in multi-tier supply chains because software can centralize data but cannot immediately address weak primary inputs from every supplier node.
Other drivers and restraints analyzed in the detailed report include:
- AI-Powered Automation Reducing Manual Carbon Data Workflows
- Enterprise Demand for Audit-Ready Sustainability Reporting
- High Implementation and Integration Costs For Mid-Market Buyers
For complete list of drivers and restraints, kindly check the Table Of Contents.
Segment Analysis
Software accounted for 70.34% of the AI carbon footprint management software market in 2025, indicating that buyers still prefer scalable platforms that centralize Scope 1, 2, and 3 data in a single operating environment. That preference is strongest in larger deployments where companies need multi-entity workflows, standardized methodologies, and consistent reporting structures across business units and jurisdictions. Workiva expanded its platform in May 2026 with CDP 2026 questionnaire support and AI-powered, simplified ESRS intelligence, reflecting how vendors are adding compliance-specific functionality directly into product layers rather than treating it as separate advisory work. SAP's Green Ledger moved in the same direction by bringing transaction-level carbon accounting into S/4HANA Cloud, which supports the broader shift toward carbon-financial integration within systems that finance teams already trust. As carbon data becomes more closely tied to financial reporting, internal controls, and enterprise workflows, software retains its dominant role because it offers repeatability and central governance at scale.
Services are the fastest-growing component, with the AI carbon footprint management software market projected to expand at a 21.45% CAGR for this segment from 2026 to 2031. That growth reflects a clear execution gap between what the platform can automate and what organizations still need people to do, especially when supplier data must be collected, cleaned, and validated. Normative's managed service launch in 2026 showed that buyers continue to pay for hands-on inventory support even when they already have access to software functionality. The service layer is also gaining importance because assurance-ready reporting demands method consistency, evidence handling, and process discipline that many organizations still lack internally. Over time, the line between subscription revenue and delivery support is likely to remain blurred because vendors that can combine software with execution support are better positioned to convert demand into successful reporting outcomes.
Cloud-based deployment held 67.12% of revenue in 2025, while hybrid deployment is set to record the fastest growth at a 22.08% CAGR through 2031. Cloud remained the largest model because it supports real-time APIs, makes supplier updates easier, and enables faster integration with reporting workflows that depend on continuous data refresh. It also aligns with the operating preferences of enterprises that want centralized visibility across sites, functions, and external partners without building new infrastructure at every location. At the same time, the hybrid model is gaining traction because some buyers want advanced analytics and reporting flexibility without moving all raw operational data off-premise. That pattern is especially relevant in regulated settings where sensitive plant, workforce, or process data must stay under tighter internal control even as reporting teams need cloud-scale modeling tools.
Microsoft's 2025 Wave 2 release for Dynamics 365 Business Central, which became generally available in January 2026, added Scope 3 value chain process automation into ERP purchasing workflows, demonstrating how deployment choices are increasingly shaped by the systems companies already use. On-premise deployment still matters in sectors such as oil and gas, defense, and parts of the public sector where emissions data overlaps with commercially sensitive or classified operating information. In that environment, hybrid architecture is less a temporary compromise and more a long-term operating model that combines on-premise control with cloud-based intelligence. The AI carbon footprint management software market is therefore moving toward a layered deployment design, where the data source may remain internal, but analytics, benchmarking, and reporting functions continue to shift to flexible cloud environments.
Complete Report Scope:
- By Component
- Software
- Services
- By Deployment Mode
- Cloud-Based
- On-Premise
- Hybrid
- By Enterprise Size
- Large Enterprises
- Small and Medium Enterprises
- By End-Use Industry
- IT and Telecom
- BFSI
- Industrial Manufacturing
- Energy and Utilities
- Oil and Gas
- Retail and E-Commerce
- Food and Beverage Manufacturing
- Construction and Infrastructure
- Government and Public Sector
- Other End-User Industries
- By Geography
- North America
- United States
- Canada
- Mexico
- South America
- Brazil
- Argentina
- Rest of South America
- Europe
- Germany
- United Kingdom
- France
- Italy
- Spain
- Russia
- Rest of Europe
- Asia-Pacific
- China
- India
- Japan
- South Korea
- Australia
- Rest of Asia-Pacific
- Middle East and Africa
- Middle East
- Saudi Arabia
- United Arab Emirates
- Turkey
- Rest of Middle East
- Africa
- South Africa
- Egypt
- Rest of Africa
- Middle East
- North America
Geography Analysis
Europe held 34.56% of the AI carbon footprint management software market share in 2025, maintaining its lead. That position rests on the phased rollout of the CSRD and the broader maturity of corporate climate commitments across large European companies. The Science Based Targets initiative showed that CAC 40 and DAX 40 companies reached target penetration rates of 70% and 68% by the end of 2025, pointing to a deep installed base for ongoing software use, renewals, and upgrades. That mix of regulation and target validation means demand in Europe is not limited to first-time compliance deployments, because many buyers also need better controls, broader Scope 3 coverage, and stronger audit support. The region, therefore, remains the clearest example of how regulatory depth and corporate commitment can reinforce each other inside the AI carbon footprint management software market.
North America moved closer to a stronger adoption phase as regulatory deadlines approached. California's SB 253 created an August 10, 2026, deadline for Scope 1 and Scope 2 disclosure from large entities doing business in the state, with Scope 3 reporting beginning in 2027. The S&P 500 reached 39% SBTi target penetration by the end of 2025, which was below leading European benchmarks and suggests that the region still has meaningful room for new deployments rather than only upgrade demand. Asia-Pacific is projected to expand at a 22.67% CAGR through 2031, making it the fastest-growing geography in the AI carbon footprint management software market. China's 92% increase in SBTi-validated companies in 2025 points to a strong supply-chain spillover effect, while Japan's market is being supported by product launches such as ASUENE IMPACT and by more detailed carbon accounting standards from domestic technology leaders.
South America remained an earlier-stage market, but the direction of travel was positive because reporting expectations and export-linked supply chain requests continued to spread. SBTi target adoption in South America grew 42% in 2025, and Mexico posted a 58% increase in validated companies, showing that cross-border value chains are already influencing software demand in the region. The Middle East and Africa also remained at an earlier stage of adoption, with the UAE and Saudi Arabia as the main demand centers under broader net-zero and investment-led transition agendas. In both regions, the near-term trigger is often supply-chain pressure from European and North American buyers rather than a fully mature domestic disclosure regime, which means software demand is likely to remain closely linked to global trade relationships and customer reporting expectations.
- Persefoni AI, Inc.
- Watershed, Inc.
- Normative Group AB
- Greenly SAS
- Sweep SAS
- Plan A Technologies GmbH
- SINAI Technologies, Inc.
- Green Project Technologies (ACT Group)
- CarbonChain Limited
- CarbonCloud AB
- 51 To Carbon Zero Limited
- Cority Software Inc.
- Benchmark Gensuite LLC
- FigBytes Inc.
- Diligent Corporation
- Workiva Inc.
- Enablon B.V.
- Intelex Technologies ULC
- EcoVadis SAS
- IBM Corporation
- SAP SE
- Salesforce, Inc.
- Microsoft Corporation
- Schneider Electric SE
Additional Benefits:
- The market estimate (ME) sheet in Excel format
- 3 months of analyst support
TABLE OF CONTENTS
1 INTRODUCTION
- 1.1 Study Assumptions and Market Definition
- 1.2 Scope of the Study
2 RESEARCH METHODOLOGY
3 EXECUTIVE SUMMARY
4 MARKET LANDSCAPE
- 4.1 Market Overview
- 4.2 Market Drivers
- 4.2.1 Rising Regulatory Pressure for Scope 1, Scope 2, and Scope 3 Disclosure
- 4.2.2 Corporate Net-Zero Commitments and Science Based Targets Adoption
- 4.2.3 AI-Powered Automation Reducing Manual Carbon Data Workflows
- 4.2.4 Enterprise Demand for Audit-Ready Sustainability Reporting
- 4.2.5 Supplier-Level Carbon Visibility Requirements in Complex Value Chains
- 4.2.6 Integration of Carbon Data With ERP, EHS, and Financial Reporting Systems
- 4.3 Market Restraints
- 4.3.1 High Data Quality Gaps Across Scope 3 Supply Chains
- 4.3.2 High Implementation and Integration Costs for Mid-Market Buyers
- 4.3.3 Limited Internal Carbon Accounting Expertise in Emerging Enterprises
- 4.3.4 Cybersecurity and Data Privacy Concerns in Cloud-Based Carbon Platforms
- 4.4 Industry Value-Chain Analysis
- 4.5 Regulatory Landscape
- 4.6 Impact of Macroeconomic Factors on the Market
- 4.7 Technological Outlook
- 4.8 Porter's Five Forces Analysis
- 4.8.1 Bargaining Power of Suppliers
- 4.8.2 Bargaining Power of Buyers
- 4.8.3 Threat of New Entrants
- 4.8.4 Threat of Substitutes
- 4.8.5 Intensity of Competitive Rivalry
5 MARKET SIZE AND GROWTH FORECASTS (VALUE)
- 5.1 By Component
- 5.1.1 Software
- 5.1.2 Services
- 5.2 By Deployment Mode
- 5.2.1 Cloud-Based
- 5.2.2 On-Premise
- 5.2.3 Hybrid
- 5.3 By Enterprise Size
- 5.3.1 Large Enterprises
- 5.3.2 Small and Medium Enterprises
- 5.4 By End-Use Industry
- 5.4.1 IT and Telecom
- 5.4.2 BFSI
- 5.4.3 Industrial Manufacturing
- 5.4.4 Energy and Utilities
- 5.4.5 Oil and Gas
- 5.4.6 Retail and E-Commerce
- 5.4.7 Food and Beverage Manufacturing
- 5.4.8 Construction and Infrastructure
- 5.4.9 Government and Public Sector
- 5.4.10 Other End-User Industries
- 5.5 By Geography
- 5.5.1 North America
- 5.5.1.1 United States
- 5.5.1.2 Canada
- 5.5.1.3 Mexico
- 5.5.2 South America
- 5.5.2.1 Brazil
- 5.5.2.2 Argentina
- 5.5.2.3 Rest of South America
- 5.5.3 Europe
- 5.5.3.1 Germany
- 5.5.3.2 United Kingdom
- 5.5.3.3 France
- 5.5.3.4 Italy
- 5.5.3.5 Spain
- 5.5.3.6 Russia
- 5.5.3.7 Rest of Europe
- 5.5.4 Asia-Pacific
- 5.5.4.1 China
- 5.5.4.2 India
- 5.5.4.3 Japan
- 5.5.4.4 South Korea
- 5.5.4.5 Australia
- 5.5.4.6 Rest of Asia-Pacific
- 5.5.5 Middle East and Africa
- 5.5.5.1 Middle East
- 5.5.5.1.1 Saudi Arabia
- 5.5.5.1.2 United Arab Emirates
- 5.5.5.1.3 Turkey
- 5.5.5.1.4 Rest of Middle East
- 5.5.5.2 Africa
- 5.5.5.2.1 South Africa
- 5.5.5.2.2 Egypt
- 5.5.5.2.3 Rest of Africa
- 5.5.5.1 Middle East
- 5.5.1 North America
6 COMPETITIVE LANDSCAPE
- 6.1 Market Concentration
- 6.2 Strategic Moves
- 6.3 Market Share Analysis
- 6.4 Company Profiles (includes Global Level Overview, Market Level Overview, Core Segments, Financials as available, Strategic Information, Market Rank/Share, Products and Services, Recent Developments)
- 6.4.1 Persefoni AI, Inc.
- 6.4.2 Watershed, Inc.
- 6.4.3 Normative Group AB
- 6.4.4 Greenly SAS
- 6.4.5 Sweep SAS
- 6.4.6 Plan A Technologies GmbH
- 6.4.7 SINAI Technologies, Inc.
- 6.4.8 Green Project Technologies (ACT Group)
- 6.4.9 CarbonChain Limited
- 6.4.10 CarbonCloud AB
- 6.4.11 51 To Carbon Zero Limited
- 6.4.12 Cority Software Inc.
- 6.4.13 Benchmark Gensuite LLC
- 6.4.14 FigBytes Inc.
- 6.4.15 Diligent Corporation
- 6.4.16 Workiva Inc.
- 6.4.17 Enablon B.V.
- 6.4.18 Intelex Technologies ULC
- 6.4.19 EcoVadis SAS
- 6.4.20 IBM Corporation
- 6.4.21 SAP SE
- 6.4.22 Salesforce, Inc.
- 6.4.23 Microsoft Corporation
- 6.4.24 Schneider Electric SE
7 MARKET OPPORTUNITIES AND FUTURE OUTLOOK
- 7.1 White-Space and Unmet-Need Assessment


