

|
시장보고서
상품코드
2073098
제품 탄소발자국(PCF) 소프트웨어 시장 : 점유율 분석, 업계 동향과 통계, 성장 예측(2026-2031년)Product Carbon Footprint (PCF) Software - Market Share Analysis, Industry Trends & Statistics, Growth Forecasts (2026 - 2031) |
||||||
 Mordor Intelligence
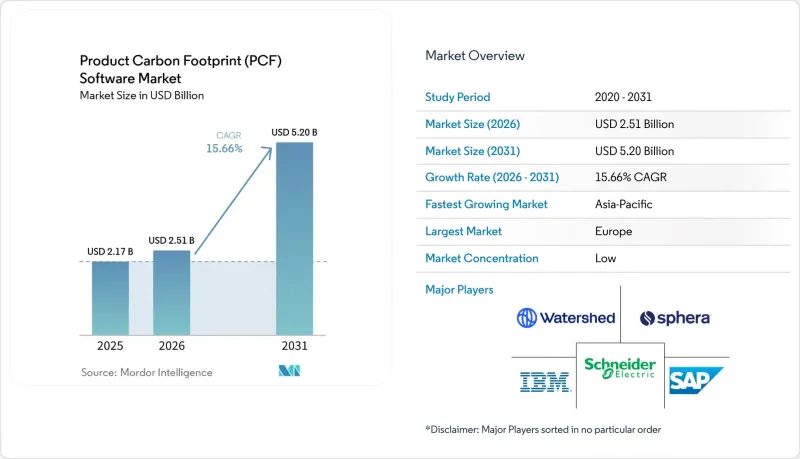
Mordor Intelligence에 의하면, 제품 탄소발자국(PCF) 소프트웨어 시장 규모는 2025년 21억 7,000만 달러, 2026년 25억 1,000만 달러에서 2031년까지 52억 달러로 확대한다고 예측되고 있어 2026-2031년까지 연평균 복합 성장률(CAGR)은 15.66%를 나타낼 전망입니다.
본 보고서는 기능별(제품 탄소발자국 산출, 데이터 수집 및 공급업체와의 연계, 기타), 도입 형태별(클라우드 기반 및 On-Premise형), 조직 규모별(대기업 및 중소기업), 산업별(에너지 및 유틸리티, 식음료, 기타), 지역별로 분류되어 있습니다. 시장 전망치는 금액(달러)으로 표시되어 있습니다.
전 세계 제품 탄소발자국(PCF) 소프트웨어 시장 동향 및 인사이트
규제에 따른 공시 의무 강화가 제품 단위의 탄소발자국 보고를 촉진
제품 탄소발자국(PCF) 소프트웨어 시장에서 수요를 가장 강력하게 견인하는 요인은 내장된 배출량 데이터를 일상적인 규정 준수 절차의 일부로 포함하도록 의무화하는 규제입니다. EU의 탄소국경조정메커니즘(CBAM)이 2026년 1월부터 확정 단계에 접어들면서, 대상 부문의 수입업체들에게는 제품 단위의 배출량 보고가 부정확할 경우 발생하는 비용이 증가하고 있습니다. 2026년 2월에 공표된 개정판 CSRD 옴니버스법에 따라 보고 대상은 더 대규모의 사업체로 한정되었지만, 그와 동시에 여러 계층에 걸친 공급업체에 대한 탄소 데이터 요청을 공식화할 수 있는 규모의 기업에 지출이 집중되게 되었습니다. 제품 탄소발자국 소프트웨어 시장에서 이러한 변화가 중요한 이유는 규제 대상인 대규모 구매자들이 여전히 대응을 요구받는 훨씬 소규모공급업체들에 대해 데이터 기준을 설정하는 경우가 많기 때문입니다. 그 결과, 공급망의 한쪽 끝에서는 규정 준수 요건이, 다른 쪽 끝에서는 상업적 요건이 되는 서로를 강화하는 선순환이 형성되고 있습니다. 따라서 규제상의 압력은 도입 규모뿐만 아니라, 구매자가 현재 필수적이라고 간주하는 플랫폼 기능 유형, 특히 감사 추적 기록, 추적 가능한 계산, 구조화된 공시 워크플로우에도 영향을 미치고 있습니다.
스코프 3 공급업체 데이터 요건이 PCF 소프트웨어의 활용 사례를 확대
스코프 3 데이터에 대한 수요로 인해, 제품 탄소발자국(PCF) 소프트웨어 시장의 역할은 사내 탄소발자국 산정에 그치지 않고 공급업체와의 협력으로 확대되고 있습니다. 공시, 조달, 고객 보고를 위해 제품 수준의 상세 정보가 필요한 경우, 지출 기준 평균치만으로는 불충분하기 때문에 1차 공급업체 데이터의 중요성이 더욱 커지고 있습니다. 2025년 4월에 출시된 Sphera의 “공급업체 PCF 계산 도구”는 50만 건 이상의 검증된 배출 계수로 구성된 관리 데이터베이스를 활용하고, Catena-X, PACT, ISO의 방법론을 준수함으로써 이 과제를 해결했습니다. 또한, 대기업 고객들이 전담 지속가능성 팀을 갖추지 않은 공급업체에 대해서도 감사 가능한 데이터를 점점 더 요구하고 있기 때문에 제품 탄소발자국(PCF) 소프트웨어 시장은 중소규모 공급업체에서도 도입이 확대되고 있습니다. 영국 비즈니스 은행은 2025년 보고서에서 탄소발자국 측정 활동이 소규모 기업보다 중견 기업에서 더 활발한 반면, 공급망 전체에 걸친 데이터 수집은 여전히 제한적이라고 지적했습니다. 이러한 격차로 인해 각 벤더사는 데이터 품질에 대한 기대치를 저해하지 않으면서도 참여 범위를 확대할 수 있도록, 보다 간소화된 온보딩 절차, 다국어를 지원하는 공급업체 포털, 이용 장벽이 낮은 가격 모델로의 전환을 추진해야 하는 상황에 놓여 있습니다.
배출 계수 및 조사 방법의 세분화가 데이터의 비교 가능성을 저해하고 있습니다.
데이터베이스 및 기법의 세분화는 제품 탄소발자국(PCF) 소프트웨어 시장에 여전히 뚜렷한 걸림돌로 작용하고 있습니다. 기업들은 여전히 ecoinvent, GaBi, 자체 관리 라이브러리, 공급업체별 데이터 세트 등을 넘나들며 업무를 수행하고 있어, 구매자들이 기대하는 만큼 제품을 쉽게 나란히 비교하기가 어려워지고 있습니다. 2025년 『Applied Sciences』지에 게재된 연구에 따르면, 데이터 통합의 복잡성과 기술적 호환성이 탄소 관리 시스템 도입의 주요 장애물로 지적되었습니다. 또한 Normative는 2026년에 CSRD 및 SBTi와 관련된 스코프 3 보고에 대한 압박으로 인해, 보고 수준별로 공급업체 정보의 불균일성이 남아 있음에도 불구하고 기업들은 데이터 품질 향상을 요구받고 있다고 지적하고 있습니다. 제품 탄소발자국(PCF) 소프트웨어 시장에서 이는 공급업체들에게 두 가지 과제를 안겨주고 있습니다. 즉, 조사 방법의 엄밀성을 확보하는 동시에, 고객이 불완전하거나 일관성이 없는 업스트림 데이터를 효과적으로 활용할 수 있도록 지원해야 한다는 점입니다. 그 결과, 표준화 진전이 지연되고, 구매자들의 신중한 태도가 강화되면서, 플랫폼 결정이 최종 확정되기까지의 가치 입증 주기가 장기화되고 있습니다.
부문별 분석
2025년, 제품 탄소발자국 산정은 35.31%의 점유율을 차지하며, 제품 탄소발자국(PCF) 소프트웨어 시장에서 가장 큰 기능을 차지했습니다. 규제 당국이나 고객으로부터 증거를 요구받는 상황에서 기업은 추적 가능하고 설득력 있는 제품 수준의 산출이라는 핵심 요건을 타사에 맡길 수 없습니다. 따라서 다른 기능들이 주목을 받는 와중에도 계산 도구는 여전히 핵심적인 위치를 차지하고 있습니다. 그 이후의 모든 보고 단계는 원래의 실적 데이터의 품질에 좌우되므로, 이 기능의 중요성은 변함이 없습니다.
“보고 및 공시의 자동화”는 2031년까지 연평균 성장률(CAGR) 16.81%를 나타낼 것으로 예측되며, PCF 소프트웨어 시장에서 가장 두드러진 성장세를 보이는 기능입니다. Workiva는 2026년 5월 업데이트를 통해 Sustainability Explorer에 CDP 2026의 대기업 및 중소기업용 평가 기준을 추가했습니다. 이는 구매자들이 보다 체계적이고 재현 가능한 공시 워크플로로 전환하고 있음을 보여줍니다. 현재 이러한 압박은 데이터 수집의 범위를 넘어섰으며, 기업들은 이를 이사회 차원의 보고, 보증 요구 사항, 공식 제출 서류에 반영해야 합니다. 같은 이유로 데이터 수집과 공급업체와의 협력이 점점 더 중요해지고 있는 한편, 재무팀이 예산 및 투자 의사결정을 뒷받침하기 위해 탄소 배출량 데이터를 요구하는 사례가 늘어남에 따라 시나리오 분석, 탈탄소화 계획, 감사 추적, 검증 관리도 그 중요성이 커지고 있습니다.
2025년에는 클라우드 기반 도입이 매출의 62.12%를 차지하며, 제품 탄소발자국(PCF) 소프트웨어 시장에서 1위를 차지했습니다. 이 지위는 배출 계수의 지속적인 갱신, 거점을 초월한 공급업체 접근, AI를 활용한 처리와 같은 실무상의 요구 사항을 반영하고 있으며, 이러한 요소들은 순수한 On-Premise 환경에서는 관리하기 어렵습니다. 또한, 클라우드 아키텍처는 대규모 구매자들이 공급업체에 점점 더 많이 요구하게 된 표준화된 API 기반 데이터 교환에도 적합합니다. 이 부문의 강점은 도입 방식의 선택이 단순히 호스팅에 대한 선호도뿐만 아니라 운영상의 편의성과도 밀접한 관련이 있음을 보여줍니다.
또한, 클라우드 기반 도입은 2031년까지 연평균 성장률(CAGR) 17.84%라는 최고치를 기록할 것으로 예상되며, 이는 이 주요 부문이 제품 탄소발자국(PCF) 소프트웨어 시장에서 그 역할을 더욱 확대하고 있음을 보여줍니다. SAP는 2026년 초, 프랑크푸르트와 상파울루의 AWS 인프라에 “SAP Sustainability Footprint Management”를 확대하여, 클라우드 공급업체가 규정 준수 및 데이터 거주 요건을 충족하기 위해 인프라를 현지화하고 있는 실제 사례를 제시했습니다. On-Premise 방식의 도입은 엄격한 데이터 관리 규정이나 깊이 뿌리내린 레거시 ERP 환경을 갖춘 조직에게 여전히 중요한 선택지입니다. 이러한 환경 속에서도 기업들이 기밀 데이터의 로컬 관리를 요구하는 한편, 클라우드 기반 보고서 작성 및 협업 도구를 활용하는 경향이 강해지고 있어, 하이브리드 운영 모델이 점차 보편화되고 있습니다. 장기적으로는 이러한 추세가 제품 탄소발자국(PCF) 소프트웨어 산업을 ‘클라우드 우선’ 구조로 이끌어 갈 것으로 보입니다.
지역별 분석
2025년, 유럽은 매출 점유율 38.19%를 차지하며 제품 탄소발자국(PCF) 소프트웨어 시장에서 1위를 차지했습니다. 이 지역은 엄격한 규제와 성숙한 공급망 네트워크를 모두 갖추고 있어, 다른 대부분의 지역에 비해 소프트웨어 도입 기반이 더욱 탄탄합니다. EU의 탄소국경조정메커니즘(CBAM) 및 제품 탄소 규제의 광범위한 확대로 인해, 제품에 반영된 배출량 데이터는 제품 무역 및 조달과 관련된 의사결정에서 더욱 중요한 요소가 되고 있습니다. 2026년 2월 CSRD(기업 지속가능성 보고 지침)의 종합적인 개정에 따라 공식적인 보고 대상 범위는 축소되었지만, 여전히 수요는 최대 규모 기업들에 집중되어 있으며, 바로 이러한 기업들이 요건을 공급망 하류로 확산시키는 데 있어 가장 유리한 입장에 있습니다.
북미는 더욱 강력한 탄소 데이터 관리 및 공시 준비에 대한 기업 수요에 힘입어, 지역별 PCF 소프트웨어 시장에서 계속해서 2위의 규모를 유지했습니다. 이 지역은 투자자들의 압력, 국경을 넘는 공급업체에 대한 요구 사항, 제품 수준의 추적 가능성에 대한 관심 증가 등의 요인이 복합적으로 작용하여 혜택을 보고 있습니다. 각 벤더사들도 현지 운영 요구에 맞추어 체제를 구축하고 있으며, SAP가 유럽에서의 사업 확장에 더해 2026년에 브라질로 인프라를 확장한 것은 지역별 서비스 제공 범위가 북미 및 남미 전역에서의 경쟁적 입지를 결정하는 요소 중 하나로 자리 잡고 있음을 보여줍니다. 남미는 여전히 도입 초기 단계에 있으며, 예산과 도입 역량이 제한적이기 때문에 모듈형 클라우드 도입이 주류를 이루고 있습니다.
아시아태평양은 2031년까지 연평균 성장률(CAGR) 17.31%를 나타낼 것으로 예측되며, 제품 탄소발자국(PCF) 소프트웨어 시장에서 가장 빠르게 성장하는 지역이 될 것입니다. 2025년 3월에 도입된 중국의 PCF 인증 검사 규정에 따라, 표준 90일 주기와 2년의 유효 기간을 갖춘 공식적인 제품 수준 인증 체계가 구축되었습니다. 일본 경제산업성은 생애주기 평가 및 탄소발자국에 관한 시책 수립을 지속적으로 추진하고 있으며, 이를 통해 산업 부문 전반에 걸쳐 보다 일관성 있는 제품 수준의 배출량 산정이 촉진되고 있습니다. 또한, NTT를 비롯한 일본의 기술 기업들도 2026년 3월에 소프트웨어 제품용 ‘요람에서 무덤까지”의 PCF 산정 규칙을 공표했습니다. 이를 통해 지역 내 활동이 제조업에서 디지털 제품 부문으로 확대되고 있음이 드러났습니다. 아프리카와 중동은 여전히 초기 단계 시장이며, 도입은 광범위한 확산이라기보다는 주로 대규모 다국적 기업의 사업 활동이나 초기 단계의 공시 체계에 집중되어 있습니다.
기타 혜택
- 엑셀 형식 시장 예측(ME) 시트
- 3개월간의 애널리스트 지원
자주 묻는 질문
목차
제1장 서론
제2장 조사 방법
제3장 주요 요약
제4장 시장 구도
제5장 시장 규모와 성장 예측
제6장 경쟁 구도
제7장 시장 기회와 향후 전망
JHS 26.07.07According to Mordor Intelligence, the product carbon footprint (PCF) software market size is projected to expand from USD 2.17 billion in 2025 and USD 2.51 billion in 2026 to USD 5.20 billion by 2031, registering a CAGR of 15.66% between 2026 and 2031.
This report is Segmented by Function (Product Footprint Calculation, Data Collection and Supplier Collaboration, and More), Deployment (Cloud-Based, and On-Premises), Organization Size (Large Enterprises, and Small and Medium Enterprises), Industry Vertical (Energy and Utilities, Food and Beverages, and More), and Geography. The Market Forecasts are Provided in Terms of Value (USD).
Global Product Carbon Footprint (PCF) Software Market Trends and Insights
Regulatory Disclosure Mandates Intensify Product-Level Carbon Reporting
The product carbon footprint (PCF) software market is seeing its strongest demand push from rules requiring embedded emissions data to be part of day-to-day compliance. The EU Carbon Border Adjustment Mechanism entered its definitive phase in January 2026, raising the cost of inaccurate product-level emissions reporting for importers in covered sectors. The revised CSRD omnibus, published in February 2026, narrowed the reporting scope to larger entities, but it also concentrated spending among companies with the scale to formalize supplier carbon data requests across multiple tiers. In the product carbon footprint software market, that shift matters because large regulated buyers often set data standards for much smaller suppliers that still need to respond. The result is a reinforcing cycle in which a compliance requirement at one end of the chain becomes a commercial requirement at the other. Regulatory pressure is therefore shaping not only adoption volume, but also the type of platform features buyers now treat as essential, especially audit trails, traceable calculations, and structured disclosure workflows.
Scope 3 Supplier Data Requirements Expand PCF Software Use Cases
Scope 3 data demands are widening the role of the product carbon footprint (PCF) software market beyond internal footprinting and into supplier engagement. Primary supplier data is now more important because spend-based averages do not hold up well when companies need product-level detail for disclosure, procurement, and customer reporting. Sphera's Supplier PCF Calculator, launched in April 2025, addressed this issue by leveraging a managed database of more than 500,000 verified emission factors and aligning with Catena-X, PACT, and ISO methods. The product carbon footprint (PCF) software market is also attracting smaller suppliers to adopt, as large enterprise customers are increasingly requesting auditable data even when those suppliers lack dedicated sustainability teams. The British Business Bank reported in 2025 that carbon footprint measurement activity was stronger among medium-sized firms than micro-enterprises, but complete supply chain data collection remained limited. That gap is pushing vendors toward simpler onboarding, multilingual supplier portals, and lower-friction pricing models that can widen participation without reducing data quality expectations.
Fragmented Emission Factors and Methodologies Reduce Data Comparability
Fragmentation across databases and methods remains a clear brake on the software market for product carbon footprint (PCF) software. Companies still work across ecoinvent, GaBi, managed proprietary libraries, and supplier-specific datasets, which makes side-by-side product comparisons harder than buyers often expect. Research published in Applied Sciences in 2025 highlighted data integration complexity and technological compatibility as major barriers to the adoption of carbon management systems. Normative also noted in 2026 that CSRD and SBTi-related Scope 3 reporting pressures are pushing firms toward better data quality, even as supplier information remains uneven across reporting tiers. In the product carbon footprint (PCF) software market, this creates a two-part challenge where vendors must support methodological rigor while also helping customers work around incomplete or mismatched upstream data. The result is slower standardization, more buyer caution, and longer proof-of-value cycles before platform decisions are finalized.
Other drivers and restraints analyzed in the detailed report include:
- AI-Assisted Emission Factor Mapping Reduces Calculation Cycle Time
- Carbon Costs Move into Procurement and Product Design Decisions
- Deep ERP, PLM, and Supplier Network Integration Raises Deployment Complexity
For complete list of drivers and restraints, kindly check the Table Of Contents.
Segment Analysis
Product Footprint Calculation held a 35.31% share in 2025, making it the largest function in the product carbon footprint (PCF) software market. Companies cannot delegate the core requirement to produce traceable, defensible product-level calculations when regulations and customers demand evidence. That is why calculation tools remained central even as other functions gained momentum. The function stayed important because every later reporting layer depends on the quality of the original footprint data.
Reporting and Disclosure Automation is projected to grow at a 16.81% CAGR through 2031, which makes it the fastest-growing function in the PCF software market. Workiva's May 2026 update added CDP 2026 Corporate and SME scoring criteria to Sustainability Explorer, demonstrating how buyers are moving toward more structured, repeatable disclosure workflows. The pressure now extends beyond data collection, as companies also need to map it into board-level reporting, assurance requests, and formal submissions. Data Collection and Supplier Collaboration are rising for the same reason, while Scenario Analysis, Decarbonization Planning, Audit Trail, and Verification Management are gaining ground as finance teams increasingly seek carbon outputs to support budget and investment decisions.
Cloud-Based deployment accounted for 62.12% of revenue in 2025, giving it the lead in the product carbon footprint (PCF) software market. This position reflects the practical needs of constant emission factor updates, supplier access across locations, and AI-supported processing, which are harder to manage in purely local environments. Cloud architecture also fits better with standardized API-based exchanges that large buyers increasingly expect from suppliers. The strength of this segment shows that deployment choice is closely tied to operational usability, not just to hosting preference.
Cloud-Based deployment is also expected to record the highest CAGR of 17.84% through 2031, indicating the leading segment is further expanding its role in the product carbon footprint (PCF) software market. SAP expanded SAP Sustainability Footprint Management to AWS infrastructure in Frankfurt and Sao Paulo in early 2026, demonstrating how cloud vendors are localizing infrastructure to meet compliance and residency requirements. On-Premises deployment remains relevant for organizations with strict data control rules or deeply embedded legacy ERP environments. Even there, hybrid operating models are becoming more common, as companies seek local control over sensitive data while still using cloud-based reporting and collaboration tools. Over time, that still pulls the product carbon footprint (PCF) software industry toward a cloud-first structure.
Complete Report Scope:
- By Function
- Product Footprint Calculation
- Data Collection and Supplier Collaboration
- Reporting and Disclosure Automation
- Scenario Analysis and Decarbonization Planning
- Audit Trail and Verification Management
- Other Functions
- By Deployment
- Cloud-Based
- On-Premises
- By Organization Size
- Large Enterprises
- Small and Medium Enterprises
- By Industry Vertical
- Energy and Utilities
- Manufacturing
- Transportation and Logistics
- Food and Beverages
- Pharmaceuticals
- Retail and Consumer Goods
- Other Industry Verticals
- By Geography
- North America
- United States
- Canada
- Mexico
- South America
- Brazil
- Argentina
- Rest of South America
- Europe
- Germany
- United Kingdom
- France
- Italy
- Spain
- Russia
- Rest of Europe
- Asia-Pacific
- China
- India
- Japan
- South Korea
- Australia
- Rest of Asia-Pacific
- Middle East
- Saudi Arabia
- United Arab Emirates
- Turkey
- Rest of Middle East
- Africa
- South Africa
- Nigeria
- Rest of Africa
- North America
Geography Analysis
Europe held 38.19% revenue share in 2025, giving it the lead in the product carbon footprint (PCF) software market. The region combines dense regulation with mature supply chain networks, which gives software adoption a stronger structural base than in most other regions. The EU Carbon Border Adjustment Mechanism and the broader rise of product carbon regulation have made embedded emissions data more relevant to product trade and sourcing decisions. The CSRD omnibus revision in February 2026 narrowed the formal reporting population, but it still concentrated demand among the largest firms, which are best positioned to push requirements down the chain.
North America remained the second-largest regional PCF software market, driven by enterprise demand for stronger carbon data management and disclosure readiness. The region benefits from a mix of investor pressure, cross-border supplier requirements, and growing attention to product-level traceability. Vendors are also building for local operating needs, and SAP's 2026 infrastructure expansion into Brazil alongside its European footprint showed how regional service coverage is becoming part of competitive positioning across the Americas. South America remained earlier stage, and adoption there leaned more toward modular cloud deployment, where budgets and implementation capacity were tighter.
Asia-Pacific is projected to expand at a 17.31% CAGR through 2031, making it the fastest-growing geography in the product carbon footprint software market. China's trial PCF certification rules, launched in March 2025, created a formal product-level certification structure with a standard 90-day cycle and a 2-year validity period. Japan's Ministry of Economy, Trade, and Industry continues to shape lifecycle assessment and carbon footprint policy, which supports more consistent product-level emissions work across industrial sectors. NTT and other Japanese technology companies also published cradle-to-grave PCF calculation rules for software products in March 2026, which showed that regional development is broadening from manufacturing into digital product categories. Middle East and Africa remained early-stage markets, with adoption centered mainly in large multinational operations and early disclosure frameworks rather than broad-based deployment.
- SAP SE
- Microsoft Corporation
- IBM Corporation
- Salesforce, Inc.
- Sphera Solutions, Inc.
- Watershed Technology, Inc.
- Persefoni AI, Inc.
- Greenly SAS
- Plan A ESG GmbH
- Emitwise Ltd
- Normative AB
- Carbon Trust Holdings Limited
- Diligent Corporation
- Workiva Inc.
- ENGIE Impact
- Enablon North America Corporation
- Cority Software Inc.
- Siemens AG
- Schneider Electric SE
- Wolters Kluwer N.V.
- EcoAct SAS
Additional Benefits:
- The market estimate (ME) sheet in Excel format
- 3 months of analyst support
TABLE OF CONTENTS
1 INTRODUCTION
- 1.1 Study Assumptions and Market Definition
- 1.2 Scope of the Study
2 RESEARCH METHODOLOGY
3 EXECUTIVE SUMMARY
4 MARKET LANDSCAPE
- 4.1 Market Overview
- 4.2 Market Drivers
- 4.2.1 Regulatory Disclosure Mandates Intensify Product-Level Carbon Reporting
- 4.2.2 Scope 3 Supplier Data Requirements Expand PCF Software Use Cases
- 4.2.3 Carbon Costs Move Into Procurement and Product Design Decisions
- 4.2.4 AI-Assisted Emission Factor Mapping Reduces Calculation Cycle Time
- 4.2.5 Digital Product Passport Readiness Creates SKU-Level Traceability Demand
- 4.2.6 Sustainability Linked Financing Requires Auditable Product Carbon Data
- 4.3 Market Restraints
- 4.3.1 Fragmented Emission Factors and Methodologies Reduce Data Comparability
- 4.3.2 Deep ERP PLM and Supplier Network Integration Raises Deployment Complexity
- 4.3.3 Privacy Concerns Slow Supplier Disclosure Across Multi-Tier Value Chains
- 4.3.4 Skills Gaps Limit Effective Interpretation of Product Carbon Insights
- 4.4 Industry Value Chain Analysis
- 4.5 Regulatory Landscape
- 4.6 Technological Outlook
- 4.7 Porter's Five Forces Analysis
- 4.7.1 Threat of New Entrants
- 4.7.2 Bargaining Power of Suppliers
- 4.7.3 Bargaining Power of Buyers
- 4.7.4 Threat of Substitutes
- 4.7.5 Competitive Rivalry
- 4.8 Impact of Macroeconomic Factors on the Market
5 MARKET SIZE AND GROWTH FORECASTS (VALUE)
- 5.1 By Function
- 5.1.1 Product Footprint Calculation
- 5.1.2 Data Collection and Supplier Collaboration
- 5.1.3 Reporting and Disclosure Automation
- 5.1.4 Scenario Analysis and Decarbonization Planning
- 5.1.5 Audit Trail and Verification Management
- 5.1.6 Other Functions
- 5.2 By Deployment
- 5.2.1 Cloud-Based
- 5.2.2 On-Premises
- 5.3 By Organization Size
- 5.3.1 Large Enterprises
- 5.3.2 Small and Medium Enterprises
- 5.4 By Industry Vertical
- 5.4.1 Energy and Utilities
- 5.4.2 Manufacturing
- 5.4.3 Transportation and Logistics
- 5.4.4 Food and Beverages
- 5.4.5 Pharmaceuticals
- 5.4.6 Retail and Consumer Goods
- 5.4.7 Other Industry Verticals
- 5.5 By Geography
- 5.5.1 North America
- 5.5.1.1 United States
- 5.5.1.2 Canada
- 5.5.1.3 Mexico
- 5.5.2 South America
- 5.5.2.1 Brazil
- 5.5.2.2 Argentina
- 5.5.2.3 Rest of South America
- 5.5.3 Europe
- 5.5.3.1 Germany
- 5.5.3.2 United Kingdom
- 5.5.3.3 France
- 5.5.3.4 Italy
- 5.5.3.5 Spain
- 5.5.3.6 Russia
- 5.5.3.7 Rest of Europe
- 5.5.4 Asia-Pacific
- 5.5.4.1 China
- 5.5.4.2 India
- 5.5.4.3 Japan
- 5.5.4.4 South Korea
- 5.5.4.5 Australia
- 5.5.4.6 Rest of Asia-Pacific
- 5.5.5 Middle East
- 5.5.5.1 Saudi Arabia
- 5.5.5.2 United Arab Emirates
- 5.5.5.3 Turkey
- 5.5.5.4 Rest of Middle East
- 5.5.6 Africa
- 5.5.6.1 South Africa
- 5.5.6.2 Nigeria
- 5.5.6.3 Rest of Africa
- 5.5.1 North America
6 COMPETITIVE LANDSCAPE
- 6.1 Market Concentration
- 6.2 Strategic Moves
- 6.3 Market Share Analysis
- 6.4 Company Profiles (includes Global Level Overview, Market Level Overview, Core Segments, Financials as available, Strategic Information, Market Rank/Share, Products and Services, Recent Developments)
- 6.4.1 SAP SE
- 6.4.2 Microsoft Corporation
- 6.4.3 IBM Corporation
- 6.4.4 Salesforce, Inc.
- 6.4.5 Sphera Solutions, Inc.
- 6.4.6 Watershed Technology, Inc.
- 6.4.7 Persefoni AI, Inc.
- 6.4.8 Greenly SAS
- 6.4.9 Plan A ESG GmbH
- 6.4.10 Emitwise Ltd
- 6.4.11 Normative AB
- 6.4.12 Carbon Trust Holdings Limited
- 6.4.13 Diligent Corporation
- 6.4.14 Workiva Inc.
- 6.4.15 ENGIE Impact
- 6.4.16 Enablon North America Corporation
- 6.4.17 Cority Software Inc.
- 6.4.18 Siemens AG
- 6.4.19 Schneider Electric SE
- 6.4.20 Wolters Kluwer N.V.
- 6.4.21 EcoAct SAS
7 MARKET OPPORTUNITIES AND FUTURE OUTLOOK
- 7.1 White Space and Unmet Need Assessment


