

|
시장보고서
상품코드
2073067
네트워크 라우터 시장 : 점유율 분석, 업계 동향과 통계, 성장 예측(2026-2031년)Network Router - Market Share Analysis, Industry Trends & Statistics, Growth Forecasts (2026 - 2031) |
||||||
 Mordor Intelligence
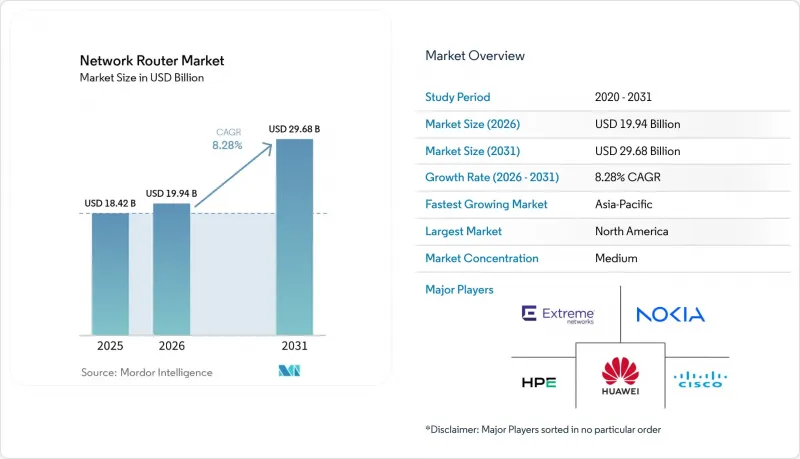
Mordor Intelligence에 의하면, 네트워크 라우터 시장 규모는 2025년 184억 2,000만 달러, 2026년 199억 4,000만 달러에서 2031년까지 296억 8,000만 달러로 확대되어 2026-2031년까지 CAGR 8.28%를 나타낼 것으로 예측됩니다.
본 보고서는 네트워크 계층(액세스 라우터, 어그리게이션 라우터, 코어 라우터, 기타), 성능 계층(저 처리량, 중 처리량, 기타), 기업 규모(대기업, 중소기업), 최종 사용자 산업(은행, 금융서비스 및 보험(BFSI), IT 및 통신, 제조, 정부·공공 부문, 헬스케어 및 생명과학, 기타), 지역별로 분류되어 있습니다. 시장 전망은 금액(달러) 기준으로 제시되어 있습니다.
세계 네트워크 라우터 시장 동향 및 분석
데이터센터의 IP 트래픽 증가
하이퍼스케일 및 코로케이션 시설은 페타바이트 규모의 기울기 업데이트를 교환하는 생성형 AI 클러스터를 지원하기 위해 규모를 확대하고 있으며, 이로 인해 서브 마이크로초 수준의 지연 시간으로 400 GbE 및 800 GbE 트래픽을 전송하는 라우터에 대한 수요가 증가하고 있습니다. 시스코는 2026년까지 전 세계 데이터센터의 IP 트래픽이 연간 20제타바이트를 넘어설 것으로 예측하고 있으며, 그 중 대부분을 AI 워크로드가 차지할 것으로 전망하고 있습니다. 따라서 통신 사업자들은 텔레메트리 엔진을 내장하고 무손실 혼잡 제어를 지원하는 프로그래머블 실리콘을 우선적으로 채택하고 있으며, 이를 통해 혼합 정밀도의 텐서에 대해 결정론적인 성능이 보장됩니다. 분산 추론을 통해 에지 노드가 중앙 집중형 파라미터 서버와 동기화되므로, 동서 방향 트래픽은 더욱 증가합니다. 이러한 추세에 대응하는 라우터 제조업체들은 재생 없이 80km를 커버하는 코히런트 광통신 기술을 통합하여 메트로 패브릭을 간소화하고 있습니다. 이러한 기능들이 종합적으로 작용하여, 네트워크 라우터 시장의 중심에 있는 고라딕스 섀시의 프리미엄 가격을 유지하고 있습니다.
대용량 라우터가 필요한 5G 백홀의 급속한 확산
5G 독립형 아키텍처로의 업그레이드를 추진하는 모바일 네트워크 사업자는 섹터당 10 Gbps를 초과하는 피크 값에 달하는 셀 사이트 트래픽을 집계해야 합니다. 차이나모바일은 2025년까지 5G 기지국 수를 400만 개를 돌파했고, MTN 그룹은 아프리카 17개국에서 5G 서비스를 구축하는 데 10억 달러를 투자하겠다고 밝혔습니다. 그 결과, 백홀 라우터에는 자율주행차의 텔레메트리, 산업 자동화, 강화형 모바일 광대역 용도로 대역폭을 분할하기 위한 부문 라우팅과 유연한 이더넷 인터페이스가 요구되고 있습니다. Open RAN의 상호운용성을 입증하지 못하는 공급업체는 정부 자금을 통한 주파수 할당에서 제외될 위험이 있습니다. 백홀 용량의 급증은 대용량 플랫폼에 대한 지속적인 수주로 이어지며, 신흥 지역의 네트워크 라우터 시장 규모 확대에 박차를 가하고 있습니다.
고성능 ASIC 분야공급망 변동
자동차, 모바일, AI 가속기가 최첨단 노드를 선점하기 위해 경쟁하고 있어 파운드리 생산 능력은 여전히 부족하며, 라우터용 ASIC의 리드타임은 40주 이상으로 늘어났고, 2025년 초에는 고대역폭 메모리 가격이 전년 대비 30% 이상 급등하고 있습니다. 각 벤더사는 여러 파운드리로 분산된 듀얼 소스 전략을 통해 리스크 헤지를 도모하고 있지만, 중견 공급업체들은 우선적인 할당량을 확보하는 데 어려움을 겪고 있어 매출 총이익률을 압박하고 있습니다. 포워딩, 텔레메트리, 암호화 엔진을 분리하는 치플릿 기반 설계는 패키징의 복잡성을 증가시키고, 추가적인 병목 현상을 야기하고 있습니다. 이러한 동향으로 인해 단기적인 출하량이 억제되면서, 본래라면 호조를 보였을 네트워크 라우터 시장 규모 전망에도 제동이 걸리고 있습니다.
부문별 분석
2025년, 엣지 라우터는 네트워크 라우터 시장 점유율의 36.48%를 차지하며, 엔터프라이즈 LAN과 캐리어 WAN 사이의 중요한 경계점으로서의 입지를 확고히 다졌습니다. 이 장치들은 방화벽, VPN, 용도 인식 라우팅 기능을 컴팩트한 폼 팩터에 통합하고 있어, 지사에서는 현장 엔지니어를 배치하지 않고도 도입할 수 있습니다. 클라우드 기반 컨트롤러는 제로 터치 설정을 자동화하여, 전담 네트워크 담당자가 없는 소매업체나 외딴 지역의 캠퍼스에 매력적인 솔루션입니다. 어그리게이션 라우터는 그보다 한 단계 업스트림에 위치하며, 로컬에서 패킷 집계가 필요한 엣지 컴퓨팅 워크로드에 힘입어 연평균 성장률(CAGR) 9.62%를 나타낼 것으로 전망됩니다. 부문 라우팅과 유연한 이더넷 인터페이스는 현재 표준으로 자리 잡았으며, 산업용 센서 및 자율주행차에 대한 결정론적 제어를 가능하게 함으로써 미드티어 플랫폼용 네트워크 라우터 시장 규모를 견인하고 있습니다.
코어 라우터는 순수한 처리량과 포트 밀도를 중시하며, 초당 수백 테라비트 규모의 하이퍼스케일 스파인의 기반이 되고 있습니다. 액세스 라우터는 규모는 작지만, 패시브 광 종단 장치와 LTE 링크를 통합하여 라스트 마일의 공백을 메우고 있습니다. 코히런트 플러그어블 기술 덕분에 라우터가 파장을 직접 변조할 수 있게 되었으며, 기존 계층 경계가 해소되어 메트로 네트워크용 독립형 트랜스폰더가 더 이상 필요하지 않게 되었습니다. 이 라우티드 옵티컬 방식은 5G 백홀 및 데이터센터 간 링크의 지연을 줄여주며, 네트워크 라우터 시장 전반에서 어그리게이션 및 엣지 플랫폼의 활용 사례를 확대되고 있습니다.
1-10Gbps의 중대역폭 시스템은 2025년에 매출 점유율의 38.92%를 차지하며, 지점 및 캠퍼스에서의 도입을 주도했습니다. 그러나 각 하이퍼스케일러 기업들은 100Gbps를 초과하는 라우터로의 업그레이드를 추진하고 있으며, 400GbE 및 800GbE 광모듈의 가격이 기가비트당 0.50달러 미만으로 떨어짐에 따라, 이 부문은 연평균 성장률(CAGR) 11.84%로 성장할 것으로 전망됩니다. 수천 대의 GPU 간에 기울기 업데이트를 주고받는 AI 훈련 네트워크는 저속 패브릭을 포화 상태로 만들며, 온칩 텔레메트리 및 무손실 혼잡 제어 기능을 갖춘 고라딕스 설계로의 전환을 불가피하게 만들고 있습니다. 이러한 기능과 80km가 넘는 전송 거리를 유지하는 코히런트 광 모듈을 결합함으로써, 네트워크 라우터 시장의 초고처리량 부문이 확대되고 있습니다.
10-100Gbps급 라우터는 중견 기업 및 지역 통신 사업자에게 비용과 성능의 균형을 최적화해 줍니다. 싱글 랙 유닛(SRU) 플랫폼은 과거에는 멀티 섀시 시스템에서만 구현할 수 있었던 총 대역폭을 제공할 수 있게 되어, 데이터센터의 설치 면적과 냉각 부하를 줄이고 있습니다. 1Gbps 이하의 저대역폭 라우터는 전력 예산이 제한된 IoT 게이트웨이나 소규모 사무실에서 여전히 사용되고 있습니다. 프로그래머블 네트워크 프로세서와 FPGA가 암호화 및 DPI 처리를 점점 더 오프로드함으로써 전송 계층의 속도를 유지하고 있습니다. 코히런트 DSP의 비용 절감으로 인해 대용량 인터페이스가 더욱 보급되면서, 고성능화로의 전환이 가속화되고 있습니다.
지역별 분석
북미는 전 세계에서 하이퍼스케일 데이터센터의 집중도가 가장 높고, 엔터프라이즈용 SD-WAN 도입이 확대되고 있는 것을 배경으로, 2025년 매출의 35.12%를 차지했습니다. 미국의 BEAD 프로그램은 통신 인프라가 부족한 카운티의 광섬유 설치에 자금을 지원하고 있으며, 이로 인해 집선 라우터에 대한 수요가 지방 교환국으로 이동하고 있습니다. 캐나다와 멕시코에서는 자동차 및 전자 산업 분야의 리쇼어링이 저지연 연결 수요를 견인함에 따라, 국경을 넘는 통신망 현대화가 진행되고 있습니다. 남미에서는 환율 변동과 수입 규제로 인해 가격에 대한 민감성이 나타나고 있지만, 브라질이 이 지역 내 도입을 주도하고 있으며, 주요 통신사들이 5G 독립형 코어 네트워크 구축을 추진하고 있습니다.
아시아태평양은 연평균 성장률(CAGR) 10.44%를 나타낼 것으로 예측되며, 네트워크 라우터 시장 내에서 가장 빠르게 성장하는 부문이 될 전망입니다. 중국은 2025년까지 5G 기지국 수가 400만 개를 돌파해, 5G-Advanced로의 전환을 추진하고 있어, 이것이 코어 및 어그리게이션 업그레이드를 주도하고 있습니다. 1조 3,000억 달러 규모의 인도 디지털 인프라 계획은 각 마을로 이어지는 대규모 광섬유 백홀을 뒷받침하고 있으며, 이를 위해 수만 대의 소형 집선 라우터가 필요합니다. 일본은 5G를 뛰어넘는 테라헤르츠 대역의 백홀에 투자하고 있으며, 멀티 기가비트급 무선 트래픽을 집약하는 라우터의 시험 도입이 진행되고 있습니다. 호주 및 뉴질랜드는 농촌 지역의 광대역 인프라 구축에 공동으로 자금을 지원하고 있는 반면, 인도네시아와 베트남은 데이터센터에 대한 외국인 직접 투자(FDI)를 유치하고 있으며, 이는 대규모 스파인-앤-리프형 라우터 수주로 이어지고 있습니다.
유럽에서는 2030년까지 기가비트 접속을 실현하겠다는 ‘디지털 디케이드”라는 지침에 따라, 대륙 전체의 시책과 각국의 사정 간의 균형을 맞추고 있습니다. 독일, 영국, 프랑스는 여전히 최대 구매국이며, 각국의 주요 인프라를 위해 “보안 중심 설계”의 라우터를 중시하고 있습니다. 제재 조치로 인해 러시아는 제약을 받고 있으며, 국내에서 반도체 대체품 개발이 촉진되고 있습니다. 중동에서는 석유 수입이 스마트 시티 프로젝트에 투자되고 있으며, 사우디아라비아와 아랍에미리트에서는 자율주행 및 모니터링 네트워크용 라우터가 지정되어 있습니다. 아프리카 내 수요는 남아프리카공화국과 나이지리아에 집중되어 있지만, 통화 변동과 전력 인프라 부족으로 인해 중동 및 아프리카의 다른 지역에서의 보급은 더딘 임베디드니다. 이에 대응하여 전 세계 공급업체들은 현지 조달 요건을 충족하고 운송 지연을 최소화하기 위해 지역 서비스 거점을 개설하고 있으며, 이러한 노력이 네트워크 라우터의 잠재 시장을 확대되고 있습니다.
기타 혜택
- 엑셀 형식 시장 예측(ME) 시트
- 3개월간의 애널리스트 지원
자주 묻는 질문
목차
제1장 서론
제2장 조사 방법
제3장 주요 요약
제4장 시장 구도
제5장 시장 규모와 성장 예측
제6장 경쟁 구도
제7장 시장 기회와 향후 전망
JHS 26.07.07According to Mordor Intelligence, the network router market size is projected to expand from USD 18.42 billion in 2025 and USD 19.94 billion in 2026 to USD 29.68 billion by 2031, registering a CAGR of 8.28% between 2026 and 2031.
This report is Segmented by Network Layer (Access Routers, Aggregation Routers, Core Routers, and More), Performance Tier (Low Throughput, Mid Throughput, and More), Enterprise Size (Large Enterprises, and SMEs), End User Industry (BFSI, IT and Telecom, Manufacturing, Government and Public Sector, Healthcare and Lifesciences, and More), and Geography. The Market Forecasts are Provided in Terms of Value (USD).
Global Network Router Market Trends and Insights
Growing IP Traffic Volume in Data Centers
Hyperscale and colocation facilities are scaling to support generative-AI clusters that exchange petabytes of gradient updates, driving demand for routers that forward 400 GbE and 800 GbE traffic with sub-microsecond latency. Cisco projects global data-center IP traffic will surpass 20 zettabytes annually by 2026, with AI workloads accounting for an outsized share. Operators therefore prioritize programmable silicon that embeds telemetry engines and supports lossless congestion control, ensuring deterministic performance for mixed-precision tensors. Distributed inference further increases east-west traffic as edge nodes synchronize with centralized parameter servers. Router vendors responding to this pattern are integrating coherent optics that span 80 km without regeneration, simplifying metro fabrics. These capabilities collectively sustain premium pricing for high-radix chassis at the core of the network router market.
Rapid 5 G Backhaul Deployment Requiring High-Capacity Routers
Mobile network operators upgrading to 5 G standalone architectures must aggregate cell-site traffic that now peaks above 10 Gbps per sector. China Mobile crossed 4 million 5 G base stations by 2025, while MTN Group committed USD 1 billion for 5 G across 17 African countries. Backhaul routers consequently need segment routing and flexible Ethernet interfaces to slice bandwidth for autonomous-vehicle telemetry, industrial automation, and enhanced mobile broadband. Vendors unable to demonstrate Open RAN interoperability risk exclusion from government-funded spectrum awards. The surge in backhaul capacity translates into sustained orders for high-capacity platforms, adding momentum to the network router market size growth in emerging regions.
Supply Chain Volatility for Advanced ASICs
Foundry capacity remains tight because automotive, mobile, and AI accelerators compete for leading-edge nodes, stretching router ASIC lead times beyond 40 weeks and inflating high-bandwidth-memory prices by over 30% year-over-year in early 2025. Vendors hedge through dual-source strategies across multiple foundries, yet mid-tier suppliers struggle to secure priority allocations, compressing gross margins. Chiplet-based designs that disaggregate forwarding, telemetry, and crypto engines add packaging complexity and expose additional choke points. These dynamics curtail near-term shipment volumes and temper the otherwise robust outlook for the network router market size.
Other drivers and restraints analyzed in the detailed report include:
- Enterprise Shift to SD-WAN Architectures
- Government Broadband Stimulus Programs
- Rising Cyber-Security Compliance Costs
For complete list of drivers and restraints, kindly check the Table Of Contents.
Segment Analysis
Edge routers accounted for 36.48% of the network router market share in 2025, confirming their role as the critical demarcation point between enterprise LANs and carrier WANs. These devices fold firewall, VPN, and application-aware routing into compact formats that branch offices can deploy without on-site engineers. Cloud-based controllers automate zero-touch setup, appealing to retailers and remote campuses that lack full-time networking staff. Aggregation routers sit one tier upstream and are projected to register a 9.62% CAGR, supported by edge-computing workloads that require localized packet consolidation. Segment routing and flexible Ethernet interfaces are now standard, enabling deterministic control for industrial sensors and autonomous vehicles and bolstering the network router market size for mid-tier platforms.
Core routers emphasize sheer throughput and port density, anchoring hyperscale spines at hundreds of terabits per second. Access routers, although more modest, are integrating passive-optical termination and LTE links to backfill last-mile gaps. Coherent pluggables now allow routers to modulate wavelengths directly, collapsing traditional layer boundaries and eliminating separate transponders for metro networks. This routed-optical approach reduces latency in 5 G backhaul and inter-data-center links, expanding use cases for aggregation and edge platforms across the network router market.
Mid-throughput systems ranging from 1 Gbps to 10 Gbps held 38.92% revenue share in 2025, dominating branch and campus installations. Hyperscalers, however, are upgrading to routers exceeding 100 Gbps, a tier forecast to grow at an 11.84% CAGR as 400 GbE and 800 GbE optics drop below USD 0.50 per gigabit. AI training networks that exchange gradient updates across thousands of GPUs saturate lower-speed fabrics, forcing a shift toward high-radix designs with on-chip telemetry and lossless congestion control. These capabilities, combined with coherent optics that maintain reach beyond 80 km, are expanding the ultra-high-throughput slice of the network router market.
Routers in the 10 Gbps to 100 Gbps bracket bridge cost and performance for mid-sized enterprises and regional carriers. Single-rack-unit platforms now deliver aggregate bandwidth once reserved for multi-chassis systems, shrinking data-center footprints and cooling loads. Low-throughput routers below 1 Gbps persist in IoT gateways and small offices where power budgets are tight. Programmable network processors and FPGAs are increasingly offloading encryption and DPI, preserving forwarding-plane speed. The declining cost of coherent DSPs further democratizes high-capacity interfaces, accelerating migration up the performance ladder.
Complete Report Scope:
- By Network Layer
- Access Routers
- Aggregation Routers
- Core Routers
- Edge Routers
- By Performance Tier
- Low Throughput (<1 Gbps)
- Mid Throughput (1-10 Gbps)
- High Throughput (10-100 Gbps)
- Ultra-High (>100 Gbps)
- By Enterprise Size
- Large Enterprises
- SMEs
- By End User Industry
- BFSI
- IT and Telecom
- Manufacturing
- Government and Public Sector
- Healthcare and Lifesciences
- Retail and E-commerce
- Education
- Other End User Industries
- By Geography
- North America
- United States
- Canada
- Mexico
- South America
- Brazil
- Argentina
- Rest of South America
- Europe
- Germany
- United Kingdom
- France
- Italy
- Spain
- Russia
- Rest of Europe
- Asia-Pacific
- China
- Japan
- India
- South Korea
- Australia and New Zealand
- Rest of Asia-Pacific
- Middle East
- Saudi Arabia
- United Arab Emirates
- Rest of Middle East
- Africa
- South Africa
- Nigeria
- Rest of Africa
- North America
Geography Analysis
North America retained 35.12% of 2025 revenue, anchored by the world's highest concentration of hyperscale data centers and enterprise SD-WAN adoption. The United States BEAD program is funding fiber builds in underserved counties, pulling demand for aggregation routers into rural exchanges. Canada and Mexico are modernizing cross-border corridors as reshoring in automotive and electronics drives demand for low-latency connectivity. Currency swings and import rules in South America create price sensitivity, yet Brazil leads regional deployments, where major carriers roll out 5G standalone cores.
Asia-Pacific is expected to post a 10.44% CAGR, making it the fastest-growing slice of the network router market. China surpassed 4 million 5G base stations by 2025 and is transitioning to 5G-Advanced, which drives core and aggregation upgrades. India's USD 1.3 trillion digital infrastructure plan underpins mass fiber backhaul to villages, requiring tens of thousands of compact aggregation routers. Japan invests in beyond-5 G terahertz backhaul, prompting trials of routers that aggregate multi-gigabit wireless flows. Australia and New Zealand co-fund rural broadband, while Indonesia and Vietnam attract data-center FDI that triggers large spine-and-leaf orders.
Europe balances continent-wide policy with national preferences under the Digital Decade mandate for gigabit access by 2030. Germany, the United Kingdom, and France remain the largest buyers, each emphasizing secure-by-design routers for critical infrastructure. Sanctions constrain Russia, encouraging domestic silicon substitutes. The Middle East funnels oil revenue into smart-city projects, with Saudi Arabia and the United Arab Emirates specifying routers for autonomous transport and surveillance grids. Africa's volume is concentrated in South Africa and Nigeria, but currency volatility and limited power infrastructure slow adoption elsewhere. Global suppliers respond by opening regional service hubs to satisfy local-content clauses and minimize shipping delays, actions that expand their addressable network router market.
- Cisco Systems, Inc.
- Huawei Technologies Co., Ltd.
- Nokia Corporation
- Hewlett Packard Enterprise Company
- Extreme Networks, Inc.
- Arista Networks, Inc.
- TP-Link Technologies Co., Ltd.
- Netgear, Inc.
- D-Link Corporation
- Zyxel Communications Corporation
- Ubiquiti Inc.
- MikroTikls SIA
- Edgecore Networks Corporation
- Ruijie Networks Co., Ltd.
- Fortinet, Inc.
- Linksys Holdings, Inc.
- DrayTek Corp.
- Allied Telesis Holdings K.K.
- ADTRAN Holdings, Inc.
- Cambium Networks Corporation
- Peplink International Limited
- Dell Technologies Inc.
- Commscope Holding Company, Inc.
- Palo Alto Networks, Inc.
Additional Benefits:
- The market estimate (ME) sheet in Excel format
- 3 months of analyst support
TABLE OF CONTENTS
1 INTRODUCTION
- 1.1 Study Assumptions and Market Definition
- 1.2 Scope of the Study
2 RESEARCH METHODOLOGY
3 EXECUTIVE SUMMARY
4 MARKET LANDSCAPE
- 4.1 Market Overview
- 4.2 Market Drivers
- 4.2.1 Growing IP Traffic Volume in Data Centers
- 4.2.2 Rapid 5G Backhaul Deployment Requiring High-Capacity Routers
- 4.2.3 Enterprise Shift to SD-WAN Architectures
- 4.2.4 Government Broadband Stimulus Programs
- 4.2.5 Edge Computing Creating Demand for Compact Aggregation Routers
- 4.2.6 Open-Source NOS Adoption Reducing Vendor Lock-In
- 4.3 Market Restraints
- 4.3.1 Supply Chain Volatility for Advanced ASICs
- 4.3.2 Rising Cyber-security Compliance Costs
- 4.3.3 Talent Shortage in Network Automation Skill Sets
- 4.3.4 Geopolitical Export Controls on High-End Silicon
- 4.4 Industry Value / Supply-Chain Analysis
- 4.5 Regulatory Landscape
- 4.6 Technological Outlook
- 4.7 Impact of Macroeconomic Factors on the Market
- 4.8 Porter's Five Forces Analysis
- 4.8.1 Threat of New Entrants
- 4.8.2 Bargaining Power of Suppliers
- 4.8.3 Bargaining Power of Buyers
- 4.8.4 Threat of Substitutes
- 4.8.5 Intensity of Competitive Rivalry
5 MARKET SIZE AND GROWTH FORECASTS (VALUE)
- 5.1 By Network Layer
- 5.1.1 Access Routers
- 5.1.2 Aggregation Routers
- 5.1.3 Core Routers
- 5.1.4 Edge Routers
- 5.2 By Performance Tier
- 5.2.1 Low Throughput (<1 Gbps)
- 5.2.2 Mid Throughput (1-10 Gbps)
- 5.2.3 High Throughput (10-100 Gbps)
- 5.2.4 Ultra-High (>100 Gbps)
- 5.3 By Enterprise Size
- 5.3.1 Large Enterprises
- 5.3.2 SMEs
- 5.4 By End User Industry
- 5.4.1 BFSI
- 5.4.2 IT and Telecom
- 5.4.3 Manufacturing
- 5.4.4 Government and Public Sector
- 5.4.5 Healthcare and Lifesciences
- 5.4.6 Retail and E-commerce
- 5.4.7 Education
- 5.4.8 Other End User Industries
- 5.5 By Geography
- 5.5.1 North America
- 5.5.1.1 United States
- 5.5.1.2 Canada
- 5.5.1.3 Mexico
- 5.5.2 South America
- 5.5.2.1 Brazil
- 5.5.2.2 Argentina
- 5.5.2.3 Rest of South America
- 5.5.3 Europe
- 5.5.3.1 Germany
- 5.5.3.2 United Kingdom
- 5.5.3.3 France
- 5.5.3.4 Italy
- 5.5.3.5 Spain
- 5.5.3.6 Russia
- 5.5.3.7 Rest of Europe
- 5.5.4 Asia-Pacific
- 5.5.4.1 China
- 5.5.4.2 Japan
- 5.5.4.3 India
- 5.5.4.4 South Korea
- 5.5.4.5 Australia and New Zealand
- 5.5.4.6 Rest of Asia-Pacific
- 5.5.5 Middle East
- 5.5.5.1 Saudi Arabia
- 5.5.5.2 United Arab Emirates
- 5.5.5.3 Rest of Middle East
- 5.5.6 Africa
- 5.5.6.1 South Africa
- 5.5.6.2 Nigeria
- 5.5.6.3 Rest of Africa
- 5.5.1 North America
6 COMPETITIVE LANDSCAPE
- 6.1 Market Concentration
- 6.2 Strategic Moves
- 6.3 Market Share Analysis
- 6.4 Company Profiles (includes Global Level Overview, Market Level Overview, Core Segments, Financials as available, Strategic Information, Market Rank/Share, Products and Services, Recent Developments)
- 6.4.1 Cisco Systems, Inc.
- 6.4.2 Huawei Technologies Co., Ltd.
- 6.4.3 Nokia Corporation
- 6.4.4 Hewlett Packard Enterprise Company
- 6.4.5 Extreme Networks, Inc.
- 6.4.6 Arista Networks, Inc.
- 6.4.7 TP-Link Technologies Co., Ltd.
- 6.4.8 Netgear, Inc.
- 6.4.9 D-Link Corporation
- 6.4.10 Zyxel Communications Corporation
- 6.4.11 Ubiquiti Inc.
- 6.4.12 MikroTikls SIA
- 6.4.13 Edgecore Networks Corporation
- 6.4.14 Ruijie Networks Co., Ltd.
- 6.4.15 Fortinet, Inc.
- 6.4.16 Linksys Holdings, Inc.
- 6.4.17 DrayTek Corp.
- 6.4.18 Allied Telesis Holdings K.K.
- 6.4.19 ADTRAN Holdings, Inc.
- 6.4.20 Cambium Networks Corporation
- 6.4.21 Peplink International Limited
- 6.4.22 Dell Technologies Inc.
- 6.4.23 Commscope Holding Company, Inc.
- 6.4.24 Palo Alto Networks, Inc.
7 MARKET OPPORTUNITIES AND FUTURE OUTLOOK
- 7.1 White-Space and Unmet-Need Assessment


