
|
시장보고서
상품코드
2073214
인도네시아의 그린 IT 소프트웨어 시장 : 점유율 분석, 업계 동향과 통계, 성장 예측(2026-2031년)Indonesia Green IT Software - Market Share Analysis, Industry Trends & Statistics, Growth Forecasts (2026 - 2031) |
||||||
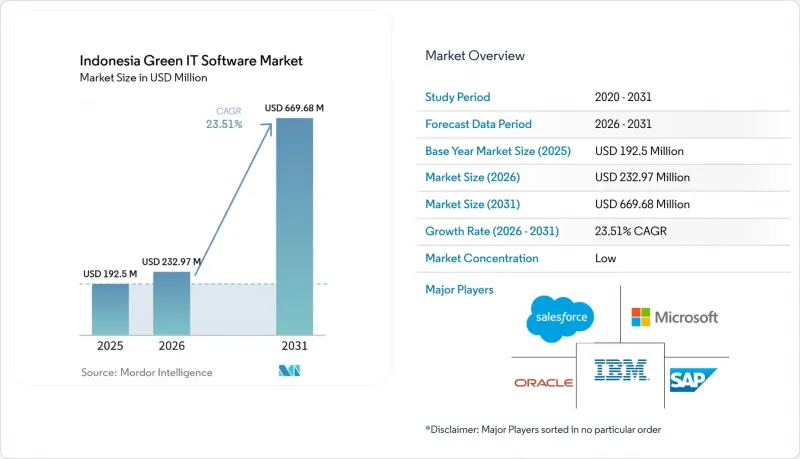
Mordor Intelligence에 의하면, 인도네시아 그린 IT 소프트웨어 시장 규모는 2025년 1억 9,250만 달러에서 2026년에는 2억 3,297만 달러로 확대되어 2031년까지 6억 6,968만 달러에 이를 것으로 예상되고 있어 2026년부터 2031년까지 CAGR 23.51%로 성장할 전망입니다.
본 보고서는 제공 형태(소프트웨어 및 서비스), 도입 형태(클라우드 기반, On-Premise형, 하이브리드형), 기업 규모(대기업 및 중소기업), 솔루션 유형(탄소 관리·산정 소프트웨어 등), 최종 사용자(정보기술·통신, 제조, 정부 기관 등)별로 분류되어 있습니다. 시장 전망은 금액(달러) 기준으로 제시되어 있습니다.
인도네시아 그린 IT 소프트웨어 시장 동향과 인사이트
인도네시아에서 기업의 탄소 정보 공시를 위한 규제 추진
인도네시아의 그린 IT 소프트웨어 시장은 공시 의무 기한이 명확한 기업 계획 주기 내에 포함되게 되면서 그 움직임이 가속화되고 있습니다. 이로 인해 기업이 비공식적인 보고 절차를 체계화된 디지털 시스템으로 전환하는 데 걸리는 기간이 단축되고 있습니다. 2026년 2월, OJK는 POJK 51/2017 개정과 관련된 협의를 시작했습니다. 한편, IAI는 2025년 7월에 이미 PSPK 1 및 PSPK 2를 채택하여 2025년 8월 11일에 공식적으로 발효시켰으며, 기업들에게 ISSB에 부합하는 공시 관행으로의 보다 명확한 전환 경로를 제공합니다. 2027년 1월부터 주요 증시 상장 기업, 대형 은행, 해외 은행 지점을 대상으로 단계적으로 도입됨에 따라, 특히 여전히 단편적인 기록이나 수작업에 의한 집계에 의존하고 있는 기업들에게 지속가능성 소프트웨어는 "임의의 경비 항목"에서 "기한이 정해진 규정 준수 대응 구매 품목"으로 변화하게 됩니다. 또한, 인도네시아 중앙은행(Bank Indonesia)은 TKBI 버전 3에서 정보통신을 지속가능 금융의 "핵심 부문"으로 분류하고 있음을 지적하고 있으며, 이를 통해 디지털 보고 도구가 녹색 예산 편성 논의 및 자금 조달 프레임워크에서 보다 명확한 위치를 차지하게 될 것입니다. 이는 조달 팀이 경영진, 재무 팀, 감사위원회에 소프트웨어 지출의 타당성을 설명할 때, 보고 기한과 분류 체계에 기반한 지침을 모두 제시할 수 있게 되었다는 점에서 중요합니다. 실제로, 인도네시아의 그린 IT 소프트웨어 시장은 감사 추적, 여러 사업체에 대한 통제, 시나리오 대응형 데이터 구조, 그리고 제출 시점뿐만 아니라 매년 유지 관리가 가능한 구조화된 공시 워크플로우를 갖춘 플랫폼을 평가하는 규제 주기의 혜택을 받고 있습니다.
스프레드시트 기반의 ESG 추적에서 감사 대응형 소프트웨어로의 기업 전환
스프레드시트 기반의 ESG 추적 방식에서 벗어나면서, 인도네시아의 그린 IT 소프트웨어 시장은 단순한 기본 보고를 위한 틈새 시장에서 데이터 소유권, 추적성, 승인 절차, 그리고 반복 가능한 공시 준비를 지원해야 하는 보다 광범위한 시스템 범주로 변화하고 있습니다. 스프레드시트 파일은 친숙하고 도입하기도 쉽지만, 버전 관리, 데이터 계보, 사업체 간 통합, 증빙 자료 보관, 그리고 누가, 무엇을, 언제 변경했는지에 대한 명확한 기록이 필요한 경우에는 그 약점이 드러납니다. 보장에 대한 기대가 높아짐에 따라, 배출량 정보는 재무, 운영, 조달, 시설, 공급업체 등 각 부문의 기록에 분산되어 있으며, 이러한 기록들은 단일 보고 방식 하에서 연계되도록 설계되지 않았기 때문에 이러한 수작업 단계는 지연이나 오류의 위험을 초래합니다. TruCarbon은 2026년 1월, 이러한 수요에 부응하기 위해 "TruCount"를 출시했습니다. 이 플랫폼은 IDX 상장 기업을 위해 구축되었으며, OJK 규정을 준수하는 보고 워크플로우와 2025 회계연도에 대한 사전 정의된 보고 기간 내에서 스코프 1, 스코프 2 및 15개의 스코프 3 범주를 지원합니다. GHG 프로토콜, ISO 14064 및 GRI 305 준수는 다중 표준 지원이 최첨단 사용자들에게만 제공되는 프리미엄 옵션이 아니라, 이제 기본적인 요건이 되었음을 보여줍니다. 이러한 변화로 인해, 원시 업무 데이터를 감사 대응이 가능한 출력 데이터로 변환할 수 있는 공급업체가 유리한 입장에 서게 되는 한편, 지속가능성 담당 팀이 공식 시스템 외부에서 병행하여 스프레드시트 파일을 관리해야 할 필요성도 줄어듭니다.
자회사 및 공급업체에 분산된 배출량 데이터
배출량 데이터의 파편화는 인도네시아 그린 IT 소프트웨어 시장에서 여전히 주요 도입 장벽으로 남아 있습니다. 이는 인도네시아의 대형 그룹 기업들이 대개 단일 보고 체계를 공유하지 않는 별도의 자회사, 공장, 유통 부문 및 공급업체 네트워크를 통해 사업을 전개하고 있기 때문입니다. 각 사업 단위는 서로 다른 ERP 설정, 승인 절차 또는 데이터 관리 기준을 채택하고 있을 가능성이 있어, 기업이 공급업체를 대상으로 한 Scope 3 데이터 수집을 시작하기도 전에 데이터 통합이 지연되고 있습니다. 이 문제는 기업이 전력 사용량, 연료 소비량, 조달 기록, 물류 활동 및 보충 문서를 경영진과 외부 심사위원 모두가 신뢰할 수 있는 단일하고 감사 가능한 보고 파일로 통합하려고 시도할 때 더욱 두드러지게 나타납니다. 2024년 제조업 조사에 따르면, 인도네시아 기업들은 데이터에 대한 인식 부족, 높은 수집 비용, 표준화에 대한 사내의 저항, 그리고 시스템 간 상호 운용성 부족에 직면해 있으며, 이것이 도입 초기 단계에서 도입에 당초 예상보다 더 오랜 시간이 걸리는 이유를 설명해 줍니다. 이러한 과제는 서비스에 대한 의존도를 높이고, 도입 부담을 가중시키며, 소프트웨어 공급업체로 하여금 부가가치가 높은 계획 수립이나 분석 기능보다는 데이터 매핑 및 검증에 많은 시간을 할애하도록 만들게 됩니다. 상호 운용성이 향상될 때까지는 데이터 가져오기, 예외 처리, 검증을 간소화하는 벤더가 소스 시스템이 이미 체계적으로 정리되어 있고, 일관성이 있으며, 일원적으로 관리되고 있다는 전제를 바탕으로 하는 도구에 비해 우위를 계속 유지할 것입니다.
부문별 분석
2025년, 소프트웨어는 시장의 66.18%를 차지하여 인도네시아 그린 IT 소프트웨어 시장 규모의 66.18%를 차지했습니다. 이는 지속가능성 데이터를 위해 구조화된 관리 계층이 필요한 규제 대상 기업들에게 플랫폼 라이선스가 가장 먼저 구매 대상이 되었기 때문입니다. 많은 구매자들은 탄소 회계 및 보고 모듈부터 도입을 시작했습니다. 이러한 도구들은 향후 서비스, 보증 준비 업무 및 관련 용도이 매년 동일한 데이터 세트를 재구성할 필요 없이 활용할 수 있는 기초 기록을 마련했기 때문입니다. 이러한 경향은 인도네시아 그린 IT 소프트웨어 시장의 현황과 일치합니다. 해당 시장에서는 산재한 사내 파일이 아닌, 정식 시스템 내에서 배출 정보를 수집, 분류, 저장 및 검색할 필요성이 여전히 조달을 주도하고 있기 때문입니다. 또한, 구매자가 소프트웨어를 선호하는 이유로는 연간 보고 주기, 내부 거버넌스 검토, 그리고 재현 가능한 기법을 요구하는 진화하는 공시 기준을 통해 지속적으로 활용할 수 있는 견고한 운영 기반을 구축할 수 있다는 점을 들 수 있습니다. 그 결과, 초기 도입 열기가 가라앉고 구현 작업이 더욱 복잡해지며 더 많은 팀이 동일한 플랫폼을 사용하기 시작했음에도 불구하고, 라이선스 중심의 거래가 여전히 예산의 주축을 이루고 있습니다.
서비스 시장은 2031년까지 연평균 성장률(CAGR) 25.06%로 확대될 것으로 전망됩니다. 이는 기업이 초기 구매 후, 전환 지원, 조직 체계 구축, 보증 준비, 교육, 워크플로우 설계 및 지속적인 시스템 개선이 필요하기 때문입니다. 초기에 플랫폼을 도입한 기업들은 지속가능성 보고가 데이터 관리, 승인 절차, 증빙 서류 및 검토 대응 준비에 달려 있다는 사실을 깨닫고 있습니다. 벤더나 파트너가 운영 프로세스 구축을 지원하지 않는 한, 소프트웨어만으로는 이를 실현할 수 없습니다. 따라서 인도네시아의 그린 IT 소프트웨어 시장에서 소프트웨어가 여전히 주요 수익원임에도 불구하고, 도입, 데이터 매핑, 증거 관리 및 공시 지원의 중요성이 상업적으로 커지고 있습니다. Workiva는 2025년 9월 플랫폼 확장 과정에서 IFRS S1 및 IFRS S2 보고 주기에 대비해야 하는 재무, 거버넌스, 리스크, 컴플라이언스, 지속가능성 각 팀을 대상으로 에이전트형 AI, 통합 데이터 자동화 및 지능형 지속가능성 도구를 추가했습니다. 이 제품의 방향성은 소프트웨어 및 서비스의 경계가 점차 모호해지고 있음을 보여주며, 벤더가 지원을 완전히 독립된 서비스로 취급하기보다는 가이드 기반 분석 및 워크플로우 지원을 플랫폼 자체에 통합하고 있다는 점에서 중요합니다.
2025년에는 클라우드 기반 솔루션의 도입이 시장의 57.23%를 차지했으며, 인도네시아 그린 IT 소프트웨어 시장 점유율에서도 57.23%를 차지했습니다. 이는 기업들이 신속한 사업 전개, 초기 인프라 투자 절감, 원격 접속의 용이성, 그리고 여러 사업체 간의 보다 효율적인 협력을 중시했기 때문입니다. 인도네시아의 여러 섬에서 사업을 전개하는 기업에게 있어, 클라우드를 통한 서비스 제공은 각기 다른 환경에서 운영되며 종종 서로 다른 내부 일정에 따라 보고를 수행하는 공장, 사무실, 지점, 창고, 공급업체로부터의 데이터를 일원적으로 수집하는 데에도 도움이 됩니다. 이 모델은 규칙을 정기적으로 업데이트하는 데에도 적합합니다. 이는 공급업체가 템플릿, 계산 로직, 계수 라이브러리, 보고서 필드를 조정할 수 있기 때문에 클라이언트가 변경을 요청할 때마다 대규모 사내 IT 프로젝트를 진행할 필요가 없기 때문입니다. 또한, 지속가능성 팀, 재무 팀, 내부 감사 부서, 경영진의 사용자들이 관리 리스크를 높이는 여러 로컬 파일을 주고받는 대신, 동일한 시스템에서 작업하기를 원하는 구매자에게도 적합합니다. 이러한 장점들 덕분에, 인도네시아의 그린 IT 소프트웨어 시장에서 특히 완전한 현지 인프라를 보유하는 것보다 속도와 연동 용이성이 더 중요하게 여겨지는 경우, 클라우드가 여전히 많은 첫 구매자들에게 기본적인 도입 경로로 자리 잡고 있는 이유를 설명할 수 있습니다.
일부 기업에서는 클라우드 기반 분석 및 보고서 생성을 선호하더라도 기밀성이 높은 업무 데이터나 재무 데이터에 대해서는 보다 엄격한 관리가 필요하기 때문에 하이브리드 방식의 도입은 2031년까지 연평균 성장률(CAGR) 24.38%로 확대될 것으로 예측됩니다. 정부 규정 제71/2019호에 따른 데이터 상주 요건 및 업계 고유의 감독 체계로 인해, 집계, 워크플로우 관리 및 최종 공시 자료 작성에는 클라우드 도구를 활용하면서도 일부 입력 데이터는 On-Premise 또는 로컬 호스팅 환경에 보관하는 실용적인 사례가 나타나고 있습니다. 이 아키텍처는 규제 대상 기관, 정부 산하 조직, 그리고 미가공 업무 데이터와 광범위한 보고서에 대한 접근 권한 사이에 보다 엄격한 분리를 요구하는 내부 보안 규정을 갖춘 대기업에게 특히 중요합니다. 따라서 거버넌스 규정이 로컬 인프라를 우선시하는 경우, On-Premise 시스템의 중요성은 여전히 남아 있습니다. 그렇긴 하지만, 하이브리드 모델이 성숙해지고 검증하기 쉬워지며, 리스크 관리 및 규정 준수 팀의 수용도가 높아짐에 따라 On-Premise 시스템의 상대적 비중은 줄어들 것입니다. 도입 방식의 다양성은 인도네시아의 그린 IT 소프트웨어 업계에서 편의성만으로는 구매 결정이 좌우되지 않음을 보여줍니다. 기업은 주권, 감사 대응 체계, 통합 작업의 부담, 그리고 기밀성이 높은 원본 데이터에 대한 관리 체계도 고려하고 있기 때문입니다.
기타 혜택:
- 엑셀 형식 시장 예측(ME) 시트
- 3개월간의 애널리스트 지원
자주 묻는 질문
목차
제1장 서론
제2장 조사 방법
제3장 주요 요약
제4장 시장 구도
제5장 시장 규모와 성장 예측
제6장 경쟁 구도
제7장 시장 기회와 향후 전망
JHSAccording to Mordor Intelligence, the indonesia green IT software market size is expected to increase from USD 192.50 million in 2025 to USD 232.97 million in 2026 and reach USD 669.68 million by 2031, growing at a CAGR of 23.51% over 2026-2031.

This report is Segmented by Offering (Software, and Services), Deployment (Cloud-Based, On-Premise, and Hybrid), Enterprise Size (Large Enterprises, and Small and Medium Enterprises), Solution Type (Carbon Management and Accounting Software, and More), and End User (Information Technology and Telecom, Manufacturing, Government, and More). The Market Forecasts are Provided in Terms of Value (USD).
Indonesia Green IT Software Market Trends and Insights
Regulatory Push for Corporate Carbon Disclosure in Indonesia
The Indonesia Green IT Software Market is moving faster because mandatory disclosure dates now fall within a defined corporate planning cycle, which shortens the time companies have to replace informal reporting routines with governed digital systems. In February 2026, OJK opened a consultation on amendments to POJK 51/2017, while IAI had already adopted PSPK 1 and PSPK 2 in July 2025 and formally launched on August 11, 2025, providing companies with a clearer transition path toward ISSB-aligned disclosure practices. The staged rollout from January 2027 for main board issuers, large banks, and overseas bank branches turns sustainability software from a discretionary line item into a dated compliance purchase, especially for enterprises that still rely on fragmented records and manual consolidations. Bank Indonesia also noted that TKBI Version 3 classifies information and communication as an enabling sector within sustainable finance, thereby giving digital reporting tools a clearer place in green budgeting discussions and financing frameworks. This matters because procurement teams now have both a reporting deadline and a taxonomy signal when they justify software spending to management, finance teams, and audit committees. In practice, the Indonesia Green IT Software Market is benefiting from a regulatory cycle that rewards platforms with audit trails, multi-entity controls, scenario-ready data structures, and structured disclosure workflows that can be maintained every year rather than assembled only at filing time.
Enterprise Shift from Spreadsheet-Based ESG Tracking to Audit-Ready Software
The move away from spreadsheet-based ESG tracking is changing the Indonesia Green IT Software Market from a basic reporting niche into a broader systems category that must support data ownership, traceability, approvals, and repeatable disclosure preparation. Spreadsheet files remain familiar and easy to start with, but they are weak when companies need version control, data lineage, cross-entity consolidation, supporting evidence retention, and a clear record of who changed what and when. Once assurance expectations rise, those manual steps introduce delays and error risk because emissions information is scattered across finance, operations, procurement, facilities, and supplier records that were not designed to work together under a single reporting method. TruCarbon addressed this need in January 2026 with TruCount, a platform built for IDX-listed companies that supports Scope 1, Scope 2, and 15 Scope 3 categories within OJK-aligned reporting workflows and a defined reporting window for the 2025 financial year. Its alignment with GHG Protocol, ISO 14064, and GRI 305 shows that multi-standard compatibility has become a baseline expectation rather than a premium option reserved for the most advanced users. That shift favors vendors that can turn raw operational inputs into audit-ready outputs, while also reducing the need for sustainability teams to maintain parallel spreadsheet files outside the formal system.
Fragmented Emissions Data Across Subsidiaries and Suppliers
Fragmented emissions data remains the main implementation barrier in the Indonesia Green IT Software Market because large Indonesian groups often operate through separate subsidiaries, plants, distribution entities, and supplier networks that do not share one reporting structure. Each operating unit may use a different ERP setup, approval routine, or level of data discipline, which slows consolidation even before companies begin supplier-facing Scope 3 collection. The problem becomes more apparent when enterprises try to align electricity use, fuel consumption, procurement records, logistics activities, and supporting documentation into a single auditable reporting file that management and external reviewers can both trust. The 2024 manufacturing study found that Indonesian firms faced limited data awareness, high collection costs, internal resistance to standardization, and insufficient interoperability across systems, which explains why first deployments often take longer than buyers initially expect. Those gaps increase service dependence, raise implementation effort, and force software vendors to spend more time on data mapping and validation than on higher-value planning or analytics functions. Until interoperability improves, vendors that simplify ingestion, exception handling, and validation will keep an advantage over tools that assume source systems are already clean, aligned, and centrally governed.
Other drivers and restraints analyzed in the detailed report include:
- Rising Demand for Scope 3 Visibility Across Multi-Tier Manufacturing Supply Chains
- Green Financing Requirements Tied to Measurable Digital Reporting
- Limited In-House Sustainability Analytics Talent Among Mid-Market Firms
For complete list of drivers and restraints, kindly check the Table Of Contents.
Segment Analysis
Software held 66.18% of the market in 2025, accounting for 66.18% of the Indonesia Green IT Software Market Size, because platform licenses were the first purchase for regulated enterprises that needed a structured control layer for sustainability data. Many buyers started with carbon accounting and reporting modules because those tools created a base record that later services, assurance preparation tasks, and adjacent applications could use without rebuilding the same dataset each year. This pattern fits the current stage of the Indonesia Green IT Software Market, where procurement is still led by the need to collect, classify, store, and retrieve emissions information in a formal system rather than in scattered internal files. Buyers also prefer software first because it creates a durable operating foundation that can remain in place across annual reporting cycles, internal governance reviews, and evolving disclosure standards that require repeatable methods. As a result, license-led deals still anchor budgets even as implementation work becomes more complex after the first deployment wave and as more teams begin using the same platform.
Services are projected to expand at a 25.06% CAGR through 2031, as enterprises now need migration support, organizational setup, assurance preparation, training, workflow design, and ongoing system refinement after the initial purchase. Companies that adopted platforms earlier are finding that sustainability reporting depends on data stewardship, approval routing, supporting documentation, and review readiness, which software alone cannot deliver unless a vendor or partner helps shape the operating process. This is why implementation, data mapping, evidence management, and disclosure support are becoming more commercially important inside the Indonesia Green IT Software Market, even though software remains the larger revenue pool. Workiva's September 2025 platform expansion added agentic AI, unified data automation, and Intelligent Sustainability tools aimed at finance, governance, risk, compliance, and sustainability teams preparing for IFRS S1 and IFRS S2 reporting cycles. That product direction matters because it shows how the line between software and services is narrowing, with vendors embedding guided analysis and workflow assistance into the platform itself instead of treating support as a fully separate offering.
Cloud-based deployment accounted for 57.23% of the market in 2025, and it held 57.23% of the Indonesia Green IT Software Market Share because enterprises valued faster rollout, lower upfront infrastructure needs, easier remote access, and more efficient coordination across multiple business entities. For companies operating across Indonesia's islands, cloud delivery also supports centralized data collection from plants, offices, branches, warehouses, and suppliers operating in different contexts and often reporting on different internal timetables. The model suits recurring rule updates because vendors can adjust templates, calculation logic, factor libraries, and reporting fields without requiring a large internal IT project each time a client needs a change. It also fits buyers who want sustainability teams, finance teams, internal auditors, and management users to work in the same system rather than exchanging multiple local files, which increases control risk. These advantages explain why cloud remains the default entry route for many first-time buyers in the Indonesia Green IT Software Market, especially where speed and ease of coordination matter more than full local infrastructure ownership.
Hybrid deployment is projected to expand at a 24.38% CAGR through 2031, as some companies still need tighter control over sensitive operational or financial data, even when they prefer cloud-based analytics and reporting outputs. Data residency requirements under Government Regulation No. 71/2019 and sector-specific oversight create a practical case for keeping some inputs on-premise or in locally hosted environments while using cloud tools for consolidation, workflow management, and final disclosure assembly. This architecture is especially relevant for regulated institutions, state-linked organizations, and large enterprises with internal security rules that require stronger separation between raw operational data and broader reporting access. On-premise systems, therefore, remain relevant where governance rules favor local infrastructure, even if their relative weight should narrow as hybrid models become more mature, easier to verify, and more acceptable to risk and compliance teams. The deployment mix shows that convenience alone does not shape buying decisions in the Indonesia Green IT Software industry, because enterprises also weigh sovereignty, audit readiness, integration effort, and control over sensitive source data.
Complete Report Scope:
- By Offering
- Software
- Services
- By Deployment
- Cloud-Based
- On-Premise
- Hybrid
- By Enterprise Size
- Large Enterprises
- Small and Medium Enterprises
- By Solution Type
- Carbon Management and Accounting Software
- ESG Reporting and Compliance Software
- Sustainability Data Management Platforms
- Decarbonization Planning Software
- Energy and Resource Optimization Software
- By End User Industry
- Information Technology and Telecom
- Banking, Financial Services, and Insurance
- Manufacturing
- Energy and Utilities
- Retail and E-Commerce
- Government
- Healthcare and Life Sciences
- Construction and Infrastructure
- Other End-User Industries
List of Companies Covered in this Report:
- SAP SE
- Salesforce, Inc.
- Microsoft Corporation
- Oracle Corporation
- Wolters Kluwer N.V.
- Workiva Inc.
- Nasdaq, Inc.
- IBM Corporation
- Sphera Solutions, Inc.
- Cority Software Inc.
- Intelex Technologies ULC
- Enablon SAS
- Diligent Corporation
- IBM Japan, Ltd.
- Persefoni AI, Inc.
- Watershed Technology, Inc.
- Greenly SAS
- Normative AB
- Sweep SAS
- Terrascope Pte. Ltd.
Additional Benefits:
- The market estimate (ME) sheet in Excel format
- 3 months of analyst support
TABLE OF CONTENTS
1 INTRODUCTION
- 1.1 Study Assumptions and Market Definition
- 1.2 Scope of the Study
2 RESEARCH METHODOLOGY
3 EXECUTIVE SUMMARY
4 MARKET LANDSCAPE
- 4.1 Market Overview
- 4.2 Market Drivers
- 4.2.1 Regulatory Push for Corporate Carbon Disclosure in Indonesia
- 4.2.2 Enterprise Shift From Spreadsheet-Based ESG Tracking to Audit-Ready Software
- 4.2.3 Procurement Preference for Vendors With Localized Reporting Workflows
- 4.2.4 Rising Demand for Scope 3 Visibility Across Multi-Tier Manufacturing Supply Chains
- 4.2.5 AI Assisted Emissions Factor Mapping and Data Cleansing
- 4.2.6 Green Financing Requirements Tied to Measurable Digital Reporting
- 4.3 Market Restraints
- 4.3.1 Fragmented Emissions Data Across Subsidiaries and Suppliers
- 4.3.2 Limited In-House Sustainability Analytics Talent Among Mid-Market Firms
- 4.3.3 Integration Burden With Legacy ERP and Procurement Systems
- 4.3.4 Data Sovereignty and Confidentiality Concerns in Cloud Deployment
- 4.4 Industry Value Chain Analysis
- 4.5 Impact of Macroeconomic Factors on the Market
- 4.6 Regulatory Landscape
- 4.7 Technological Outlook
- 4.8 Porter's Five Forces Analysis
- 4.8.1 Bargaining Power of Suppliers
- 4.8.2 Bargaining Power of Buyers
- 4.8.3 Threat of New Entrants
- 4.8.4 Threat of Substitutes
- 4.8.5 Competitive Rivalry
5 MARKET SIZE AND GROWTH FORECASTS (VALUE)
- 5.1 By Offering
- 5.1.1 Software
- 5.1.2 Services
- 5.2 By Deployment
- 5.2.1 Cloud-Based
- 5.2.2 On-Premise
- 5.2.3 Hybrid
- 5.3 By Enterprise Size
- 5.3.1 Large Enterprises
- 5.3.2 Small and Medium Enterprises
- 5.4 By Solution Type
- 5.4.1 Carbon Management and Accounting Software
- 5.4.2 ESG Reporting and Compliance Software
- 5.4.3 Sustainability Data Management Platforms
- 5.4.4 Decarbonization Planning Software
- 5.4.5 Energy and Resource Optimization Software
- 5.5 By End User Industry
- 5.5.1 Information Technology and Telecom
- 5.5.2 Banking, Financial Services, and Insurance
- 5.5.3 Manufacturing
- 5.5.4 Energy and Utilities
- 5.5.5 Retail and E-Commerce
- 5.5.6 Government
- 5.5.7 Healthcare and Life Sciences
- 5.5.8 Construction and Infrastructure
- 5.5.9 Other End-User Industries
6 COMPETITIVE LANDSCAPE
- 6.1 Market Concentration
- 6.2 Strategic Moves
- 6.3 Market Share Analysis
- 6.4 Company Profiles (includes Global Level Overview, Market Level Overview, Core Segments, Financials as available, Strategic Information, Market Rank/Share, Products and Services, Recent Developments)
- 6.4.1 SAP SE
- 6.4.2 Salesforce, Inc.
- 6.4.3 Microsoft Corporation
- 6.4.4 Oracle Corporation
- 6.4.5 Wolters Kluwer N.V.
- 6.4.6 Workiva Inc.
- 6.4.7 Nasdaq, Inc.
- 6.4.8 IBM Corporation
- 6.4.9 Sphera Solutions, Inc.
- 6.4.10 Cority Software Inc.
- 6.4.11 Intelex Technologies ULC
- 6.4.12 Enablon SAS
- 6.4.13 Diligent Corporation
- 6.4.14 IBM Japan, Ltd.
- 6.4.15 Persefoni AI, Inc.
- 6.4.16 Watershed Technology, Inc.
- 6.4.17 Greenly SAS
- 6.4.18 Normative AB
- 6.4.19 Sweep SAS
- 6.4.20 Terrascope Pte. Ltd.
7 MARKET OPPORTUNITIES AND FUTURE OUTLOOK
- 7.1 White-Space and Unmet-Need Assessment
