

|
시장보고서
상품코드
2073296
임원 보수 소프트웨어 : 시장 점유율 분석, 업계 동향 및 통계, 성장 예측(2026-2031년)Executive Compensation Software - Market Share Analysis, Industry Trends & Statistics, Growth Forecasts (2026 - 2031) |
||||||
 Mordor Intelligence
도입 복잡성은 임원 보수 소프트웨어 시장에 있어서 여전히 큰 족쇄가 되고 있습니다.
특히, 스프레드시트에서 본격적인 플랫폼으로 처음 전환하는 구매자의 경우라면 더욱 그렇습니다. 이러한 시스템 도입에는 대부분의 경우 HRIS, 급여 계산 시스템, ERP, 주식 보상 시스템과의 긴밀한 연동이 필요하며, 그 작업은 기술적인 설정에 그치지 않고 승인 프로세스 설계, 직무 아키텍처 구축, 보안 권한 설정, 변경 관리에 이르기까지 광범위하게 이루어집니다. 실제로 조직은 여러 소스 시스템에 분산된 보상 데이터를 대조해야 하므로, 플랫폼이 신뢰할 수 있는 계획 수립 및 보고서 작성을 지원할 수 있게 되기까지는 추가적인 시간과 서비스 비용이 소요됩니다. 이러한 부담은 중소기업이나 해당 소프트웨어를 처음 도입하는 기업을 대상으로 하는 임원 보수 소프트웨어 시장에서 더욱 크게 다가옵니다. 왜냐하면, 이러한 기업에서는 대개 도입 체계를 구축할 수 있는 사내 IT 담당자나 보수 관리 전문가가 제한적이기 때문입니다. 2031년까지 서비스 분야의 연평균 성장률(CAGR)이 10.42%로 성장을 지속하고, 있는 것은 설정, 통합 및 지원에 대한 수요를 반영할 뿐만 아니라, 도입 의향이 구현 준비 태세보다 더 강한 경우가 많다는 점을 보여줍니다.
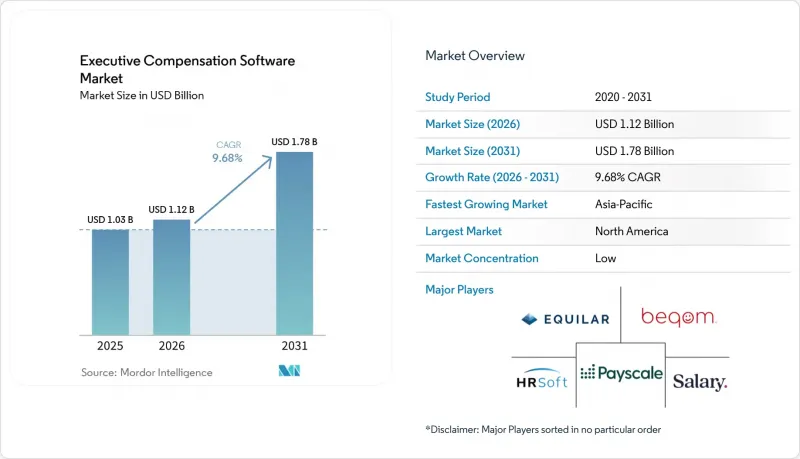
Mordor Intelligence에 따르면, 임원 보수 소프트웨어 시장 규모는 2025년에 10억 3,000만 달러로 평가되었습니다. 본 보고서는 구성 요소(소프트웨어 및 서비스), 배포 방식(클라우드 기반 등), 기업 규모(대기업 및 중소기업), 최종 사용자 산업 분야(은행, 금융서비스 및 보험(BFSI), IT 및 통신, 헬스케어 및 생명과학, 소매 및 전자상거래, 산업 제조, 정부·공공 부문 등) 및 지역별로 분류되어 있습니다. 시장 전망은 금액(달러) 기준으로 제시되어 있습니다.
세계의 임원 보수 소프트웨어 시장 동향 및 인사이트
확대되는 급여 투명성 및 급여 형평성에 관한 규제
보수 투명성에 관한 규정은 단순한 자발적 노력의 차원을 넘어, 임원 보수 소프트웨어 시장의 많은 고용주들에게 필수적인 운영 요건이 되었습니다. 2026년, 미국 16개 주와 워싱턴 D.C.에서는 채용 공고에 급여 범위를 공개하는 것이 의무화되어 있으며, 2025년 한 해 동안 몇 가지 주법이 추가로 시행됨에 따라 채용 및 보상 관리의 전체 업무 흐름에서 최신 급여 범위 데이터를 관리해야 하는 고용주의 수가 증가했습니다. EU의 임금 투명성 지침은 2026년 6월 7일까지 회원국이 이를 국내법에 반영할 것을 의무화하고 있으며, 2027년부터는 직원 250명 이상을 고용한 고용주에게 2026년 기준 데이터를 활용한 연례 보고 의무를 부과하고 있습니다. 이에 따라 소프트웨어 도입 계획은 향후 규정 준수 대응 기간이 아닌, 올해 안에 앞당겨지게 되었습니다. 이로 인해 임원 보수 소프트웨어 시장의 구매 결정 기준이 바뀌었습니다. 고용주는 통합된 기록, 역할 기반 접근 권한, 그리고 심사 시 보상 결정의 근거를 설명할 수 있는 증거를 필요로 하기 때문입니다. 또한, 다국적 기업들은 연쇄적인 영향에도 직면해 있습니다. 대상 거점 중 한 곳에서만 채용을 진행하더라도, 공유되고 있는 보상 시스템 전반에 걸쳐 더 광범위한 정책이나 데이터 변경을 해야 할 가능성이 있기 때문입니다. 따라서 규제 변경에 따라 현재는 일회성 규정 준수 대응 비용이 아닌, 지속적인 플랫폼 이용이 권장되고 있습니다.
스프레드시트 중심의 계획에서 감사 대응형 거버넌스로의 전환
이사회와 보상위원회는 임원 보수 업무 흐름에 대해 기존과는 다른 기준을 적용하고 있으며, 이에 따라 임원 보수 소프트웨어 시장은 단순한 생산성 향상의 틀을 넘어선 존재로 진화하고 있습니다. 스프레드시트 중심의 계획 수립은 제한적인 연간 업무에서는 여전히 유효하지만, 다단계 승인, Version History, 예외 사항 추적, 그리고 결정이 정책을 준수했음을 입증할 증거가 필요한 경우에는 그 한계가 드러나게 됩니다. 2026년 Silae가 670만 건의 급여 명세서를 분석한 결과, 임원 보수의 평균 격차가 13.37%인 것으로 밝혀졌습니다. 금융 및 보험 업계에서는 이러한 격차가 45%를 넘으며, 경력 기간 동안 급격히 확대되고 있는 것으로 밝혀졌는데, 이는 체계화된 데이터 없이는 구조적인 격차를 파악하기가 얼마나 어려운지를 보여줍니다. beqom의 보고서에 따르면, 유럽 기업의 38%가 자사의 현행 시스템으로는 향후 도입될 EU 요건을 충족하기에 불충분하다고 생각하고 있으며, 이는 단순한 규정 준수 의식의 유무와 같은 표면적인 문제에 그치지 않고, 준비 태세에 차이가 존재함을 시사합니다. 임원 보수 소프트웨어 시장은 이러한 변화의 혜택을 누리고 있습니다. 이는 고용주가 플랫폼을 선택할 때 거버넌스 리스크가 사이클 효율성과 동등한 수준으로 중요하게 여겨지게 되었기 때문입니다. 따라서, 보상 계획에 승인 절차, 감사 추적 기록, 관리된 워크플로를 포함시킨 공급업체는 기업으로부터 구매 결정을 이끌어내는 데 유리한 입장에 있습니다.
HRIS, 급여 계산, ERP에 걸친 통합 및 도입 비용
ISG Software의 조사에 따르면, 주요 HRIS 공급업체를 위한 사전 구축된 커넥터를 갖추지 않은 플랫폼은 기업의 조달 대상에서 제외될 위험이 있다고 지적하며, 통합 준비 상태가 공급업체 선정에 있어 결정적인 요인이 되고 있는 이유를 여실히 보여주고 있습니다.
부문별 분석
2025년, 임원 보수 소프트웨어 시장에서 소프트웨어가 72.18%의 점유율을 차지하며, 여전히 다른 분야를 크게 앞지르며 최대 구성 요소가 되었습니다. 이러한 경쟁력은 대규모 고용주들이 보상 계획, 벤치마킹, 임금 격차 분석 및 정보 공개 지원을 위해 이미 활용하고 있는 플랫폼의 도입 실적을 반영한 것입니다. 임원 보수 소프트웨어 시장에서 소프트웨어 계층이 여전히 중심적인 역할을 하고 있는 이유는 핵심 모듈이 도입되면 제한된 추가 도입 비용으로 사용자 및 프로세스의 확장을 실현할 수 있기 때문입니다. 또한 이를 통해 고용주는 본래라면 별도의 파일이나 이메일에 분산되어 있었을 승인 절차, 시나리오 모델링 및 보고서 작성을 보상 주기 전반에 걸쳐 표준화할 수 있게 됩니다. 바로 이러한 구조적 우위 덕분에, 구매자의 기대가 점점 높아지는 상황에서도 소프트웨어가 여전히 수익의 기반이 되고 있는 이유를 설명해 줍니다.
임원 보수 소프트웨어 시장의 서비스 부문은 도입 작업에 여전히 막대한 노력이 필요하기 때문에 2031년까지 연평균 성장률(CAGR) 10.42%라는 더 빠른 성장이 예상됩니다. 많은 구매자들은 분산된 급여, HRIS, 주식 보상 데이터에서 감사에 대응할 수 있는 기록을 구축하는 데 필요한 노력을 과소평가하고 있으며, 이러한 격차로 인해 설정 및 가동 후 지원에 대한 지속적인 수요가 발생하고 있습니다. 두 번째 요인은 사내 보상 팀의 성숙도 차이입니다. Payscale이 2026년에 실시한 조사에 따르면, 보상 관리 성숙도 측면에서 “발전 단계" 또는 “최적화 단계"에 도달한 조직은 고작 45%에 그쳤습니다. 이는 임원 보수 소프트웨어 업계가 플랫폼의 기능을 체계적인 거버넌스 프로세스로 전환하기 위해 여전히 외부 전문 지식에 의존하고 있음을 의미합니다. 그 결과, 소프트웨어가 수익 기반을 제공하는 한편, 서비스 부문이 신규 구매자나 도입 초기 단계에 있는 기업들이 여전히 관리에 어려움을 겪고 있는 운영상의 복잡성을 해소해 주는 시장이 형성되고 있습니다.
2025년에는 클라우드 기반 도입이 매출의 75.44%를 차지했으며, 2031년까지 연평균 성장률(CAGR) 10.11%를 유지하며 여전히 가장 규모가 크고 가장 빠르게 성장하는 도입 모델로 자리매김하고 있습니다. 임원 보수 소프트웨어 시장에서는 클라우드 기반 서비스가 선호되고 있습니다. 이는 보상 계획 수립 과정에 일반적으로 인사, 재무, 법무 및 이사회 관계자들이 참여하며, 평가 주기 동안 동일한 최신 기록에 접근해야 하기 때문입니다. 또한, 이 모델은 보고 규칙이나 보상 투명성에 관한 요건이 변경될 때에도 보다 신속한 제품 업데이트를 지원합니다. 따라서 고용주는 현지 인프라를 재구축할 필요 없이, 정기적인 업데이트에서 보다 지속적인 거버넌스로 전환할 수 있습니다. 이러한 편의성 덕분에 클라우드 서비스는 임원 보수 소프트웨어 시장의 주류에서 기본적인 선택지로 자리 잡았습니다.
On-Premise 및 프라이빗 클라우드라는 선택지는 특정 규제 환경, 특히 데이터 소재 요건이나 감독 당국의 기대치가 여전히 엄격한 BFSI(은행 및 금융 및 보험) 및 정부 기관 환경에서 여전히 가치를 지니고 있습니다. 독일의 IVV 5.0 프레임워크는 신용 기관의 변동 보수 관리에 대한 문서화, 다년간에 걸친 이연, 그리고 페널티(마르스) 및 회수(클로백) 추적의 필요성을 강화했습니다. 이 때문에 일부 은행은 퍼블릭 클라우드로의 완전한 전환에 대해 신중한 입장을 유지하고 있습니다. 따라서 임원 보수 소프트웨어 시장은 단순히 ‘클라우드 전용"라는 단순한 이야기가 아니라, 더 복잡한 양상을 띠고 있습니다. 규제 대상 구매자들은 기밀성이 가장 높은 기록에 대한 관리 권한을 유지할 수 있는 하이브리드 구성을 선호하는 경우가 많기 때문입니다. 기본적인 SaaS 서비스만을 제공하는 벤더라도 폭넓은 일반 기업 대상 사업을 확보하는 것은 가능하지만, 규제가 엄격한 분야에서는 어려움을 겪을 가능성이 있습니다. 따라서 임원 보수 소프트웨어 업계에서는 ‘클라우드 우선’ 설계가 계속해서 높이 평가되는 한편, 복잡한 요구 사항을 가진 구매자를 위해 프라이빗 또는 하이브리드 도입 모델을 지원할 수 있는 벤더에게도 여전히 활약할 여지가 남아 있습니다.
지역별 분석
2025년, 북미는 임원 보수 소프트웨어 시장 규모의 41.38%를 차지하며, 지역별로는 가장 큰 점유율을 기록했습니다. 이 지역은 SEC(미국 증권거래위원회)에 보고할 의무가 있는 발행사가 집중되어 있고, 임금 격차 해소를 위한 활발한 법적 규제 환경이 조성되어 있으며, 주식 보상을 주축으로 하는 임원 보상 체계가 광범위하게 도입되고 있다는 점 등의 요인으로 인해 혜택을 보고 있습니다. 미국에서는 SEC의 “보상과 실적의 상관관계"정보 공개, 주 정부 차원의 급여 범위 공표, 그리고 클로백(반환)과 관련된 거버넌스 등 중복되는 요건들이 임원 보상 소프트웨어 시장을 뒷받침하고 있습니다. 캐나다와 멕시코는 국경을 초월한 거버넌스의 일관성을 통해 지역 내 수요를 뒷받침하고 있으며, 특히 북미 전역의 사업에서 공통된 보상 관리 체계를 요구하는 다국적 기업들 사이에서 이러한 경향이 두드러집니다.
아시아태평양은 2031년까지 연평균 성장률(CAGR) 11.76%를 나타낼 것으로 예측되며, 임원 보상 소프트웨어 시장에서 가장 빠른 성장세를 보일 것으로 전망됩니다. 이러한 성장의 요인으로는 인도 및 동남아시아 기업들의 디지털 HR 현대화, 일본의 임원 보수 감독 강화, 그리고 중국, 싱가포르, 한국의 다국적 기업들의 급여 관리 체계 확대 등을 들 수 있습니다. Ravio사의 “2026년 보수 동향 "보고서에 따르면, 아시아태평양 및 유럽의 기술 시장에서 AI 및 ML 관련 직종의 채용이 전년 대비 88% 증가했으며, 이러한 직종에는 12%의 급여 프리미엄이 적용되고 있습니다."이에 따라 벤치마크의 신속한 갱신과 체계적인 급여 결정의 필요성이 커지고 있습니다. 또한 HRSoft는 아시아태평양(APAC), EU, 중동의 금융 서비스 산업이 고객 확보 측면에서 가장 빠르게 성장하고 있는 분야 중 하나임을 보여주며, 규제가 엄격한 보상 환경 속에서 해당 지역의 성장세가 더욱 가속화되고 있음을 뒷받침하고 있습니다.
유럽은 임원 보수 소프트웨어 시장에서 여전히 규제가 엄격한 지역이며, 대기업 및 일부 중견 기업에서 도입을 주도하고 있습니다. EU의 “보수 투명성 지침"에 기반한 2026년 데이터와 관련된 첫 번째 보고 주기를 통해, 2026년에는 일반적인 규정 준수 의식이 적극적인 조달 활동으로 전환되고 있습니다. 독일에서는 IVV 5.0 및 신용기관에 대한 관련 거버넌스 요건으로 인해 규제가 한층 더 강화되었으며, 임원 보수 감독에 있어 인사, 컴플라이언스, 리스크 데이터의 보다 통합적인 활용이 요구되고 있습니다. 남미에서는 도입이 아직 초기 단계에 있는 반면, 중동 및 아프리카 수요는 완전히 현지화된 플랫폼의 도입이라기보다는 그룹 차원의 보상 통합이 필요한 지역 본부나 다국적 기업의 자회사에 집중되어 있습니다.
기타 혜택 :
- 엑셀 형식 시장 예측(ME) 시트
- 3개월간의 애널리스트 지원
자주 묻는 질문
목차
제1장 서론
제2장 조사 방법
제3장 주요 요약
제4장 시장 구도
제5장 시장 규모 및 성장 예측
제6장 경쟁 구도
제7장 시장 기회 및 향후 전망
KTH 26.07.08Implementation complexity remains a real brake on the executive compensation software market, especially for buyers moving from spreadsheets to a formal platform for the first time. These deployments often require deep links into HRIS, payroll, ERP, and equity systems, and the work extends beyond technical setup into approvals design, job architecture, security permissions, and change management. In practice, organizations also need to reconcile compensation data that sits across multiple source systems, which adds time and service cost before the platform can support reliable planning or reporting. This burden is heavier in the executive compensation software market for SMEs and first-time buyers, because they usually have fewer internal IT and compensation specialists available to structure the rollout. The continued 10.42% CAGR for services through 2031 reflects that demand for configuration, integration, and support, and it also shows that adoption intent is often stronger than implementation readiness.
According to Mordor Intelligence, the executive compensation software market was valued at USD 1.03 billion in 2025. This report is Segmented by Component (Software, and Services), Deployment Model (Cloud-Based, and More), Enterprise Size (Large Enterprises, and SMEs), End-User Industry (BFSI, IT and Telecommunications, Healthcare and Lifesciences, Retail and E-Commerce, Industrial Manufacturing, Government and Public Sector, and More), and Geography. The Market Forecasts are Provided in Terms of Value (USD).
Global Executive Compensation Software Market Trends and Insights
Expanding Pay Transparency and Pay Equity Regulation
Pay transparency rules have moved beyond voluntary practice and into mandatory operating requirements for many employers in the executive compensation software market. As of 2026, 16 US states and Washington, D.C., required salary range disclosure in job postings, and several additional state laws became effective across 2025, which widened the number of employers that had to manage live pay range data across recruiting and rewards workflows. The EU Pay Transparency Directive requires member-state transposition by June 7, 2026, and it sets up annual reporting obligations for employers with 250 or more employees from 2027 using 2026 baseline data, which pulled software planning into the current year rather than a later compliance window. This has changed the buying case in the executive compensation software market, because employers need centralized records, role-based access, and evidence that pay decisions can be explained under review. Multinational employers also face a cascade effect, since hiring into one covered location can force broader policy and data changes across shared compensation systems. That is why regulatory change now supports recurring platform usage instead of a one-off compliance spend.
Shift from Spreadsheet-Led Planning to Audit-Ready Governance
Boards and compensation committees are applying a different standard to executive pay workflows, and that is lifting the executive compensation software market beyond a productivity narrative. Spreadsheet-led planning still works for narrow annual exercises, but it breaks down when employers need multi-level approvals, version history, exception tracking, and evidence that decisions followed policy. A 2026 Silae analysis of 6.7 million payslips found an average executive pay gap of 13.37%, with the gap rising above 45% in financial and insurance activity and widening sharply over the span of a career, which shows how hard it is to detect structural gaps without organized data. beqom reported that 38% of European companies viewed their current systems as inadequate for incoming EU requirements, which points to a readiness gap that extends well beyond headline compliance awareness. The executive compensation software market gains from this shift because governance risk now matters as much as cycle efficiency when employers choose a platform. Vendors that embed approvals, audit trails, and controlled workflows into compensation planning are, therefore, better placed to win enterprise buying decisions.
Integration and Implementation Costs Across HRIS, Payroll, And ERP
ISG Software Research noted that platforms without pre-built connectors to major HRIS vendors risk exclusion from enterprise procurement, underscoring why integration readiness has become a gating factor in vendor selection.
Other drivers and restraints analyzed in the detailed report include:
- Cloud-Native Integration with Human Capital Management and Finance Stacks
- Rising Demand for Market Benchmarking and Retention-Driven Pay Decisions
- Sensitive Pay Data Privacy and Cybersecurity Exposure
For complete list of drivers and restraints, kindly check the Table Of Contents.
Segment Analysis
Software held 72.18% of the executive compensation software market share in 2025, which kept it as the largest component by a wide margin. That dominance reflects the installed base of platforms already used for compensation planning, benchmarking, pay equity analytics, and disclosure support across larger employers. The software layer remains central in the executive compensation software market because once core modules are deployed, additional users and process extensions can be added with limited incremental delivery cost. It also allows employers to standardize approval paths, scenario modeling, and reporting across compensation cycles that would otherwise sit in separate files and emails. This structural advantage explains why software still anchors revenue even as buyer expectations become more demanding.
The services side of the executive compensation software market is still projected to grow faster, at a 10.42% CAGR through 2031, because implementation work remains intensive. Many buyers underestimate the effort needed to build audit-ready records from fragmented payroll, HRIS, and equity data, and that gap creates recurring demand for configuration and post-go-live support. A second factor is the maturity gap within internal compensation teams, because Payscale found in 2026 that only 45% of organizations had reached an advancing or optimizing state in compensation maturity. That means the executive compensation software industry still depends on outside expertise to convert platform features into controlled governance processes. The result is a market where software provides the revenue base, while services absorb the operational complexity that new buyers and late-stage adopters still struggle to manage.
Cloud-based deployment accounted for 75.44% of revenue in 2025, and it remains both the largest and fastest-growing deployment model with a 10.11% CAGR through 2031. The executive compensation software market favors cloud delivery because compensation planning usually involves HR, finance, legal, and board participants who need access to the same current records across review cycles. This model also supports quicker product updates when reporting rules or pay transparency requirements change. Employers can therefore move from periodic updates to more continuous governance without rebuilding local infrastructure. That convenience has made cloud delivery the default option for the commercial mainstream of the executive compensation software market.
On-premises and private cloud options still hold value in specific regulated settings, particularly in BFSI and government environments where data residency and supervisory expectations remain strict. Germany's IVV 5.0 framework strengthened the need for documented variable pay controls, multi-year deferral, and malus or clawback tracking in credit institutions, which keeps some banks cautious about fully public cloud deployment. That makes the executive compensation software market more nuanced than a simple cloud-only story, because regulated buyers often prefer hybrid configurations that preserve control over the most sensitive records. Vendors with only a basic SaaS offer can still win broad commercial business, but they may struggle in tightly supervised segments. The executive compensation software industry therefore continues to reward cloud-first design while still leaving room for vendors that can support private or hybrid deployment models for complex buyers.
Complete Report Scope:
- By Component
- Software
- Services
- By Deployment Model
- Cloud-Based
- On-Premises
- By Enterprise Size
- Large Enterprises
- SMEs
- By End-User Industry
- BFSI
- IT and Telecommunications
- Healthcare and Lifesciences
- Retail and E-commerce
- Industrial Manufacturing
- Government and Public Sector
- Other End-user Industries
- By Geography
- North America
- United States
- Canada
- Mexico
- South America
- Brazil
- Argentina
- Chile
- Rest of South America
- Europe
- Germany
- United Kingdom
- France
- Italy
- Spain
- Netherlands
- Russia
- Rest of Europe
- Asia-Pacific
- China
- Japan
- India
- Australia
- Singapore
- South Korea
- Rest of Asia-Pacific
- Middle East
- Saudi Arabia
- United Arab Emirates
- Turkey
- Rest of Middle East
- Africa
- South Africa
- Nigeria
- Egypt
- Rest of Africa
- North America
Geography Analysis
North America held 41.38% of the executive compensation software market size in 2025, which made it the largest regional contributor. The region benefits from the concentration of SEC-reporting issuers, an active pay equity legal environment, and widespread use of equity-heavy executive pay structures. In the United States, the executive compensation software market is supported by overlapping requirements that cover SEC Pay versus Performance disclosure, state salary range posting, and clawback-related governance. Canada and Mexico add to regional demand through cross-border governance alignment, especially among multinational employers that want common compensation controls across North American operations.
Asia-Pacific is projected to grow at an 11.76% CAGR through 2031, giving it the fastest regional trajectory in the executive compensation software market. Growth is coming from digital HR modernization in Indian and Southeast Asian firms, stronger executive remuneration oversight in Japan, and expanding multinational payroll governance across China, Singapore, and South Korea. Ravio's 2026 Compensation Trends report recorded 88% year-over-year growth in AI and ML hiring across Asia-Pacific and European tech markets, with those roles carrying 12% pay premiums, which raises the need for faster benchmark refresh and structured pay decisions. HRSoft also indicated that APAC, EU, and Middle East financial services verticals were among its fastest-growing customer acquisition areas, reinforcing the region's momentum in more regulated compensation environments.
Europe remains a high-intensity regulatory region in the executive compensation software market, and it is pulling adoption forward across both large enterprises and parts of the mid-market. The first reporting cycle tied to 2026 data under the EU Pay Transparency Directive is turning general compliance awareness into active procurement work in 2026. Germany adds another layer through IVV 5.0 and related governance expectations for credit institutions, which require more integrated HR, compliance, and risk data in executive pay oversight. South America is still earlier in adoption, while the Middle East and Africa demand is more concentrated among regional headquarters and multinational subsidiaries that need group-level compensation consolidation rather than a fully localized platform footprint.
- Salary.com, LLC
- Payscale, Inc.
- beqom SA
- Equilar, Inc.
- HRsoft, Inc.
- Decusoft, Inc.
- Aeqium, Inc.
- Compport Private Limited
- OpenComp, Inc.
- Trove Information Technologies, Inc. dba Pave
- Figures SAS
- Ravio Technologies Ltd.
- Performing Ideas HR AB
- Compa Technologies, Inc.
- Main Data Group
- BullseyeEngagement LLC
- Laserbeam Software, LLC
- Syndio, Inc.
- Incentiv, Inc.
- PerformanceCentre, Inc.
Additional Benefits:
- The market estimate (ME) sheet in Excel format
- 3 months of analyst support
TABLE OF CONTENTS
1 INTRODUCTION
- 1.1 Study Assumptions and Market Definition
- 1.2 Scope of the Study
2 RESEARCH METHODOLOGY
3 EXECUTIVE SUMMARY
4 MARKET LANDSCAPE
- 4.1 Market Overview
- 4.2 Market Drivers
- 4.2.1 Expanding Pay Transparency and Pay Equity Regulation
- 4.2.2 Shift From Spreadsheet-Led Planning to Audit-Ready Governance
- 4.2.3 Cloud-Native Integration With Human Capital Management and Finance Stacks
- 4.2.4 Rising Demand for Market Benchmarking and Retention-Driven Pay Decisions
- 4.2.5 SEC Pay Versus Performance and Board-Ready Disclosure Automation
- 4.2.6 ESG-Linked and Risk-Adjusted Long-Term Incentive Design Complexity
- 4.3 Market Restraints
- 4.3.1 Integration and Implementation Costs Across HRIS, Payroll, and ERP
- 4.3.2 Sensitive Pay Data Privacy and Cybersecurity Exposure
- 4.3.3 Survey Data Fragmentation and Weak Job Architecture
- 4.3.4 Cross-Functional Approval Bottlenecks Across HR, Finance, Legal, and Boards
- 4.4 Industry Value Chain Analysis
- 4.5 Regulatory Landscape
- 4.6 Technological Outlook
- 4.7 Impact of Macroeconomic Factors on the Market
- 4.8 Porter's Five Forces Analysis
- 4.8.1 Threat of New Entrants
- 4.8.2 Bargaining Power of Buyers
- 4.8.3 Bargaining Power of Suppliers
- 4.8.4 Threat of Substitutes
- 4.8.5 Intensity of Competitive Rivalry
5 MARKET SIZE AND GROWTH FORECASTS (VALUE)
- 5.1 By Component
- 5.1.1 Software
- 5.1.2 Services
- 5.2 By Deployment Model
- 5.2.1 Cloud-Based
- 5.2.2 On-Premises
- 5.3 By Enterprise Size
- 5.3.1 Large Enterprises
- 5.3.2 SMEs
- 5.4 By End-User Industry
- 5.4.1 BFSI
- 5.4.2 IT and Telecommunications
- 5.4.3 Healthcare and Lifesciences
- 5.4.4 Retail and E-commerce
- 5.4.5 Industrial Manufacturing
- 5.4.6 Government and Public Sector
- 5.4.7 Other End-user Industries
- 5.5 By Geography
- 5.5.1 North America
- 5.5.1.1 United States
- 5.5.1.2 Canada
- 5.5.1.3 Mexico
- 5.5.2 South America
- 5.5.2.1 Brazil
- 5.5.2.2 Argentina
- 5.5.2.3 Chile
- 5.5.2.4 Rest of South America
- 5.5.3 Europe
- 5.5.3.1 Germany
- 5.5.3.2 United Kingdom
- 5.5.3.3 France
- 5.5.3.4 Italy
- 5.5.3.5 Spain
- 5.5.3.6 Netherlands
- 5.5.3.7 Russia
- 5.5.3.8 Rest of Europe
- 5.5.4 Asia-Pacific
- 5.5.4.1 China
- 5.5.4.2 Japan
- 5.5.4.3 India
- 5.5.4.4 Australia
- 5.5.4.5 Singapore
- 5.5.4.6 South Korea
- 5.5.4.7 Rest of Asia-Pacific
- 5.5.5 Middle East
- 5.5.5.1 Saudi Arabia
- 5.5.5.2 United Arab Emirates
- 5.5.5.3 Turkey
- 5.5.5.4 Rest of Middle East
- 5.5.6 Africa
- 5.5.6.1 South Africa
- 5.5.6.2 Nigeria
- 5.5.6.3 Egypt
- 5.5.6.4 Rest of Africa
- 5.5.1 North America
6 COMPETITIVE LANDSCAPE
- 6.1 Market Concentration
- 6.2 Strategic Moves
- 6.3 Market Share Analysis
- 6.4 Company Profiles (includes Global Level Overview, Market Level Overview, Core Segments, Financials as available, Strategic Information, Market Rank/Share, Products and Services, Recent Developments)
- 6.4.1 Salary.com, LLC
- 6.4.2 Payscale, Inc.
- 6.4.3 beqom SA
- 6.4.4 Equilar, Inc.
- 6.4.5 HRsoft, Inc.
- 6.4.6 Decusoft, Inc.
- 6.4.7 Aeqium, Inc.
- 6.4.8 Compport Private Limited
- 6.4.9 OpenComp, Inc.
- 6.4.10 Trove Information Technologies, Inc. dba Pave
- 6.4.11 Figures SAS
- 6.4.12 Ravio Technologies Ltd.
- 6.4.13 Performing Ideas HR AB
- 6.4.14 Compa Technologies, Inc.
- 6.4.15 Main Data Group
- 6.4.16 BullseyeEngagement LLC
- 6.4.17 Laserbeam Software, LLC
- 6.4.18 Syndio, Inc.
- 6.4.19 Incentiv, Inc.
- 6.4.20 PerformanceCentre, Inc.
7 MARKET OPPORTUNITIES AND FUTURE OUTLOOK
- 7.1 White-Space and Unmet-Need Assessment


