

|
시장보고서
상품코드
2073302
임금 평등 분석 플랫폼 : 시장 점유율 분석, 업계 동향 및 통계, 성장 예측(2026-2031년)Pay Equity Analytics Platform - Market Share Analysis, Industry Trends & Statistics, Growth Forecasts (2026 - 2031) |
||||||
 Mordor Intelligence
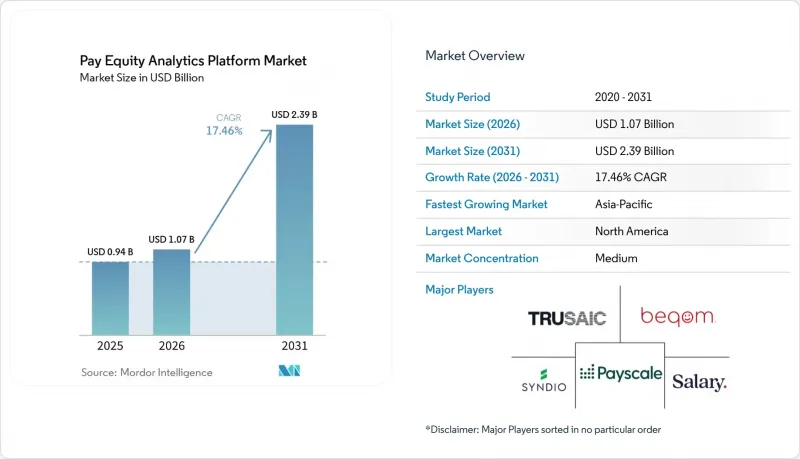
Mordor Intelligence에 의하면, 임금 평등 분석 플랫폼 시장 규모는 2025년 9억 4,000만 달러로 평가되었습니다. 2026년 10억 7,000만 달러에서 2031년까지 23억 9,000만 달러로 확대될 것으로 예측되며 2026년부터 2031년까지 연평균 복합 성장률(CAGR)은 17.46%를 나타낼 전망입니다.
본 보고서는 배포 방식(클라우드 기반 및 On-Premise형), 조직 규모(대기업 및 중소기업), 용도(임금 평등 분석, 벤치마킹 및 보상 분석, 규정 준수 및 규제 보고 등), 최종 사용자 산업(은행, 금융서비스 및 보험(BFSI), IT 및 통신 등) 및 지역별로 분류되어 있습니다. 시장 전망은 금액(달러) 기준으로 제시되어 있습니다.
세계의 임금 평등 분석 플랫폼 시장 동향 및 인사이트
EU의 임금 투명성 지침이 즉각적인 규정 준수 요구를 불러일으키고 있습니다.
2026년 6월 7일이라는 국내법 반영 기한은 임금 평등 분석 플랫폼 시장에 있어 가장 명확한 단기적 촉매 요인으로 작용하고 있습니다. 이 지침은 구직자에 대한 급여 범위의 투명성을 의무화하고, 직원이 급여 수준 정보에 접근할 수 있도록 하며, 급여 이력 조회 관행을 제한하고, 급여 비밀 유지 조항을 금지하는 것으로, 이에 따라 보상 데이터는 일회성 검토가 아닌 규제 대상 업무 프로세스로 전환될 것입니다. 직원 수가 150명 이상인 고용주는 2027년 6월 7일까지 첫 번째 남녀 간 임금 격차 보고서를 공개해야 하며, 직원 수가 100명 이상인 고용주도 2031년까지 이에 따라야 합니다. 또한, 이 지침에서는 정당한 사유 없이 발생하는 임금 격차에 대해 5%라는 기준치가 설정되어 있으며, 6개월 이내에 격차가 시정되지 않을 경우 고용주는 근로자 대표와 공동으로 임금 평가를 실시해야 합니다. 이러한 요인들이 복합적으로 작용함에 따라, 임금 평등 분석 플랫폼 시장은 근로자 분류, 시정 기간 추적, 그리고 여러 관할 구역에 걸친 적법한 기록 보관이 가능한, 감사 대응 수준의 시스템으로 발전하고 있습니다. 또한, 같은 규제로 인해 임금 평등 분석 플랫폼 시장의 구매자층도 확대되고 있습니다. 이는 이전에는 공식 보고 대상에서 제외되었던 중규모 고용주들이 현재 규정 준수를 위해 조치를 취하고 있기 때문입니다.
미국의 주별 임금 투명성 법안이, 제각각인 규정 준수 시장을 주도하고 있습니다.
주 차원의 규제 제정은 임금 평등 분석 플랫폼 시장에 있어 두 번째 주요 수요원이 되고 있습니다. 콜로라도주는 계속해서 “동일노동동일임금법"를 시행하고 있으며, 위반에 대한 벌금 총액이 84만 1,500달러에 달한 것으로 보고되었습니다. 이는 규정 위반이 더 이상 평판 위험에 그치지 않고, 눈에 보이는 금전적 손실을 초래하게 되었음을 보여줍니다. 매사추세츠주에서는 현재 특정 상황에서 급여 범위를 공개해야 할 의무가 있으며, 이 법은 직원 25명 이상을 고용한 고용주에게 적용됩니다. 이로 인해 공식적인 임금 투명성 관리 도입 기준이 실질적으로 낮아졌습니다. 원격 및 분산형 팀을 아우르며 사업을 전개하는 고용주에게 있어 과제는 단일 법령이라기보다는 주마다 다른 게시, 기록 관리, 보고에 관한 여러 규정을 동시에 조율하는 데 있습니다. 따라서 임금 평등 분석 플랫폼 시장은 통합된 정책 로직, 재사용 가능한 직무 구조, 표준화된 공시 워크플로우에 대한 수요의 혜택을 받고 있습니다. 또한, 이러한 패치워크와 같은 상황은 규칙 라이브러리를 신속하게 업데이트하고, 단일 보고 계층을 통해 주별 결과를 제시할 수 있는 공급업체에게 유리하게 작용하고 있습니다.
보상 데이터의 개인정보 보호 위험이 기업의 도입을 제약하고 있습니다.
데이터의 기밀성은 여전히 임금 평등 분석 플랫폼 시장에서 가장 뚜렷한 장벽 중 하나입니다. 이러한 플랫폼은 보상, 인구통계학적 특성, 성과 정보, 경력 정보를 처리해야 하기 때문에 구매자는 종종 HR 스택 전반에 적용되는 가장 엄격한 기준에 따라 평가를 진행합니다. Evenpay는 GDPR(EU 개인정보보호규정)을 준수하는 EU 내 데이터 보관 및 보안 관리를 제품 가치의 일부로 삼고 있으며, 이는 규제 시장에서 해당 솔루션의 도입이 개인정보 보호에 대한 기대와 얼마나 밀접하게 연결되어 있는지를 보여줍니다. beqom사의 “PayAnalytics" 또한, 기업용으로 구축된 프레임워크 중에서도 임금 격차 해소와 노동력 분석을 중시하고 있으며, 인증 및 거버넌스가 구매의 필수 조건으로 요구되는 현 상황을 반영하고 있습니다. 임금 평등 분석 플랫폼 시장에서 이는 소규모 공급업체에게 진입 장벽을 높이는 요인이 되고 있습니다. 왜냐하면 구매자는 급여 데이터나 직원 기록을 연동하기 전에, 데이터 처리에 관한 명확한 증거를 요구하고 있기 때문입니다. 따라서 개인정보 보호 규제는 전문 플랫폼의 필요성을 높이는 한편, 일부 거래를 지연시키는 요인이 되기도 합니다.
부문별 분석
2025년 기준으로 임금 평등 분석 플랫폼 시장 규모의 76.18%를 클라우드 기반 도입이 차지했으며, 2031년까지 연평균 성장률(CAGR) 18.94%로 확대될 것으로 예측됩니다. 임금 평등 분석 플랫폼 시장에서 이러한 경쟁력은 반복적인 파일 전송에 의존하지 않고 급여, HRIS, ATS 및 보상 계획 데이터를 연동하려는 실질적인 요구를 반영하고 있습니다. 또한, 클라우드 모델에서는 공급업체가 단일 관리 환경에서 모든 클라이언트의 보고서 로직을 업데이트할 수 있으므로, 다국적 정책 변경에도 보다 효율적으로 대응할 수 있습니다. 유럽이나 북미에서는 규정이 중복되는 경우가 많아, 고용주는 빈번한 법 개정에 대응할 수 있는 시스템을 필요로 하고 있으며, 매번 새로운 IT 프로젝트를 시작할 필요가 없기 때문에 이 점은 점점 더 중요해지고 있습니다.
On-Premise형 도구는 일부 금융기관, 공공기관 및 엄격한 호스팅 요건을 갖춘 조직에서 여전히 일정한 위치를 차지하고 있습니다. 그렇긴 하지만, 많은 구매자들에게 있어 신속한 도입, 일원화된 관리, 그리고 강력한 통합 경로가 과거 클라우드에 대한 우려를 상쇄하게 되면서, 임금 평등 분석 플랫폼 시장 수요 균형은 호스팅형 환경으로 점차 이동하고 있습니다. 2025년 초 Payscale이 통합 기능을 확충한 것은 경쟁의 초점이 고립된 분석에서 연계형 도입으로 이동했음을 여실히 보여주고 있습니다. 이와 유사한 경향은 기업의 조달 활동에서도 나타나고 있으며, 구매 담당자들은 플랫폼이 도입 첫날부터 기존의 인사 관리(HCM) 워크플로우에 통합될 수 있는지 여부를 점점 더 중요하게 여기고 있습니다. 따라서 임금 평등 분석 플랫폼 업계에서는 도입 방식의 선택이 인프라에 대한 선호도보다는 클라이언트가 원시 데이터를 바탕으로 타당한 의사결정을 얼마나 신속하게 내릴 수 있는지에 중점을 두게 되었습니다.
2025년에는 대기업이 66.42%의 점유율을 차지했으나, 중소기업(SME)은 2031년까지 연평균 성장률(CAGR) 20.87%로 성장할 것으로 전망됩니다. 임금 평등 분석 플랫폼 시장은 여전히 대기업에 편중되어 있습니다. 이는 대기업이 더 많은 법인, 더 많은 지역, 더 다양한 보상 체계를 아우르며 사업을 전개하고 있기 때문에 보고의 복잡성과 시정 조치의 위험이 모두 높아지기 때문입니다. Syndio사의 보고서에 따르면, 이 회사의 플랫폼은 100개국에 걸쳐 1,000만 명 이상의 직원의 급여를 관리하고 있으며, 포춘 100대 기업의 50% 이상을 포함해 전 세계 약 400개 기업에 서비스를 제공합니다. 이러한 수준의 도입 실적은 대기업 고객들이 여전히 임금 평등 분석 플랫폼 시장의 상업적 기반을 형성하고 있는 이유를 보여줍니다.
그러나 더욱 급속한 성장이 예상되는 분야는 처음으로 공식적인 공시 및 보고 의무의 대상이 되는 중소규모 고용주로의 전환입니다. 유럽에서는 직원 100명 이상의 보고 기준에 따라, 예측 기간 동안 잠재 고객층이 대폭 확대될 것입니다. 또한 미국에서는 이미 몇몇 주에서 소규모 고용주에게도 규제가 적용되고 있습니다. 예를 들어, 매사추세츠주에서는 해당 상황에 해당하는 직원 25명 이상을 고용한 고용주에게 급여 범위 공개 요건이 적용됩니다. 2025년 5월 Ravio가 진행한 1,200만 달러 규모의 시리즈 A 자금 조달은 국제적인 사업 확장을 목적으로 한 것으로, 전 세계 기업뿐만 아니라 성장 중인 기업에도 유용한 도구에 대한 투자자들의 관심을 반영하고 있습니다. 따라서 벤더들이 이 신흥 중견 시장 수요층을 확보해 나감에 따라, 임금 평등 분석 플랫폼 시장에서는 보다 간소화된 패키지화, 신속한 구축, 그리고 모듈식 가격 책정이 보편화될 것으로 보입니다.
지역별 분석
2025년, 북미는 임금 평등 분석 플랫폼 시장 점유율의 44.26%를 차지하며 지역별 최대 점유율을 기록했습니다. 이 지역은 특히 미국과 캐나다에서 법적 강제력, 고용주의 인식, 그리고 소프트웨어 도입에 대한 높은 준비 태세라는 타의 추종을 불허하는 조합의 혜택을 누리고 있습니다. 미국에서 임금 평등 분석 플랫폼 시장은 고용주가 분산된 전 직원을 대상으로 관리해야 하는 주 차원의 임금 공개 및 보고 의무망이 확대됨에 따라 성장하고 있습니다. 콜로라도주의 집행 실적은 이 문제가 얼마나 심각한지를 보여주고 있으며, 해당 주는 “동일노동동일임금법"에 근거하여 총 84만 1,500달러의 위반 벌금을 부과했다고 보고하고 있습니다.
유럽의 임금 평등 분석 플랫폼 시장은 지역별 규모에서 2위를 차지하고 있지만, 가장 근본적인 규제 재검토가 진행되고 있습니다. 유럽연합(EU)의 임금 투명성 관련 규정은 27개 회원국 모두에 적용되며, 민간 및 공공 부문의 고용을 불문하고 이 지역에서는 이례적으로 광범위한 규정 준수 대상이 형성되어 있습니다. 2026년 6월의 국내법 반영 기한에 이어, 직원 150명 이상의 고용주와 100명 이상의 고용주에게 단계적으로 보고 의무가 부과됨에 따라, 일회성으로 서둘러 대응하는 것이 아니라 수년에 걸쳐 시행되는 주기가 형성되고 있습니다. 또한, 5%라는 “정당한 이유 없는 격차"의 기준치 또한 사업 운영상의 위험을 높이고 있습니다. 왜냐하면 미해결 지적 사항이 있을 경우, 고용주가 공동 임금 평가 절차에 포함될 가능성이 있기 때문입니다.
아시아태평양은 임금 평등 분석 플랫폼 시장에서 가장 빠르게 성장하고 있는 지역 부문으로, 2031년까지 연평균 성장률(CAGR) 22.41%를 기록하며 확대될 것으로 전망됩니다. 이 지역의 성장은 전 세계 사업 전반에 걸쳐 일관된 보고 체계를 요구하는 다국적 기업들과, 임금 투명성 실천을 본격적으로 도입하기 시작한 현지 기업들에 의해 뒷받침되고 있습니다. 현재의 동향은 북미나 서유럽에 비해 여전히 사후 대응적인 경향이 강하며, 법적 의무가 명확해지는 단계에서 도입이 가속화되는 경향을 보이고 있습니다. 지역 내 고용주들이 인사 데이터 기반을 개선하고 급여 계산과 보상 거버넌스의 보다 긴밀한 통합을 추구함에 따라, 이러한 격차는 더욱 확대될 여지가 남아 있습니다. 남미, 중동 및 아프리카는 임금 평등 분석 플랫폼 시장에서 여전히 초기 단계에 있는 지역이지만, 현지 보고 요건이 직무 체계 및 규정 준수 워크플로우를 현지화할 수 있는 공급업체에게 비즈니스 기회를 창출하기 시작하고 있습니다. beqom사의 “PayAnalytics"는 남아프리카공화국의 고용주를 대상으로, “고용평등법(Employment Equity Act)"에 근거한 연례 보고서와 향후 도입될 투명성 요건에 관한 지침을 이미 공개했으며, 이는 해당 지역에서의 비즈니스 기회 확대를 시사하고 있습니다.
기타 혜택 :
- 엑셀 형식 시장 예측(ME) 시트
- 3개월간의 애널리스트 지원
자주 묻는 질문
목차
제1장 서론
제2장 조사 방법
제3장 주요 요약
제4장 시장 구도
제5장 시장 규모 및 성장 예측
제6장 경쟁 구도
제7장 시장 기회 및 향후 전망
KTH 26.07.08According to Mordor Intelligence, the pay equity analytics platform market size is projected to expand from USD 0.94 billion in 2025 and USD 1.07 billion in 2026 to USD 2.39 billion by 2031, registering a CAGR of 17.46% between 2026 and 2031.
This report is Segmented by Deployment Mode (Cloud-Based, and On-Premises), Organization Size (Large Enterprises, and SMEs), Application (Pay Gap Analytics, Benchmarking and Compensation Analysis, Compliance and Regulatory Reporting, and More), End-User Industry (BFSI, IT and Telecommunications, and More), and Geography. The Market Forecasts are Provided in Terms of Value (USD).
Global Pay Equity Analytics Platform Market Trends and Insights
EU Pay Transparency Directive Creates Immediate Compliance Demand
The June 7, 2026, transposition deadline has become the clearest near-term trigger for the pay equity analytics platform market. The directive requires salary-range transparency for candidates, gives employees access to pay-level information, restricts salary history practices, and bars pay secrecy clauses, which turns compensation data into a regulated operating process rather than a one-time review. Employers with 150 or more employees must publish their first gender pay gap reports by June 7, 2027, and employers with 100 or more employees must follow by 2031. The directive also sets a 5% threshold for unjustified pay gaps, and if the gap is not corrected within 6 months, the employer must carry out a joint pay assessment with worker representatives. That combination is pushing the pay equity analytics platform market toward audit-grade systems capable of classifying workers, tracking remediation windows, and preserving defensible records across multiple jurisdictions. The same rule set is also expanding the buyer base in the pay equity analytics platform market, as mid-sized employers that were previously outside formal reporting cycles are now moving toward compliance.
U.S. State Pay Transparency Laws Drive A Patchwork Compliance Market
State-level rulemaking is creating a second major demand engine for the pay equity analytics platform market. Colorado continues to enforce its Equal Pay for Equal Work Act and reported USD 841,500 in total citation fines, which shows that noncompliance now carries visible financial consequences rather than only reputational risk. Massachusetts now requires salary range disclosure in defined circumstances, and the law applies to employers with 25 or more employees, which lowers the practical entry point for formal pay transparency controls. For employers operating across remote and distributed teams, the issue is less about one statute and more about coordinating several state-specific posting, recordkeeping, and reporting rules at the same time. That is why the pay equity analytics platform market is benefiting from demand for centralized policy logic, reusable job structures, and standardized disclosure workflows. The patchwork model also favors vendors that can update rule libraries quickly and present state-specific outputs through a single reporting layer.
Compensation Data Privacy Exposure Constrains Enterprise Adoption
Data sensitivity remains one of the clearest brakes on the pay equity analytics platform market. These platforms must process compensation, demographic attributes, performance information, and career histories, which means buyers are often evaluating them against the strictest standards used anywhere in the HR stack. Evenpay positions GDPR-compliant EU data residency and security controls as part of its product value, which shows how closely adoption is tied to privacy expectations in regulated markets. PayAnalytics by beqom also emphasizes pay equity and workforce analytics in a framework built for enterprise use, reflecting how certification and governance have become baseline purchase conditions. In the pay equity analytics platform market, this raises the bar for smaller vendors because buyers want clear evidence of data handling discipline before they will connect payroll and employee records. Privacy rules, therefore, slow some deals even while they make specialized platforms more necessary.
Other drivers and restraints analyzed in the detailed report include:
- Continuous Audits And Board-Level Accountability Reshape Procurement Cycles
- Cloud HR Stack Integration Lowers Deployment Friction
- Fragmented HR Data And Weak Job Architectures Slow Time-To-Value
For complete list of drivers and restraints, kindly check the Table Of Contents.
Segment Analysis
Cloud-based deployment accounted for 76.18% share of the pay equity analytics platform market size in 2025, and cloud-based deployment is also forecast to expand at an 18.94% CAGR through 2031. In the pay equity analytics platform market, that lead reflects the practical need to connect payroll, HRIS, ATS, and compensation planning data without relying on repeated file transfers. The cloud model also supports multi-country policy changes more efficiently because vendors can update reporting logic across all clients from one governed environment. This matters more as employers face overlapping rules in Europe and North America and need a system that can absorb frequent legal changes without a fresh IT project each time.
On-premises tools still retain a place in some financial institutions, public bodies, and organizations with strict hosting requirements. Even so, the balance of demand in the pay equity analytics platform market is moving toward hosted environments because faster implementation, centralized controls, and stronger integration paths now outweigh earlier cloud hesitations for many buyers. Payscale's integration expansion in early 2025 underscored how the competitive center of gravity has shifted toward connected deployment rather than isolated analysis. The same pattern is visible in enterprise procurement, where buyers increasingly ask whether a platform can plug into existing HCM workflows on day 1. Within the pay equity analytics platform industry, deployment choice is therefore becoming less about infrastructure preference and more about how quickly a client can move from raw data to defensible decisions.
Large enterprises held 66.42% share in 2025, while SMEs are projected to grow at a 20.87% CAGR through 2031. The pay equity analytics platform market still leans toward large employers because they operate across more legal entities, more geographies, and more compensation structures, which increases both reporting complexity and remediation risk. Syndio reported that its platform governs pay for more than 10 million employees across 100 countries and serves nearly 400 global enterprises, including more than 50% of the Fortune 100. That level of adoption shows why enterprise accounts remain the commercial anchor of the pay equity analytics platform market.
The faster growth, however, is moving into smaller employers that are entering formal disclosure and reporting obligations for the first time. In Europe, the reporting threshold of 100 or more employees broadens the addressable buyer pool materially over the forecast period, and in the United States, several state rules already apply to employers of smaller size. Massachusetts, for example, applies salary range requirements to employers with 25 or more employees in covered situations. Ravio's USD 12 million Series A raise in May 2025 was tied to international expansion and reflects investor interest in tools that can serve growing companies rather than only global enterprises. The pay equity analytics platform market is therefore likely to see simpler packaging, faster setup, and more modular pricing as vendors pursue this emerging mid-market demand pool.
Complete Report Scope:
- By Deployment Mode
- Cloud-based
- On-premises
- By Organization Size
- Large Enterprises
- SMEs
- By Application
- Pay Gap Analytics
- Benchmarking and Compensation Analysis
- Compliance and Regulatory Reporting
- Other Applications
- By End-User Industry
- BFSI
- IT and Telecommunications
- Healthcare and Lifesciences
- Retail and E-commerce
- Industrial Manufacturing
- Government and Public Sector
- Other End-user Industries
- By Geography
- North America
- United States
- Canada
- Mexico
- South America
- Brazil
- Argentina
- Rest of South America
- Europe
- Germany
- United Kingdom
- France
- Italy
- Spain
- Russia
- Rest of Europe
- Asia-Pacific
- China
- Japan
- India
- South Korea
- Australia and New Zealand
- Rest of Asia-Pacific
- Middle East
- Saudi Arabia
- United Arab Emirates
- Turkey
- Rest of Middle East
- Africa
- South Africa
- Egypt
- Nigeria
- Rest of Africa
- North America
Geography Analysis
North America held 44.26% of the pay equity analytics platform market share in 2025, giving it the largest regional position. The region benefits from an unusual mix of legal enforceability, employer awareness, and high software readiness, particularly in the United States and Canada. In the United States, the pay equity analytics platform market is supported by a growing web of state-level salary disclosure and reporting obligations that employers must manage across distributed workforces. Colorado's enforcement record shows the seriousness of this environment, with the state reporting USD 841,500 in total citation fines under the Equal Pay for Equal Work Act.
The pay equity analytics platform market in Europe holds the second-largest regional position, but it is going through the deepest regulatory reset. The European Union's pay transparency rules apply across all 27 member states, giving the region an unusually broad compliance footprint across both private and public employment. The June 2026 transposition deadline, followed by staged reporting obligations for employers with 150 or more employees and then 100 or more employees, creates a multi-year implementation cycle rather than a one-time rush. The 5% unjustified gap threshold also raises the operating stakes because unresolved findings can move employers into a joint pay assessment process.
Asia-Pacific is the fastest-growing regional segment in the pay equity analytics platform market, projected to expand at a 22.41% CAGR through 2031. Growth there is being supported by multinational employers that want consistent reporting frameworks across global operations and by local employers that are starting to formalize pay transparency practices. The current pattern remains more reactive than in North America or Western Europe, which means adoption still tends to accelerate when legal obligations become clearer. That gap leaves room for further expansion as regional employers improve their HR data foundations and seek closer integration between payroll and compensation governance. South America, the Middle East, and Africa remain earlier-stage territories for the pay equity analytics platform market, although local reporting expectations are beginning to create openings for vendors that can localize job structures and compliance workflows. PayAnalytics by beqom has already published guidance for South African employers on annual Employment Equity Act reporting and pending transparency requirements, which points to a developing commercial path in the region.
- Syndio Solutions, Inc.
- Trusaic
- Salary.com, LLC
- Payscale, Inc.
- beqom SA
- Performing Ideas HR AB
- Sysarb AB
- PayGap ApS
- Evenpay Oy
- Claritava GmbH
- Opacity ApS
- Figures SAS
- OpenComp, Inc.
- ThinkWhy LLC
- Compport Private Limited
- HRsoft, Inc.
- Ravio Technologies Ltd.
- Parity Software, LLC
- Decusoft
- Compa Technologies, Inc.
- equidi Pty Ltd
- EDGE Strategy AG
Additional Benefits:
- The market estimate (ME) sheet in Excel format
- 3 months of analyst support
TABLE OF CONTENTS
1 INTRODUCTION
- 1.1 Study Assumptions and Market Definition
- 1.2 Scope of the Study
2 RESEARCH METHODOLOGY
3 EXECUTIVE SUMMARY
4 MARKET LANDSCAPE
- 4.1 Market Overview
- 4.2 Market Drivers
- 4.2.1 EU Pay Transparency Directive Implementation Deadline in 2026
- 4.2.2 Expansion of U.S. State Pay Transparency and Pay Data Reporting Laws
- 4.2.3 Shift Toward Continuous Pay Equity Audits and Board-Level Accountability
- 4.2.4 Cloud HR Stack Integration and Workflow Automation
- 4.2.5 Embedding Fair-Pay Guardrails Into Hiring, Promotion, and Merit Decisions
- 4.2.6 Rising Need for Job Architecture and Work-of-Equal-Value Classification
- 4.3 Market Restraints
- 4.3.1 Sensitive Compensation Data Privacy and Security Exposure
- 4.3.2 Weak Job Architecture and Fragmented HR Data
- 4.3.3 Legal Discoverability Risk From Unremediated Audit Findings
- 4.3.4 Salary Benchmarking Data Licensing and Localization Cost Burden
- 4.4 Industry Value Chain Analysis
- 4.5 Regulatory Landscape
- 4.6 Technological Outlook
- 4.7 Impact of Macroeconomic Factors on the Market
- 4.8 Porter's Five Forces Analysis
- 4.8.1 Threat of New Entrants
- 4.8.2 Bargaining Power of Buyers
- 4.8.3 Bargaining Power of Suppliers
- 4.8.4 Threat of Substitutes
- 4.8.5 Intensity of Competitive Rivalry
5 MARKET SIZE AND GROWTH FORECASTS (VALUE)
- 5.1 By Deployment Mode
- 5.1.1 Cloud-based
- 5.1.2 On-premises
- 5.2 By Organization Size
- 5.2.1 Large Enterprises
- 5.2.2 SMEs
- 5.3 By Application
- 5.3.1 Pay Gap Analytics
- 5.3.2 Benchmarking and Compensation Analysis
- 5.3.3 Compliance and Regulatory Reporting
- 5.3.4 Other Applications
- 5.4 By End-User Industry
- 5.4.1 BFSI
- 5.4.2 IT and Telecommunications
- 5.4.3 Healthcare and Lifesciences
- 5.4.4 Retail and E-commerce
- 5.4.5 Industrial Manufacturing
- 5.4.6 Government and Public Sector
- 5.4.7 Other End-user Industries
- 5.5 By Geography
- 5.5.1 North America
- 5.5.1.1 United States
- 5.5.1.2 Canada
- 5.5.1.3 Mexico
- 5.5.2 South America
- 5.5.2.1 Brazil
- 5.5.2.2 Argentina
- 5.5.2.3 Rest of South America
- 5.5.3 Europe
- 5.5.3.1 Germany
- 5.5.3.2 United Kingdom
- 5.5.3.3 France
- 5.5.3.4 Italy
- 5.5.3.5 Spain
- 5.5.3.6 Russia
- 5.5.3.7 Rest of Europe
- 5.5.4 Asia-Pacific
- 5.5.4.1 China
- 5.5.4.2 Japan
- 5.5.4.3 India
- 5.5.4.4 South Korea
- 5.5.4.5 Australia and New Zealand
- 5.5.4.6 Rest of Asia-Pacific
- 5.5.5 Middle East
- 5.5.5.1 Saudi Arabia
- 5.5.5.2 United Arab Emirates
- 5.5.5.3 Turkey
- 5.5.5.4 Rest of Middle East
- 5.5.6 Africa
- 5.5.6.1 South Africa
- 5.5.6.2 Egypt
- 5.5.6.3 Nigeria
- 5.5.6.4 Rest of Africa
- 5.5.1 North America
6 COMPETITIVE LANDSCAPE
- 6.1 Market Concentration
- 6.2 Strategic Moves
- 6.3 Market Share Analysis
- 6.4 Company Profiles (includes Global Level Overview, Market Level Overview, Core Segments, Financials as available, Strategic Information, Market Rank/Share, Products and Services, Recent Developments)
- 6.4.1 Syndio Solutions, Inc.
- 6.4.2 Trusaic
- 6.4.3 Salary.com, LLC
- 6.4.4 Payscale, Inc.
- 6.4.5 beqom SA
- 6.4.6 Performing Ideas HR AB
- 6.4.7 Sysarb AB
- 6.4.8 PayGap ApS
- 6.4.9 Evenpay Oy
- 6.4.10 Claritava GmbH
- 6.4.11 Opacity ApS
- 6.4.12 Figures SAS
- 6.4.13 OpenComp, Inc.
- 6.4.14 ThinkWhy LLC
- 6.4.15 Compport Private Limited
- 6.4.16 HRsoft, Inc.
- 6.4.17 Ravio Technologies Ltd.
- 6.4.18 Parity Software, LLC
- 6.4.19 Decusoft
- 6.4.20 Compa Technologies, Inc.
- 6.4.21 equidi Pty Ltd
- 6.4.22 EDGE Strategy AG
7 MARKET OPPORTUNITIES AND FUTURE OUTLOOK
- 7.1 White-space and Unmet-Need Assessment


