

|
시장보고서
상품코드
2073589
미국의 에너지 저장 : 시장 점유율 분석, 업계 동향 및 통계, 성장 예측(2026-2031년)United States Energy Storage - Market Share Analysis, Industry Trends & Statistics, Growth Forecasts (2026 - 2031) |
||||||
 Mordor Intelligence
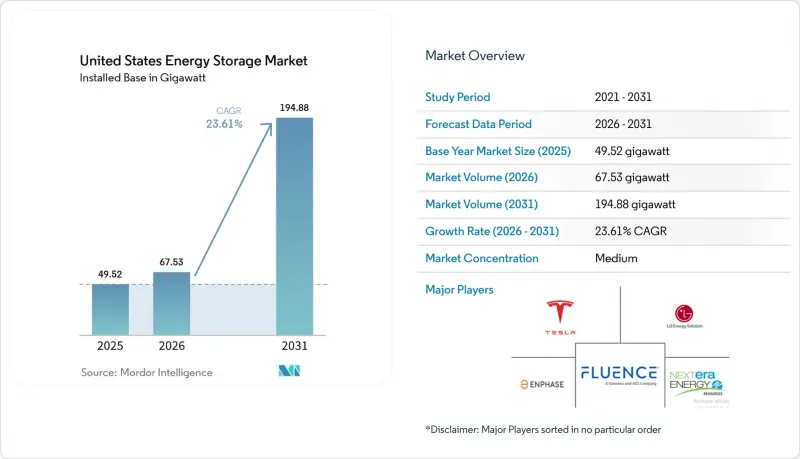
Mordor Intelligence에 의하면, 미국의 에너지 저장 시장 규모(설치 기반)는 2025년 49.52기가와트로 평가되었습니다. 2026년에는 67.53기가와트로 확대되어 2026년부터 2031년에 걸쳐 CAGR 23.61%로 성장을 지속하여, 2031년에는 194.88기가와트에 이를 것으로 예측됩니다.
본 보고서는 기술별(배터리, 양수 발전, 수소 에너지 저장 등), 정격 용량별(1 MWh 이하, 1-10 MWh, 10-100 MWh, 100 MWh 이상), 설치 장소별(계량기 전방 및 계량기 후방), 용도별(재생에너지 통합, 피크 절감 및 수요 요금 관리 등), 그리고 최종 사용자별(주거용, 상업 및 산업용, 유틸리티)로 분류되어 있습니다.
미국의 에너지 저장 시장 동향 및 인사이트
연방 투자 세액 공제 연장이 주거용 전력 저장 수요를 뒷받침
2032년까지 적용되는 30%의 독립형 에너지 저장 세액 공제 덕분에, 각 가정이 기존 옥상 태양광 발전 시스템에 배터리를 추가하는 개조 판매가 급증했습니다. 2025년 주택용 설치 건수는 전년 대비 42% 증가했으며, 그 증가분의 68%를 캘리포니아주, 텍사스주, 애리조나주가 차지했습니다. 13.5 kWh의 실용 용량과 일체형 하이브리드 인버터를 갖춘 테슬라의 ‘Powerwall 3"는 2025년 중반까지 주택용 부문에서 약 35%의 시장 점유율을 확보했습니다. 엔페이즈 에너지는 설치 업체들이 고객의 세액 공제를 극대화하기 위해 신규 태양광 발전 프로젝트에 에너지 저장 시스템을 세트로 판매한 결과, 2025년 1분기에 “IQ Battery"의 출하 대수를 전년 동기 대비 29% 증가시켰습니다. 저녁 시간대에 피크를 맞이하는 시간대별 요금제 덕분에 주택 소유자는 매월 전기 요금을 80-150달러 절감할 수 있으며, 가상 발전소 프로그램을 통해 참가자 1인당 연간 300-700달러의 계통 서비스 수익을 얻을 수 있습니다. 따라서 10년에 걸친 정책의 안정성이 도입을 가속화하고, 수요의 변동을 완화하고 있습니다.
FERC 지침 제841호 및 제2222호 : 에너지 저장 시스템의 도매 시장 진출 가속화
지역 송전 기관은 2024년 이후 약 15GW 규모의 추가적인 시장 접근을 허용해 왔습니다. CAISO에서는 2025년 3분기까지 6.2 GW 규모의 가동 중인 축전지가 등록되었으며, 부하가 높은 날에는 축전 설비가 저녁 시간대 피크 수요의 최대 18%를 충당하고 있습니다. ERCOT는 2025년 초에 집약형 자원 프로토콜을 가동하여, 6개월 이내에 800 MW 이상의 계량기 후단 축전지를 등록했습니다. PJM은 4시간 지속 시간 기준을 충족하는 축전지에 보상을 지급하도록 규정을 개정한 후, 2025년 용량 경매에서 2.1 GW 규모의 축전 설비를 낙찰받았습니다. 개발업체들이 인구 밀집 지역의 입지 이점을 활용한 결과, NYISO 참여량은 2024년부터 2025년에 걸쳐 3배로 증가하여 1.8 GW에 달했습니다. 이러한 개혁을 통해, 축전 설비는 틈새 부가 서비스 자산에서 천연가스 피크 발전량을 직접 대체할 수 있는 신뢰성 높은 조절 가능한 자원으로 그 위상이 변화했습니다.
계통 연계 대기열의 혼잡으로 인해 대규모 프로젝트가 지연되고 있습니다.
2025년 중반까지 PJM, MISO, SPP 지역의 에너지 저장 관련 미처리 건수는 에너지 저장 및 하이브리드 발전 용량 기준으로 120GW를 넘어섰으며, 평균 대기 기간은 42개월을 돌파했습니다. FERC의 클러스터 조사 지침이 도움이 되겠지만, 지역별 이행이 지연되고 있어 개발업체들은 kW당 50달러가 넘는 업그레이드 비용에 직면하고 있으며, 이로 인해 프로젝트의 수익성이 저하되고 있습니다. MISO에서는 2024년에 지연된 프로젝트를 사업자가 포기함에 따라 38%의 철회율이 기록되었습니다. SPP의 18 GW에 달하는 전력 저장 설비 대기 목록 중, 2024년부터 2025년에 걸쳐 상업 운전을 시작한 규모는 고작 1.2 GW에 그쳤습니다. 이러한 제약으로 인해 신규 설비는 ERCOT 및 CAISO로 이동하고 있습니다. 이러한 지역에서는 계통 연계 절차가 2년 이내에 처리되고, 비용 배분도 더욱 명확해졌기 때문입니다.
부문별 분석
2025년 미국 시장의 에너지 저장 시스템에서 배터리가 설치 용량의 81.7%를 차지했습니다. 이는 2024년 유틸리티 규모 프로젝트에서 kWh당 271달러의 비용으로 공급된 리튬 이온 배터리를 활용한 것입니다. 리튬철인산염(LFP) 및 고니켈 NMC 계열 배터리는 45배의 세액 공제를 받는 국내 기가팩토리의 지원을 받아 출하량의 약 95%를 차지하고 있습니다. 납축전지는 3%의 틈새 시장을 유지하고 있는 반면, 바나듐 흐름 전지 및 아연-브롬 전지의 시범 프로젝트는 6-10시간의 방전이 필요한 용도에 대응하고 있습니다. 미국 시장의 에너지 저장 시스템 중 양수 발전의 점유율은 설치 장소의 선택지가 제한적이어서 신규 건설에서는 여전히 극히 미미하지만, 기존 시설은 계속해서 관성 전력을 공급하고 있습니다.
수소 저장 시장은 100시간의 방전 용량을 요구하는 전력 회사의 입찰에 힘입어 2031년까지 연평균 성장률(CAGR) 30.5%로 성장할 전망입니다. 미쓰비시 파워는 유타주의 석탄 화력 발전소를 300MW 규모의 수소 연료 발전소로 전환하고 있으며, 이 발전소에서는 전해 수소를 소금 동굴에 저장할 예정입니다. 하이드로스톨(Hydrostall)사의 캘리포니아주 500 MW 개발 프로젝트와 같은 압축 공기 프로젝트는 수소보다 낮은 자본 비용으로 8시간의 방전 지속 시간을 제공합니다. 플라이휠 시스템과 열 시스템은 각각 주파수 조정 및 산업용 열 공급이라는 틈새 시장에서 계속해서 활용되고 있지만, 두 시스템 모두 시장 점유율이 1%를 훨씬 밑돌고 있습니다.
10-100 MWh급은 2025년 용량의 38.6%를 차지했으며, 이는 전력 회사들이 태양광 발전 프로젝트와 조화를 이루고 복잡한 송전망 업그레이드를 피할 수 있는 모듈식 20-50 MW 블록을 선호하고 있음을 반영합니다. Fluence Gridstack과 Powin Centipede는 건설 기간을 단축하는 공장 조립식 컨테이너를 도입하여 이 분야를 선도하고 있습니다. 미국 시장에서 이 등급의 에너지 저장 시스템 시장 규모는 배전 사업자들이 변전소 업그레이드를 미루기 위해 피더 규모의 설비를 도입함에 따라 꾸준히 확대될 전망입니다.
100 MWh를 초과하는 프로젝트는 연평균 성장률(CAGR) 36.1%를 나타낼 것으로 전망됩니다. 캘리포니아주에 위치한 Vistra사의 모스 랜딩 사이트는 2024년에 750 MW/3,000 MWh에 도달하며, 기가와트시 규모의 배터리의 경제적 타당성을 입증했습니다. AES와 LS Power는 희소성 가격 및 용량 지급 제도를 활용하기 위해 텍사스주와 네바다주에서 300 MWh 이상의 프로젝트를 여러 건 진행 중입니다. 1 MWh 미만의 시스템은 주택 부문용이며, 캘리포니아주에서는 2025년에 신규 옥상 태양광 발전의 연결률이 85%를 넘어섰습니다.
기타 혜택 :
- 엑셀 형식 시장 예측(ME) 시트
- 3개월간의 애널리스트 지원
자주 묻는 질문
목차
제1장 서론
제2장 조사 방법
제3장 주요 요약
제4장 시장 구도
제5장 시장 규모 및 성장 예측
제6장 경쟁 구도
제7장 시장 기회 및 향후 전망
KTH 26.07.08According to Mordor Intelligence, the united states energy storage market size in terms of installed base is expected to grow from 49.52 gigawatt in 2025 to 67.53 gigawatt in 2026 and is forecast to reach 194.88 gigawatt by 2031 at 23.61% CAGR over 2026-2031.
This report is Segmented by Technology (Batteries, Pumped Hydro Storage, Hydrogen Energy Storage, and More), Capacity Rating (Up To 1 MWh, 1 To 10 MWh, 10 To 100 MWh, and Above 100 MWh), Installation (Front-Of-The-Meter and Behind-The-Meter), Application (Renewable Integration, Peak Shaving and Demand Charge Management, and More), and End User (Residential, Commercial and Industrial, and Utility).
United States Energy Storage Market Trends and Insights
Federal Investment Tax Credit Extension Boosting Residential Storage Demand
The 30% standalone storage credit now available until 2032 unlocked a surge of retrofit sales as households add batteries to existing rooftop solar arrays. Residential installations rose 42% year over year in 2025, with California, Texas, and Arizona responsible for 68% of those additions. Tesla's Powerwall 3, featuring 13.5 kWh usable capacity and an integrated hybrid inverter, captured roughly 35% of the residential segment by mid-2025. Enphase Energy shipped 29% more IQ Battery units during Q1 2025 as installers bundled storage with new solar projects to maximize customer tax savings. Time-of-use rates that peak during evening hours let homeowners trim monthly bills by USD 80-150, and virtual power plant programs add USD 300-700 in annual grid-service revenue per participant. The decade-long policy certainty is therefore accelerating adoption and smoothing demand cycles.
FERC Order 841 & 2222 Accelerating Wholesale-Market Participation of Storage
Regional transmission organizations have opened roughly 15 GW of incremental market access since 2024. CAISO registered 6.2 GW of active battery participation by Q3 2025, with storage supplying up to 18% of evening peak demand on high-load days. ERCOT activated its aggregated-resource protocol in early 2025, enrolling more than 800 MW of behind-the-meter batteries within six months. PJM cleared 2.1 GW of storage in its 2025 capacity auction after revising rules that now pay batteries meeting four-hour duration thresholds. NYISO participation tripled between 2024 and 2025 to 1.8 GW as developers capitalized on locational premiums in densely populated zones. These reforms reposition storage from a niche ancillary-service asset into a dependable dispatchable resource that directly displaces gas peakers.
Interconnection Queue Congestion Delaying Large-Scale Projects
Backlogs in PJM, MISO, and SPP exceeded 120 GW of storage and hybrid capacity by mid-2025, with average wait times surpassing 42 months. FERC's cluster-study directive will help, but regional implementation lags, and developers face upgrade fees above USD 50 per kW that erode project economics. MISO recorded a 38% withdrawal rate in 2024 as sponsors abandoned delayed projects. SPP's 18 GW storage queue delivered only 1.2 GW of commercial operations between 2024 and 2025. These constraints push new capacity toward ERCOT and CAISO, which process interconnections within two years and offer clearer cost allocations.
Other drivers and restraints analyzed in the detailed report include:
- Solar-plus-Storage Pipeline Growth Across ERCOT and WECC
- IRA-Linked Domestic Battery-Manufacturing Credits Lowering BESS Cost
- PFAS Li-ion Electrolyte Safety Concerns Triggering Stricter Fire Codes
For complete list of drivers and restraints, kindly check the Table Of Contents.
Segment Analysis
The energy storage systems in the United States market saw batteries secure 81.7% of installed capacity in 2025, leveraging lithium-ion packs that cost USD 271 per kWh for utility-scale projects in 2024. Lithium-iron-phosphate and high-nickel NMC chemistries together account for about 95% of shipments, supported by domestic gigafactories that enjoy 45X credits. Lead-acid retains a 3% niche, while vanadium-flow and zinc-bromine pilots address applications needing 6- to 10-hour discharge. The energy storage systems in the United States market share for pumped hydro remains minimal for new builds because siting options are limited, though existing facilities continue to provide inertia.
Hydrogen storage is poised for a 30.5% CAGR through 2031, spurred by utility solicitations for 100-hour discharge capability. Mitsubishi Power is converting a Utah coal plant into a 300 MW hydrogen-fueled generator that will store electrolytic hydrogen in salt caverns. Compressed-air projects, such as Hydrostor's 500 MW California development, offer 8-hour durations at lower capital cost than hydrogen. Flywheel and thermal systems continue to serve frequency and industrial heat niches, respectively, each well under 1% of capacity.
The 10-100 MWh class held 38.6% of 2025 capacity, reflecting utility preference for modular 20-50 MW blocks that match solar projects and avoid complex transmission upgrades. Fluence Gridstack and Powin Centipede dominate this tier with factory-assembled containers that compress construction schedules. Energy storage systems in the United States market size for this band is set to rise steadily as distribution utilities deploy feeder-scale assets to defer substation upgrades.
Projects above 100 MWh are expanding at a 36.1% CAGR. Vistra's Moss Landing site in California reached 750 MW / 3,000 MWh in 2024, demonstrating the economic case for gigawatt-hour-scale batteries. AES and LS Power have multiple 300 MWh-plus projects underway in Texas and Nevada to exploit scarcity pricing and capacity payments. Sub-1 MWh systems serve the residential sector, where attachment rates in California exceeded 85% for new rooftop solar in 2025.
Complete Report Scope:
- By Technology
- Batteries (Lithium-ion, Lead-acid, Flow Batteries, Sodium-sulfur and Others)
- Pumped Hydro Storage
- Compressed Air Energy Storage
- Flywheel Storage
- Thermal Energy Storage
- Hydrogen Energy Storage
- By Capacity Rating
- Below 1 MWh
- 1 to 10 MWh
- 10 to 100 MWh
- Above 100 MWh
- By Installation
- Front-of-the-Meter
- Behind-the-Meter
- By Application
- Renewable Integration
- Peak Shaving and Demand Charge Management
- Frequency Regulation
- Backup Power/Resilience
- By End User
- Residential
- Commercial and Industrial
- Utility
List of Companies Covered in this Report:
- Tesla Inc.
- Fluence Energy LLC
- LG Energy Solution Ltd.
- Sungrow Power Supply Co. Ltd.
- BYD Co. Ltd.
- Enphase Energy Inc.
- NextEra Energy Resources LLC
- AES Corporation
- Powin Energy Corp.
- Samsung SDI Co. Ltd.
- Panasonic Holdings Corp.
- Eos Energy Enterprises Inc.
- EnerSys
- KORE Power Inc.
- Form Energy Inc.
- CATL
- Honeywell International Inc.
- Hydrostor Inc.
- Voith GmbH & Co. KGaA
- Andritz AG
- Siemens Energy AG
Additional Benefits:
- The market estimate (ME) sheet in Excel format
- 3 months of analyst support
TABLE OF CONTENTS
1 Introduction
- 1.1 Study Assumptions & Market Definition
- 1.2 Scope of the Study
2 Research Methodology
3 Executive Summary
4 Market Landscape
- 4.1 Market Overview
- 4.2 Market Drivers
- 4.2.1 Federal Investment Tax Credit Extension Boosting Residential Storage Demand
- 4.2.2 FERC Order 841/2222 Accelerating Wholesale?Market Participation of Storage
- 4.2.3 California Rule 21 & NEM 3.0 Driving Behind-the-Meter Deployments
- 4.2.4 Solar-plus-Storage Pipeline Growth Across ERCOT and WECC
- 4.2.5 IRA-Linked Domestic Battery-Manufacturing Tax Credits Lowering BESS Cost
- 4.2.6 Aggressive Utility IRPs Retiring Coal and Adding Long-Duration Storage
- 4.3 Market Restraints
- 4.3.1 Interconnection Queue Congestion Delaying Large-Scale Projects
- 4.3.2 PFAS Li-ion Electrolyte Safety Concerns Triggering Stricter Fire Codes
- 4.3.3 Uneven State-Level Incentives Undermining National Roll-out
- 4.3.4 Supply-Chain Critical-Minerals Exposure (Li, Ni, Co) to Geopolitical Risk
- 4.4 Supply-Chain Analysis
- 4.5 Regulatory Outlook
- 4.6 Technological Outlook
- 4.7 Porter's Five Forces
- 4.7.1 Bargaining Power of Suppliers
- 4.7.2 Bargaining Power of Buyers
- 4.7.3 Threat of New Entrants
- 4.7.4 Threat of Substitutes
- 4.7.5 Competitive Rivalry
- 4.8 Installed Capacity Analysis
- 4.9 PESTLE Analysis
5 Market Size & Growth Forecasts
- 5.1 By Technology
- 5.1.1 Batteries (Lithium-ion, Lead-acid, Flow Batteries, Sodium-sulfur and Others)
- 5.1.2 Pumped Hydro Storage
- 5.1.3 Compressed Air Energy Storage
- 5.1.4 Flywheel Storage
- 5.1.5 Thermal Energy Storage
- 5.1.6 Hydrogen Energy Storage
- 5.2 By Capacity Rating
- 5.2.1 Below 1 MWh
- 5.2.2 1 to 10 MWh
- 5.2.3 10 to 100 MWh
- 5.2.4 Above 100 MWh
- 5.3 By Installation
- 5.3.1 Front-of-the-Meter
- 5.3.2 Behind-the-Meter
- 5.4 By Application
- 5.4.1 Renewable Integration
- 5.4.2 Peak Shaving and Demand Charge Management
- 5.4.3 Frequency Regulation
- 5.4.4 Backup Power/Resilience
- 5.5 By End User
- 5.5.1 Residential
- 5.5.2 Commercial and Industrial
- 5.5.3 Utility
6 Competitive Landscape
- 6.1 Market Concentration
- 6.2 Strategic Moves (M&A, Partnerships, PPAs)
- 6.3 Market Share Analysis (Market Rank/Share for key companies)
- 6.4 Company Profiles (includes Global level Overview, Market level overview, Core Segments, Financials as available, Strategic Information, Products & Services, and Recent Developments)
- 6.4.1 Tesla Inc.
- 6.4.2 Fluence Energy LLC
- 6.4.3 LG Energy Solution Ltd.
- 6.4.4 Sungrow Power Supply Co. Ltd.
- 6.4.5 BYD Co. Ltd.
- 6.4.6 Enphase Energy Inc.
- 6.4.7 NextEra Energy Resources LLC
- 6.4.8 AES Corporation
- 6.4.9 Powin Energy Corp.
- 6.4.10 Samsung SDI Co. Ltd.
- 6.4.11 Panasonic Holdings Corp.
- 6.4.12 Eos Energy Enterprises Inc.
- 6.4.13 EnerSys
- 6.4.14 KORE Power Inc.
- 6.4.15 Form Energy Inc.
- 6.4.16 CATL
- 6.4.17 Honeywell International Inc.
- 6.4.18 Hydrostor Inc.
- 6.4.19 Voith GmbH & Co. KGaA
- 6.4.20 Andritz AG
- 6.4.21 Siemens Energy AG
7 Market Opportunities & Future Outlook
- 7.1 White-Space & Unmet-Need Assessment


