
|
시장보고서
상품코드
2097184
북미의 코워킹 스페이스 : 시장 점유율 분석, 업계 동향 및 통계, 성장 예측(2026-2031년)North America Coworking Spaces - Market Share Analysis, Industry Trends & Statistics, Growth Forecasts (2026 - 2031) |
||||||
 Mordor Intelligence
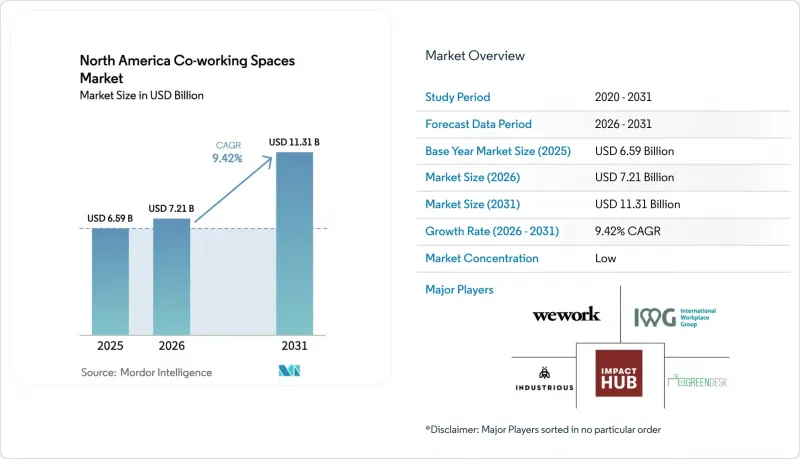
Mordor Intelligence에 의하면, 북미의 코워킹 스페이스 시장 규모는 2025년에 65억 9,000만 달러로 평가되었습니다. 2026년 72억 1,000만 달러에서 2031년까지 113억 1,000만 달러에 이를 것으로 예상되며, 예측 기간(2026-2031년) CAGR은 9.42%를 나타낼 전망입니다.
본 보고서는 시설 규모(소규모, 중규모, 대규모), 업종(정보기술(IT 및 ITES), 은행, 금융서비스 및 보험(BFSI), 기타), 최종 용도(프리랜서, 기업, 스타트업, 기타) 및 지역(미국, 캐나다, 멕시코)별로 분류되어 있습니다. 시장 전망은 금액(달러)으로 표시되어 있습니다.
북미의 코워킹 스페이스 시장 동향 및 인사이트
하이브리드 근무 방식이 정착됨에 따라 대기업과 중소기업이 유연하고 단기 이용이 가능한 공간을 찾는 경향이 강해지고 있습니다.
2025년, 미국의 사무실 출입 데이터는 2019년 수준의 약 60-70%에서 안정화되었으며, 이에 따라 고용주들은 주 2-3일 근무 일정을 고정화하고, 자사 소유의 사무실 공간을 축소하는 한편, 멤버십을 통해 온디맨드 공간을 확보하는 추세입니다. 포춘 500대 기업은 포트폴리오 전략에 코워킹을 접목하는 경향이 강해지고 있으며, 일회성 임대 계약 대신 여러 거점에 걸친 계약을 추진하고 있습니다. 2025년 11월 신규 사업 신청 건수는 53만 5,000건을 넘어, 창업가층의 고객 파이프라인은 견조한 추세를 보이고 있습니다. 정부의 사무실 복귀 지침이 민간 부문의 표준으로도 확산되면서, 워싱턴 D.C. 및 기타 수도권 인근 도시 수요를 끌어올리고 있습니다. 그 결과, 직원 수의 변동이나 프로젝트 주기에 맞추어 유연하게 대응할 수 있는 가변형 부동산으로의 지속적인 전환이 진행되고 있습니다.
'품질 추구(Flight-to-Quality)' : 편의 시설이 잘 갖춰지고 입지가 우수한 허브가 기존 사무실을 능가하는 성과를 발휘
웰니스 시설을 갖추고, 대중교통과 인접하며, 첨단 디지털 인프라를 보유한 다운타운의 클래스 A 타워가 신규 임대 계약의 대부분을 차지하는 반면, 노후화된 클래스 B/C 건물은 공실률 확대에 시달리고 있습니다. 프리미엄 공간을 확보한 운영 사업자는 가격 결정력과 기업으로서의 신뢰도를 높이고 있습니다. 2024년 중반 인더스트리아스(Industrias)사가 타워 49에서 체결한 24만 제곱피트 규모의 계약은 ‘질로의 도피’에 따른 자산 재분배의 전형적인 사례로, 위워크(WeWork)의 구 플래그십 거점을 기업용 허브로 재활용한 것입니다. 2024년 7월 WeWork가 출시한 새로운 ‘워크 라운지’ 서비스는 건물 내 모든 임차인에게 코워킹 시설을 제공하는 것으로, 독립된 형태가 아닌 통합된 형태가 미래의 주류가 될 것임을 시사합니다. 우수한 환경이 이제 경쟁의 기준이 되어, 뒤처진 부동산 소유주들에게 리모델링할지 철거할지라는 결정을 강요하고 있습니다.
경제적 불확실성과 하이테크 업계의 인력 감축이 임차인의 교체와 공실률 변동을 초래하고 있습니다.
2023년부터 2025년 초까지 기술 업계 전반에서 38만 6,000명이 넘는 인원 감축이 이루어진 결과, 주요 혁신 허브의 업무 공간 수요가 위축되었고, 실리콘밸리의 공실률은 20% 가까이 상승했습니다. 스타트업 기업들은 개인 사무실에서 핫데스크로 규모를 축소했고, 임차인 교체가 격화되면서 워크스테이션 1석당 평균 수익이 압박을 받았습니다. 벤처 자금 조달은 후기 단계 라운드에 편중되면서, 과거 코워킹 스페이스의 초기 입주자를 채우던 시드 단계 프로젝트가 고갈되었습니다. 운영사들은 수년에 걸친 기업 대상 계약에 주력하고, 지리적으로 사업을 다각화함으로써 리스크를 완화했습니다. 하지만 단기적인 변동성은 여전히 가동률 예측에 역풍으로 작용하고 있습니다.
부문 분석
2025년, 5만 제곱피트를 초과하는 대규모 시설은 북미의 코워킹 스페이스 시장의 32%를 차지하며, 45.7%를 차지하는 중규모 시설에 이어 2위의 점유율을 기록했습니다. 이러한 시설은 소유주 간의 공동 투자, 바닥부터 천장까지 아우르는 풍부한 편의 시설, 그리고 장기 임대 계약을 체결하지 않고 프라이버시를 원하는 포춘 500대 기업 임차인에게 층 전체를 임대할 수 있는 능력 등의 이점을 누리고 있습니다. 이 부문은 기업의 ‘허브 앤 스포크(hub-and-spoke)’ 모델과 고층 빌딩을 단일 임차인에서 다중 임차인 형태의 유연한 운영으로 재편하는 추세에 힘입어, 2031년까지 연평균 성장률(CAGR) 10.33%라는 가장 높은 성장률을 달성할 전망입니다. 미국에는 전환에 적합하고 이용률이 낮은 도심 고층 빌딩이 다수 존재합니다. 한편, 멕시코시티의 소유주들도 마찬가지로 니어쇼어링 수요에 부응하기 위해 노후화된 건물을 다층 코워킹 스페이스로 개조하고 있습니다. 운영 사업자들은 컨시어지 데스크, 카페 바, 팟캐스트 스튜디오와 같은 규모의 경제를 활용하여 1제곱피트당 수익률을 높이고 있습니다. 중규모 시설은 수요가 안정적이지만 거래 규모가 비교적 작은 교외나 인근 지역의 거점으로서 앞으로도 핵심적인 역할을 계속해 나갈 것입니다.
대규모 허브는 또한 제공업체가 접근 제어, 공간 분석, 이벤트 관리를 위한 기술 플랫폼을 더 광범위한 지역에 전개할 수 있게 하여 사용자 경험과 데이터 수집을 향상시킵니다. CBRE의 Industrious 인수는 이러한 규모 확대 전략의 좋은 사례입니다. 8억 달러 규모의 이번 거래를 통해 대형 플렉스 스위트가 200억 달러 규모의 세계 서비스 엔진에 통합되었습니다. WeWork의 재진입 전략 역시 회복력이 뛰어난 대도시권의 10만 제곱피트 규모 플래그십 거점에 초점을 맞추었습니다. 예측 기간 동안 도심부의 소규모 층이 전환되거나 폐쇄됨에 따라 이 부문의 점유율은 40%에 근접할 것으로 예상되며, 이는 북미의 코워킹 스페이스 시장이 규모 확대를 향해 나아가고 있음을 다시 한번 입증합니다.
기타 혜택 :
- 엑셀 형식 시장 예측(ME) 시트
- 3개월간의 애널리스트 지원
자주 묻는 질문
목차
제1장 서론
제2장 조사 방법
제3장 주요 요약
제4장 시장 구도
제5장 시장 규모 및 성장 예측
제6장 경쟁 구도
제7장 시장 기회 및 향후 전망
KTH 26.08.05According to Mordor Intelligence, the North America coworking spaces market size was valued at USD 6.59 billion in 2025 and is estimated to grow from USD 7.21 billion in 2026 to reach USD 11.31 billion by 2031, at a CAGR of 9.42% during the forecast period (2026-2031).
This report is Segmented by Size and Scale of Facility (Small, Medium, Large), by Sector (Information Technology (IT and ITES), BFSI, and More), by End Use (Freelancers, Enterprises, Startups, and Others), and by Geography (United States, Canada, Mexico). Market Forecasts are Provided in Terms of Value (USD).
North America Coworking Spaces Market Trends and Insights
Hybrid Work Normalization Pushing Enterprises and SMEs to Flexible, Short-Term Space
U.S. office badge data stabilized at roughly 60-70% of 2019 levels during 2025, prompting employers to hard-code two-to-three-day schedules and trim owned footprints while securing on-demand capacity through memberships. Fortune 500 firms increasingly embed co-working within portfolio playbooks, driving multi-location agreements that replace one-off leases. New business applications topped 535,000 in November 2025, keeping the pipeline of entrepreneurial customers strong. Government return-to-office directives ripple into private-sector norms and lift demand in Washington, D.C., and other capital-adjacent cities. The net effect is a durable reorientation toward variable real estate that can flex with head-count swings and project cycles.
Flight-to-Quality: Amenitized, Well-Located Hubs Outperform Legacy Offices
Class A downtown towers with wellness amenities, transit adjacency, and advanced digital infrastructure soak up a majority of new leasing, whereas aging Class B/C stock suffers widening vacancies. Operators able to secure premium space gain pricing power and enterprise credibility. Industrious's 240,000-square-foot deal at Tower 49 in mid-2024 typifies flight-to-quality reallocations, repurposing WeWork's former flagship into an enterprise-grade hub. WeWork's new "work-lounge" product, launched in July 2024, embeds co-working amenities for all tenants in a building, signaling an integrated rather than stand-alone future. Superior environments now set the competitive bar and push lagging landlords toward upgrade or demolition decisions.
Economic Uncertainty and Tech Downsizing Creating Churn and Occupancy Volatility
Layoffs exceeding 386,000 across the tech sector from 2023 to early 2025 shrank seat demand in core innovation hubs and pushed Silicon Valley vacancy to nearly 20%. Start-ups downgraded from private offices to hot desks, elevating churn and compressing average revenue per workstation. Venture funding skewed to late-stage rounds, drying seed-stage pipelines that once filled early co-working cohorts. Operators mitigated risk by leaning into multi-year enterprise deals and diversifying geographically. Nonetheless, near-term volatility remains a headwind for occupancy forecasts.
Other drivers and restraints analyzed in the detailed report include:
- Cost Optimization via Capex-Light Expansion versus Long Leases
- Rise of Distributed Teams and Sunbelt Nodes Boosting Secondary-Market Demand
- Higher Borrowing Costs and TI/Capex Needs Pressuring Operator Unit Economics
For complete list of drivers and restraints, kindly check the Table Of Contents.
Segment Analysis
Large facilities exceeding 50,000 square feet captured 32% of the North America Coworking Spaces Market in 2025, second only to the medium-scale cohort at 45.7%. They benefit from landlord co-investment, floor-to-ceiling amenity sets, and the capacity to dedicate entire floors to Fortune 500 tenants seeking privacy without long leases. The segment is set to deliver the fastest 10.33% CAGR through 2031, fueled by corporate "hub-and-spoke" models and the repositioning of towers from single-tenant to multi-tenant flex operations. The United States provides a deep bench of underutilized downtown high-rises ripe for conversion, while Mexico City landlords similarly retrofit obsolete stock into multi-floor coworking to meet near-shoring demand. Operators leverage economies of scale-concierge desks, cafe bars, podcast studios-to lift yield per square foot. Medium-scale sites will continue to anchor suburban and neighborhood nodes where demand is steadier, but transaction sizes are smaller.
Large hubs also enable providers to roll out technology platforms for access control, space analytics, and event management across a larger area, enhancing the user experience and data capture. CBRE's Industrious integration exemplifies this scale play: the USD 800 million deal folds large-format flex suites into a USD 20 billion global services engine. WeWork's re-entry strategy similarly focuses on 100,000-square-foot flagship sites in resilient metros. Over the forecast horizon, the segment's share is expected to edge toward 40% as smaller downtown floors convert or close, reaffirming the North America Coworking Spaces Market's gravitation to scale.
Complete Report Scope:
- By Size & Scale of Facility
- Small
- Medium
- Large
- By Sector
- Information Technology (IT & ITES)
- BFSI
- Business Consulting & Professional Service
- Other Services (Retail, Lifesciences, Energy, Legal)
- By End Use
- Freelancers
- Enterprises
- Start-ups & Others
- By Country
- United States
- Canada
- Mexico
List of Companies Covered in this Report:
- WeWork Inc.
- IWG plc (Regus, HQ, Spaces)
- Industrious LLC
- Impact Hub GmbH
- Green Desk
- Knotel Inc.
- Serendipity Labs Inc.
- Techspace Holding Co.
- Mix Pace
- District Cowork
- Office Evolution Franchising Inc.
- Venture X Franchising LLC
- Workbox Company LLC
- Workbar LLC
- Premier Workspaces LLC
- COhatch LLC
- Convene Inc.
- CommonGrounds Workplace LLC
- LiquidSpace Inc.
- Expansive Workspace LLC
Additional Benefits:
- The market estimate (ME) sheet in Excel format
- 3 months of analyst support
TABLE OF CONTENTS
1 Introduction
- 1.1 Study Assumptions & Market Definition
- 1.2 Scope of the Study
2 Research Methodology
3 Executive Summary
4 Market Landscape
- 4.1 Market Overview
- 4.2 Market Drivers
- 4.2.1 Hybrid work normalization pushing enterprises and SMEs to flexible, short-term space.
- 4.2.2 Flight-to-quality: amenitized, well-located hubs outperform legacy offices.
- 4.2.3 Cost optimization-capex-light expansion vs. traditional long leases and fit-outs.
- 4.2.4 Rise of distributed teams and suburban/sunbelt nodes boosting secondary-market demand.
- 4.2.5 Landlords partnering with operators to activate underused assets and offer flex suites.
- 4.3 Market Restraints
- 4.3.1 Economic uncertainty and tech downsizing creating churn and occupancy volatility.
- 4.3.2 Higher borrowing costs and TI/capex needs pressuring operator/unit economics.
- 4.3.3 Competitive supply and thin brand differentiation driving price pressure in core metros.
- 4.4 Value / Supply-Chain Analysis
- 4.5 Regulatory Landscape
- 4.6 Technological Outlook
- 4.7 Porter's Five Forces
- 4.7.1 Threat of New Entrants
- 4.7.2 Bargaining Power of Buyers
- 4.7.3 Bargaining Power of Suppliers
- 4.7.4 Threat of Substitutes
- 4.7.5 Intensity of Competitive Rivalry
5 Market Size & Growth Forecasts (Value, USD)
- 5.1 By Size & Scale of Facility
- 5.1.1 Small
- 5.1.2 Medium
- 5.1.3 Large
- 5.2 By Sector
- 5.2.1 Information Technology (IT & ITES)
- 5.2.2 BFSI
- 5.2.3 Business Consulting & Professional Service
- 5.2.4 Other Services (Retail, Lifesciences, Energy, Legal)
- 5.3 By End Use
- 5.3.1 Freelancers
- 5.3.2 Enterprises
- 5.3.3 Start-ups & Others
- 5.4 By Country
- 5.4.1 United States
- 5.4.2 Canada
- 5.4.3 Mexico
6 Competitive Landscape
- 6.1 Market Concentration
- 6.2 Strategic Moves
- 6.3 Market Share Analysis
- 6.4 Company Profiles (includes Global level Overview, Market level overview, Core Segments, Financials as available, Strategic Information, Products & Services, and Recent Developments)
- 6.4.1 WeWork Inc.
- 6.4.2 IWG plc (Regus, HQ, Spaces)
- 6.4.3 Industrious LLC
- 6.4.4 Impact Hub GmbH
- 6.4.5 Green Desk
- 6.4.6 Knotel Inc.
- 6.4.7 Serendipity Labs Inc.
- 6.4.8 Techspace Holding Co.
- 6.4.9 Mix Pace
- 6.4.10 District Cowork
- 6.4.11 Office Evolution Franchising Inc.
- 6.4.12 Venture X Franchising LLC
- 6.4.13 Workbox Company LLC
- 6.4.14 Workbar LLC
- 6.4.15 Premier Workspaces LLC
- 6.4.16 COhatch LLC
- 6.4.17 Convene Inc.
- 6.4.18 CommonGrounds Workplace LLC
- 6.4.19 LiquidSpace Inc.
- 6.4.20 Expansive Workspace LLC
7 Market Opportunities & Future Outlook
- 7.1 White-space & Unmet-need Assessment