|
시장보고서
상품코드
2100673
아시아태평양의 코워킹 오피스 시장 : 점유율 분석, 업계 동향 및 통계, 성장 예측(2026-2031년)Asia Pacific Coworking Office Spaces - Market Share Analysis, Industry Trends & Statistics, Growth Forecasts (2026 - 2031) |
||||||
 Mordor Intelligence
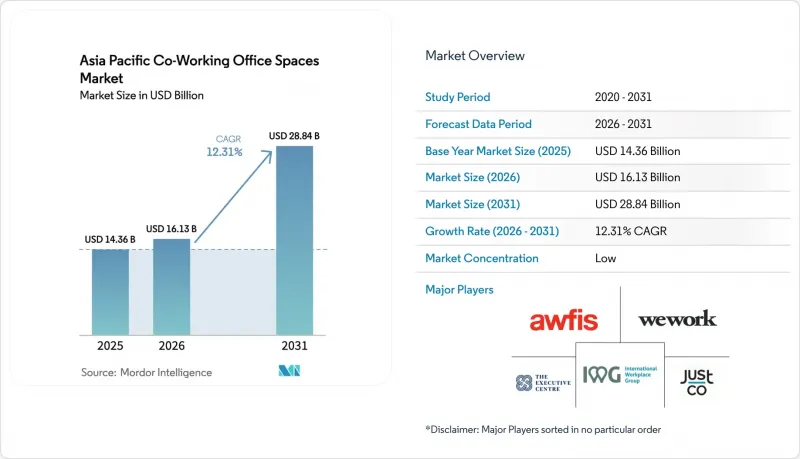
Mordor Intelligence에 의하면, 2026년 아시아태평양 코워킹 오피스 시장 규모는 161억 3,000만 달러로 추정되고 있어 2025년 143억 6,000만 달러에서 확대해, 2031년에는 288억 4,000만 달러에 이를 것으로 예측됩니다.
2026년부터 2031년까지의 연평균 성장률(CAGR)은 12.31%를 나타낼 전망입니다.
본 보고서는 시설 규모(소규모, 중규모, 대규모), 업종(정보 기술, BFSI(은행 및 금융 서비스·보험) 등), 최종 용도(프리랜서, 기업 등), 국가(중국, 인도, 일본, 한국, 호주, 인도네시아 및 기타 아시아태평양)별로 분류되어 있습니다. 시장 전망은 금액(달러) 기준으로 제시되어 있습니다.
아시아태평양 코워킹 오피스 시장 동향 및 인사이트
급속한 도시화와 스타트업 기업의 성장
급속한 도시화와 스타트업 기업의 성장으로 인해 아시아태평양의 유연한 오피스 공간에 대한 수요가 재편되고 있습니다. 기업이들은 중국, 인도, 동남아시아의 급성장하는 대도시권에 점점 더 매료되어, 기동성이 높은 부동산 솔루션을 찾고 있습니다. 인도네시아의 ‘1000 Digital Startups’나 말레이시아의 ‘Digital Hub’ 계획과 같은 국가 주도의 이니셔티브에서는 세제 혜택, 광대역 보조금, 멘토링이 제공되어 창업 초기 기업들을 전문적으로 관리되는 공간으로 유도하고 있습니다. 운영사 입장에서는 예측 불가능한 직원 수 변동 속에서도 유연한 계약 조건에 매력을 느낀 시드 펀딩을 완료한 입주자들이 안정적으로 유입된다는 이점이 있습니다. 이러한 허브가 1급 도시와 신흥 2급 도시에 집중되어 있다는 점은 점유율을 끌어올릴 뿐만 아니라 장기적인 수요 전망을 확고히 하고 있습니다. 벤처 생태계가 성숙해짐에 따라, 아시아태평양의 코워킹 오피스 시장은 견조한 수요에 힘입어 성장하고 있습니다.
하이브리드 근무 모델의 도입
하이브리드 근무 모델은 유연성과 업무 효율성을 결합하여 업무 환경의 패러다임을 변화시키고 있습니다. 기업 정책에서는 사무실 근무와 원격 근무를 모두 통합하는 경향이 강해지고 있으며, 그 결과 전용 책상 비율은 감소하는 반면 협업 공간은 증가하고 있습니다. CBRE의 2024년 조사에 따르면, 이 지역 기업의 60%가 출근 상황이 안정적이라고 보고했으며, 피크 시간대 이용률은 80%를 초과하고 있습니다. 이는 이러한 하이브리드 모델의 운영 측면에서의 성숙도를 여실히 보여주고 있습니다. 유연한 공간은 재무 상황에 부담을 주지 않으면서도 신속한 수용 능력 조정을 가능하게 합니다. 그 결과, 임차인들은 포트폴리오의 더 큰 비중을 제3자 업무 공간에 할당하고 있습니다. 이용 패턴의 변화에 대응하여 제공업체들은 레이아웃을 미세 조정하고, 핫데스크, 미팅 포드, 이벤트 라운지 등을 도입하고 있습니다. 그 결과, 직원 1인당 총 점유 면적은 축소되고 있지만, 하이브리드 업무 공간에 대한 기초적인 수요는 여전히 견조합니다.
성숙한 도시공급 과잉
성숙한 도시의 사무실 공간 공급 과잉은 유연한 공간 시장에 중대한 과제를 안겨주고 있습니다. 베이징, 상하이, 벵갈루루, 뭄바이 등의 도시에서는 기존 사무실의 준공이 급증하여 흡수율을 상회하고 있습니다. 이러한 불균형이 유연한 업무 공간 시장의 수익률에 압박을 가하고 있습니다. 장기 임대 계약에 묶여 있는 공급업체들은 임대인이 명목 임대료 할인을 제시하고, 법인 임차인이 재협상을 요구하는 상황에서 곤경에 처해 있습니다. 그 결과, 신중한 사업 확장으로의 전환이 두드러지게 나타나고 있으며, 자산 부담이 적은 관리 계약이 점점 더 중요시되고 있습니다. 그렇지만 경영난에 빠진 경쟁사와 통합할 수 있는 사업자의 경우, 단기적인 성장이 둔화되더라도 유리한 조건을 확보하고 시장 내 입지를 강화할 수 있으므로 혜택을 볼 가능성이 있습니다.
부문 분석
아시아태평양 코워킹 오피스 시장에서 2025년 매출의 52.60%를 중규모 센터가 차지했으나, 30,000제곱피트 이상의 대규모 시설은 2026년 이후 연평균 성장률(CAGR) 13.02%의 성장세를 보이고 있습니다. 기업들은 프라이빗 존, 첨단 사이버 보안, 사내 네트워크와의 원활한 통합을 실현할 수 있기 때문에 이러한 광활한 시설을 선호하고 있습니다. 제공업체들은 그 규모를 활용하여 더 높은 수익률을 기대할 수 있는 프리미엄 회의실이나 온사이트 데이터룸을 도입하고 있습니다. 성장 단계에 있는 기업이나 프로젝트 팀은 비용과 유연성의 균형을 중시하기 때문에 중규모 센터가 여전히 주류를 이루고 있습니다. 수요 증가로 인해 시설 규모의 구성이 분산되고 있으며, 운영 사업자는 고객의 규모와 입지에 맞는 다중 포맷 포트폴리오를 유지해야 할 필요가 있습니다.
기술의 진화로 인해 규모에 관계없이 공간 계획의 방식이 재정의되고 있습니다. 타케나카 공무점의 'GISTA' 시스템은 생체 인증 데이터와 재실감지 센서를 결합하여 관리자가 공조 설정이나 책상 배정을 실시간으로 미세 조정할 수 있도록 합니다. 이러한 분석 기능은 직원의 웰빙과 에너지 효율을 향상시켜 경쟁 우위를 한층 더 강화합니다. 예측 기간 동안 더 많은 다국적 기업이 단일 임차인 계약에서 관리형 공간 솔루션으로 전환함에 따라, 아시아태평양 코워킹 오피스 시장에서 대규모 시설 시장 규모는 꾸준히 확대될 것으로 전망됩니다.
기타 혜택:
- 엑셀 형식 시장 예측(ME) 시트
- 3개월간의 애널리스트 지원
자주 묻는 질문
목차
제1장 서론
제2장 조사 방법
제3장 주요 요약
제4장 시장 구도
제5장 시장 규모와 성장 예측
제6장 경쟁 구도
제7장 시장 기회와 향후 전망
JHS 26.08.11According to Mordor Intelligence, Asia Pacific co-working office space market size in 2026 is estimated at USD 16.13 billion, growing from 2025 value of USD 14.36 billion with 2031 projections showing USD 28.84 billion, growing at 12.31% CAGR over 2026-2031.
This report is Segmented by Size & Scale of Facility (Small, Medium and Large), by Sector (Information Technology, BFSI (Banking, Financial Services and Insurance), and More), by End Use (Freelancers, Enterprises, and More), and by Country (China, India, Japan, South Korea, Australia, Indonesia, and the Rest of Asia-Pacific). The Market Forecasts are Provided in Terms of Value (USD).
Asia Pacific Coworking Office Spaces Market Trends and Insights
Rapid urbanization and start-up growth
Rapid urbanization and the growth of start-ups are reshaping the demand for flexible office spaces in the Asia Pacific region. Entrepreneurs are increasingly drawn to fast-growing metropolitan areas in China, India, and Southeast Asia, seeking agile real estate solutions. National initiatives, such as Indonesia's "1000 Digital Startups" and Malaysia's Digital Hub scheme, offer tax breaks, broadband subsidies, and mentoring, steering early-stage firms into professionally managed spaces. Operators benefit from a steady stream of seed-funded tenants, attracted by flexible terms amidst unpredictable headcount scaling. The concentration of these hubs in tier-1 and emerging tier-2 cities not only boosts occupancy but also solidifies long-term demand visibility. As venture ecosystems mature, the Asia Pacific co-working office space market is supported by a robust demand engine.
Hybrid work model adoption
The hybrid work model is transforming workplace dynamics, blending flexibility with operational efficiency. Corporate policies are increasingly integrating both office and remote workdays, leading to a reduction in dedicated desk ratios and a rise in collaborative spaces. According to a 2024 survey by CBRE, 60% of firms in the region report stable attendance, with peak utilization surpassing 80%. This highlights the operational maturity of these hybrid models. Flexible spaces allow for swift capacity adjustments without straining balance sheets. As a result, occupiers are designating larger portions of their portfolios to third-party workspaces. In response to evolving usage patterns, providers are fine-tuning their layouts, introducing hot desks, meeting pods, and event lounges. Consequently, while the total occupied area per employee may be shrinking, the baseline demand for hybrid workspaces remains robust.
Oversupply in mature cities
The oversupply of office spaces in mature cities is creating significant challenges for the flexible-space market. In cities like Beijing, Shanghai, Bengaluru, and Mumbai, a surge in conventional office completions is outpacing absorption rates. This imbalance is exerting pressure on yields in the flexible-space market. Providers locked into long leases are feeling the pinch as landlords offer discounts on face rents and corporate tenants push for renegotiations. As a result, there's a noticeable shift towards cautious expansion and a heightened emphasis on asset-light management agreements. Yet, operators who can consolidate with distressed rivals stand to benefit, securing favorable terms and bolstering their market presence, even if it drags on their short-term growth.
Other drivers and restraints analyzed in the detailed report include:
- Operator network expansion
- Government innovation programs
- Regulatory compliance complexity
For complete list of drivers and restraints, kindly check the Table Of Contents.
Segment Analysis
Large facilities of 30,000-plus square feet captured 13.02% CAGR momentum from 2026 onward, even though medium centers held 52.60% of 2025 revenue in the Asia Pacific co-working office space market. Enterprises favor these expansive sites because they deliver private zones, advanced cybersecurity, and seamless integration with corporate networks. Providers leverage size to introduce premium meeting suites and on-site data rooms that command higher yields. Medium centers still dominate because growth-stage firms and project teams value balanced cost and flexibility. Rising demand splits the footprint mix, pushing operators to maintain multi-format portfolios responsive to client scale and location.
Technology is redefining space planning across sizes. Takenaka Corporation's GISTA system pairs biometric feedback with occupancy sensors, enabling managers to fine-tune HVAC settings and desk allocation in real time. Such analytics boost staff well-being and energy efficiency, sharpening competitive differentiation. Over the forecast horizon, the Asia Pacific co-working office space market size within large-format assets is projected to rise steadily as more multinational corporations shift from single-tenant leases to managed-space solutions.
Complete Report Scope:
- By Size & Scale of Facility
- Small
- Medium
- Large
- By Sector
- Information Technology (IT and ITES)
- BFSI (Banking, Financial Services and Insurance)
- Business Consulting & Professional Service
- Other Services (Retail, Lifesciences, Energy, Legal Services)
- By End Use
- Freelancers
- Enterprises
- Start Ups and Others
- By Country
- China
- India
- Japan
- South Korea
- Australia
- Indonesia
- Rest of Asia-Pacific
List of Companies Covered in this Report:
- IWG (Regus, Spaces)
- WeWork
- The Executive Centre (TEC)
- JustCo
- Awfis
- Compass Offices
- Servcorp
- CoWrks
- Smartworks
- GoWork (India)
- Ucommune
- KrSpace
- Distrii
- FastFive
- SparkPlus
- KLOUD
- Bee+
- The Hive
- CommonGrounds
- Industrious APAC JV
Additional Benefits:
- The market estimate (ME) sheet in Excel format
- 3 months of analyst support
TABLE OF CONTENTS
1 Introduction
- 1.1 Study Assumptions & Market Definition
- 1.2 Scope of the Study
2 Research Methodology
3 Executive Summary
4 Market Landscape
- 4.1 Market Overview
- 4.2 Market Drivers
- 4.2.1 Rapid urbanization and start-up growth in China, India, and Southeast Asia fueling demand
- 4.2.2 Widespread adoption of hybrid work models across corporates and MNCs
- 4.2.3 International and regional co-working operators aggressively expanding across APAC cities
- 4.2.4 Government innovation programs and tech parks supporting co-working ecosystems
- 4.2.5 Growing tenant preference for flexible, scalable, and community-driven workspaces
- 4.3 Market Restraints
- 4.3.1 Oversupply risks in mature markets like China and India creating pricing pressures
- 4.3.2 Regulatory and compliance challenges across diverse APAC jurisdictions
- 4.3.3 High fit-out and operational costs impacting profitability for operators in premium locations
- 4.4 Value / Supply-Chain Analysis
- 4.4.1 Overview
- 4.4.2 Real Estate Developers and Asset Owners - Key Quantitative and Qualitative Insights
- 4.4.3 Workspace Design and Technology Consultants - Key Quantitative and Qualitative Insights
- 4.4.4 Modular Furniture and Smart Office Solutions Providers - Key Quantitative and Qualitative Insights
- 4.5 Government Regulations and Initiatives in the Industry
- 4.6 Technological Innovations in the Co-Working Office Space Real Estate Market
- 4.7 Insights into the Key Office Real Estate Industry Metrics (Supply, Rentals, Prices, Occupancy/Vacancy (%))
- 4.8 Impact of Remote Working on Space Demand
- 4.9 Porter's Five Forces
- 4.9.1 Bargaining Power of Suppliers
- 4.9.2 Bargaining Power of Buyers
- 4.9.3 Threat of New Entrants
- 4.9.4 Threat of Substitutes
- 4.9.5 Intensity of Competitive Rivalry
5 Market Size & Growth Forecasts (Value USD)
- 5.1 By Size & Scale of Facility
- 5.1.1 Small
- 5.1.2 Medium
- 5.1.3 Large
- 5.2 By Sector
- 5.2.1 Information Technology (IT and ITES)
- 5.2.2 BFSI (Banking, Financial Services and Insurance)
- 5.2.3 Business Consulting & Professional Service
- 5.2.4 Other Services (Retail, Lifesciences, Energy, Legal Services)
- 5.3 By End Use
- 5.3.1 Freelancers
- 5.3.2 Enterprises
- 5.3.3 Start Ups and Others
- 5.4 By Country
- 5.4.1 China
- 5.4.2 India
- 5.4.3 Japan
- 5.4.4 South Korea
- 5.4.5 Australia
- 5.4.6 Indonesia
- 5.4.7 Rest of Asia-Pacific
6 Competitive Landscape
- 6.1 Market Concentration
- 6.2 Strategic Moves
- 6.3 Company Profiles {(includes Global level Overview, Market level overview, Core Segments, Financials as available, Strategic Information, Products & Services, and Recent Developments)}
- 6.3.1 IWG (Regus, Spaces)
- 6.3.2 WeWork
- 6.3.3 The Executive Centre (TEC)
- 6.3.4 JustCo
- 6.3.5 Awfis
- 6.3.6 Compass Offices
- 6.3.7 Servcorp
- 6.3.8 CoWrks
- 6.3.9 Smartworks
- 6.3.10 GoWork (India)
- 6.3.11 Ucommune
- 6.3.12 KrSpace
- 6.3.13 Distrii
- 6.3.14 FastFive
- 6.3.15 SparkPlus
- 6.3.16 KLOUD
- 6.3.17 Bee+
- 6.3.18 The Hive
- 6.3.19 CommonGrounds
- 6.3.20 Industrious APAC JV