

|
시장보고서
상품코드
2099053
인도의 역물류 시장 : 시장 점유율 분석, 업계 동향 및 통계, 성장 예측(2026-2031년)India Reverse Logistics - Market Share Analysis, Industry Trends & Statistics, Growth Forecasts (2026 - 2031) |
||||||
 Mordor Intelligence
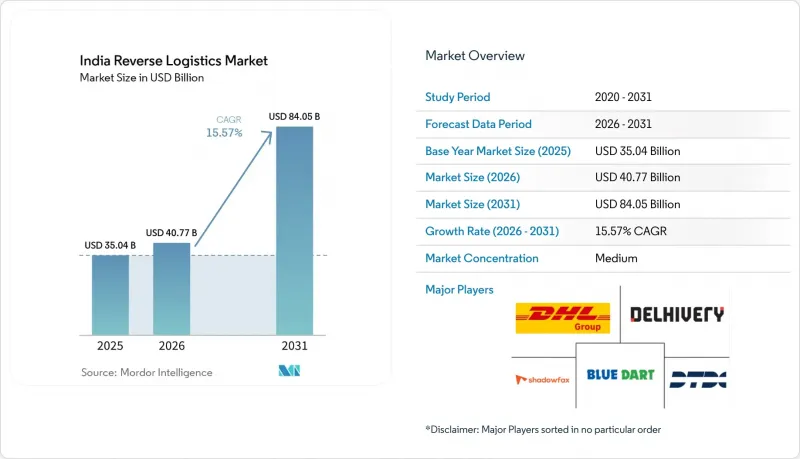
Mordor Intelligence에 의하면, 인도의 역물류 시장 규모는 2025년 350억 4,000만 달러로 평가되었고, 2026년에는 407억 7,000만 달러로 확대될 것으로 추정되고, 2031년까지 840억 5,000만 달러에 이를 것으로 예상되며, 2026-2031년 CAGR 15.57%로 성장할 전망입니다.
현재 역물류는 고객 유지 및 재고 회수와 더욱 밀접하게 연결되어 있기 때문에 인도의 역물류 시장에서는 단순한 비용 관리보다 서비스 품질이 더욱 중요시되고 있습니다. 본 보고서는 역물류 기능별(운송(육상, 항공, 기타 운송 수단), 창고 관리(보관, 유통, 집하), 기타 부가가치 서비스), 최종 사용자 산업별(소비재 및 소매, 주택 및 인테리어, 의료 및 의약품, FMCG, 기타 최종 사용자), 그리고 지역별(북부, 중부, 서부, 동부, 남부)로 분류되어 있습니다. 시장 전망은 금액(달러) 기준으로 제시되어 있습니다.
인도의 역물류 시장 동향 및 인사이트
전자상거래 반품 및 발송처로 반송되는 물량 확대 : 관리만으로는 감당하기 어려운 기준 처리량
인도의 온라인 상거래 기반은 계속 확대되고 있으며, 인도의 역물류 시장에서 막대한 수의 주문이 반품 및 발송처로 반송되는 채널로 계속 유입되고 있습니다. DHL 보고서에 따르면, 인도 인터넷 사용자의 81%가 지난 12개월 동안 온라인 구매 상품을 반품한 것으로 나타나, 반품이 이제 디지털 구매 행동의 일상적인 일부가 되었음을 보여줍니다. 특히 패션 및 신발 분야에서는 체계화된 온라인 소매에서 사이즈 불일치나 기대치와의 차이가 여전히 흔하기 때문에 반품 물량이 특히 많습니다. 블루 다트(Blue Dart)에 따르면, 2026 회계연도에는 2, 3선 도시가 신규 D2C(소비자 직배송) 주문의 약 66%를 차지할 것으로 예상되며, 역물류의 수거 밀도는 대도시권을 넘어 확대되고 있습니다. 또한, 소비자 보호 체계에 따른 반품 기간 규정으로 인해 각 브랜드는 비공식적인 회수 조치 대신 공식적인 반품 시스템을 운영해야 한다는 강한 압력을 받고 있습니다. 따라서 인도의 역물류 시장에서는 더욱 강력한 주소 검증 기능, 고객 의도 확인 기능, 그리고 우편번호 단위의 배송 경로 설정 도구를 갖춘 공급업체가 더 유리한 입지를 차지하게 될 것입니다.
재판매, 재생, 리커머스를 통한 수익화 : 비용 회수에서 수익 창출로
반품된 상품은 침몰 비용이 아닌 회수 가능한 재고로 취급되는 경향이 강해지고 있으며, 이는 인도 역물류 시장 전체의 서비스 모델 구축 방식을 변화시키고 있습니다. Cashify에 따르면, 2025년 트레이드인 건수는 전년 대비 15-16% 증가했으며, 이는 더 많은 소비자가 체계적인 트레이드인 및 업그레이드 프로그램에 참여하고 있음을 보여줍니다. 이러한 변화는 상품의 검사, 등급 평가, 세척을 수행하고 재판매 또는 재생 판매 채널로 신속하게 분류할 수 있는 사업자에게 유리하게 작용합니다. Attero사의 ‘Selsmart’는 2025년 8월까지 19개 이상의 도시에서 운영되며 월 3만 건 이상의 주문을 처리하고 있어, 공식적인 방문 수거 서비스가 상당한 규모에 도달할 수 있음을 보여주었습니다. 중고 단말기 거래의 상당 부분은 여전히 비공식 경로를 통해 이루어지고 있기 때문에 수거 시 검증된 공급원을 확보할 수 있는 기업은 공식 수거 시장에서 우위를 유지하고 있습니다. 『Financial Express』는 신제품 단말기 가격 상승에 따라 2026년에는 재생 스마트폰 취급량이 증가할 것으로 예상하고 있으며, 이는 반환된 전자기기의 회수 가치 향상을 뒷받침하는 것입니다.
주문액에서 차지하는 높은 역물류 비용 : 단순한 해결책이 없는 이익률 문제
인도의 역물류 시장에서는 특히 저가대 카테고리에서 반품 처리 비용이 계속해서 이익률을 압박하는 요인으로 작용하고 있습니다. 블루 다트(Blue Dart)사는 고객 반품뿐만 아니라 원산지로의 반송이 인도 전자상거래 업계에서 가장 큰 이익률 문제라고 밝혔습니다. GS1 India는 2026년 4월, 제품 데이터의 낮은 품질로 인해 해당 업계에 연간 약 5,000카롤 루피(5억 8,800만 달러)의 손실이 발생하고 있다고 추산했습니다. 이 중 1,900카롤 루피(20억 3,000만 달러)는 역물류 처리 및 관리와 직접적으로 관련된 비용입니다. 착불(COD) 방식이 주를 이루는 주문은 여전히 처리하기 가장 어려운 유형입니다. 왜냐하면 배송 실패 시, 수익 회수 없이 배송 비용과 역물류 비용만 발생하기 때문입니다. 이 비용의 최저치는 네트워크 효율화만으로는 불충분함을 보여줍니다. 브랜드 측에는 상품 등록 정보의 질 향상, 선결제 전환율 향상, 그리고 결제 시 심사 강화도 요구되고 있습니다.
부문 분석
2025년 인도 역물류 시장에서 운송 부문은 시장 점유율의 49.05%를 차지하며 가장 큰 기능 블록이 되었습니다. 이러한 집중 현상은 수백만 건에 달하는 배송지 주소 전체에서 필요한 ‘퍼스트 마일’ 수거 규모를 반영하고 있습니다. 반품의 대부분은 프리미엄 항공편이 아닌 단거리 및 중거리로 운송되므로, 도로 운송이 여전히 주요 보조 수단으로 자리 잡고 있습니다. 또한, 이 부문은 착불(COD), 교환, 수령 거부, 파손된 주문 등 다양한 반품 요청이 분산되어 있는 점으로부터 혜택을 받고 있으며, 이로 인해 노선 밀도가 높은 수준을 유지하고 있습니다. 실제로 운송은 수거 성공률, 운송 현황의 가시성, 문제 해결 속도가 고객 경험에 가장 직접적인 영향을 미치는 서비스 계층으로 남아 있습니다.
창고 운영은 가장 빠르게 성장하는 기능이며, 공급망의 이 부분에서 인도의 역물류 시장 규모는 2031년까지 연평균 성장률(CAGR) 21.58%로 확대될 것으로 예측됩니다. 반품 시설은 더 이상 단순한 보관 장소로만 이용되는 것이 아니라, 사업자들은 동일한 시설 내에서 검사, 등급 분류, 재생, 재입고 및 폐기 워크플로우를 통합하고 있습니다. 기타 부가가치 서비스는 반품 처리, 재입고, 재생, 최종 처분을 단일 서비스 패키지로 통합하고 있어 단위당 이익률이 가장 높습니다.
기타 혜택 :
- 엑셀 형식 시장 예측(ME) 시트
- 3개월간의 애널리스트 지원
자주 묻는 질문
목차
제1장 서론
제2장 조사 방법
제3장 주요 요약
제4장 시장 구도
제5장 시장 규모 및 성장 예측(금액, 2026-2031년)
제6장 경쟁 구도
제7장 시장 기회 및 향후 전망
AJY 26.08.07According to Mordor Intelligence, the India reverse logistics market size is expected to increase from USD 35.04 billion in 2025 to USD 40.77 billion in 2026 and reach USD 84.05 billion by 2031, growing at a CAGR of 15.57% over 2026-2031.
Reverse logistics is now more closely tied to customer retention and inventory recovery, so service quality is becoming more important than pure cost control in the India reverse logistics market. This report is Segmented by Reverse Logistics Function (Transportation (Road, Air, Other Modes), Warehousing (Storage, Distribution, Consolidation), Other Value-Added Services), by End-User Industry (Consumer and Retail, Home and Decor, Healthcare and Pharmaceuticals, FMCG, Other End Users), and by Region (North, Central, West, East, South). The Market Forecasts are Provided in Terms of Value (USD).
India Reverse Logistics Market Trends and Insights
Expansion of E-Commerce Returns and Return-to-Origin Volumes: The Volume Baseline That Cannot Be Managed Away
India's online commerce base continues to expand, keeping a large pool of orders flowing into return and return-to-origin channels within the India reverse logistics market. DHL reported that 81% of internet users in India returned an online purchase in the past 12 months, which shows that returns are now a routine part of digital buying behavior. Fashion and footwear continue to generate especially heavy return traffic because size mismatch and expectation gaps remain common in organized online retail. Blue Dart stated that Tier-2 and Tier-3 cities are expected to contribute nearly 66% of new direct-to-consumer orders in FY 26, so reverse pickup density is moving beyond the largest metros. Consumer return windows under the Consumer Protection framework also keep brands under pressure to run formal return systems rather than informal recovery arrangements. This leaves providers with stronger address validation, customer intent checks, and pin-code-level routing tools better positioned in the India reverse logistics market.
Resale, Refurbishment, and Recommerce Monetization: From Cost Recovery to Revenue Generation
Returned goods are increasingly being handled as recoverable inventory rather than as a sunk cost, and that is changing how service models are built across the India reverse logistics market. Cashify stated that trade-ins grew 15-16% year over year in 2025, which shows that more consumers are entering organized exchange and upgrade programs. This shift favors operators that can inspect, grade, clean, and route goods quickly into resale or refurbishment channels. Attero's Selsmart was active across more than 19 cities and handled more than 30,000 monthly orders by August 2025, which showed that formal doorstep take-back can reach meaningful scale. The informal channel still accounts for a large share of used-device trade, so companies that can capture verified supply at pickup maintain an advantage in formal recovery. Financial Express reported stronger volume expectations for refurbished smartphones in 2026 as new device prices rose, which supports better recovery value for returned electronics.
High Reverse Handling Cost as a Share of Order Value: A Margin Problem Without a Simple Fix
Reverse handling costs continue to compress margin recovery in the India reverse logistics market, especially in low-ticket categories. Blue Dart stated that return-to-origin shipments, more than customer returns alone, are India's biggest e-commerce margin problem. GS1 India estimated in April 2026 that poor product data quality was costing the sector nearly INR 5,000 crore (USD 588 million) a year, including INR 1,900 crore (USD 2.03 billion) linked directly to reverse logistics handling and processing. COD-heavy orders remain the hardest to absorb because failed deliveries can incur forward and reverse shipping costs, with no revenue recovery. That cost floor shows that network efficiency alone is not enough; brands also need better listing quality, stronger prepaid conversion, and sharper checkout screening.
Other drivers and restraints analyzed in the detailed report include:
- E-Waste Compliance and Circular Economy Adoption: A Mandated Demand Floor
- Rapid Growth of 3PL-Led Reverse Logistics Networks: Consolidation Accelerates Capability Concentration
- Fragmented Pickup, Sorting, and Quality-Check Infrastructure Outside Tier 1 Hubs: The Bharat Commerce Gap
For complete list of drivers and restraints, kindly check the Table Of Contents.
Segment Analysis
Transportation accounted for 49.05% of the India reverse logistics market share in 2025, making it the largest functional block. This concentration reflects the scale of first-mile pickup required across millions of delivery addresses. Road transport remains the dominant sub-mode because most returns move across short and medium distances rather than by premium air lanes. The segment also benefits from the spread of reverse pickup requests across COD, exchange, refused, and damaged orders, which keeps route density high. In practice, transportation remains the service layer where pickup success, transit visibility, and resolution speed shape the customer experience most directly.
Warehousing is the fastest-growing function, and the India reverse logistics market size for this part of the chain is projected to grow at 21.58% CAGR through 2031. Returns facilities are no longer used only for storage, and operators are building inspection, grading, refurbishment, restocking, and disposal workflows into the same sites. Other value-added services carry the highest per-unit margins because they combine return processing, restocking, refurbishment, and final disposition into a single service bundle.
Complete Report Scope:
- By Reverse Logistics Function
- Transportation
- Road
- Air
- Other Modes
- Warehousing (Storage, Distribution, Consolidation)
- Other Value-added Services (Return Processing, Restocking, Refurbishment, Disposition)
- Transportation
- By End-user Industry
- Consumer and Retail
- Home and Decor
- Healthcare and Pharmaceuticals
- FMCG
- Other End Users
- By Region
- North
- Central
- West
- East
- South
List of Companies Covered in this Report:
- Blue Dart Express Limited
- Delhivery Limited
- DTDC Express Limited
- Shadowfax Technologies Private Limited
- Safexpress Private Limited
- Xpressbees
- Mahindra Logistics Limited
- TVS Supply Chain Solutions Limited
- Allcargo Gati
- DHL Express
- FedEx Corporation
- DSV (incl. DB Schenker)
- Kuehne + Nagel International AG
- Yusen Logistics Co., Ltd.
- Kintetsu World Express, Inc.
- Aramex PJSC
- Attero Recycling Private Limited
- TCI Supply Chain Solutions (TCI-SCS)
- Ekart Logistics
- CEVA Logistics (CMA CGM)
- WareIQ
Additional Benefits:
- The market estimate (ME) sheet in Excel format
- 3 months of analyst support
TABLE OF CONTENTS
1 Introduction
- 1.1 Study Assumptions & Market Definition
- 1.2 Scope of the Study
2 Research Methodology
3 Executive Summary
4 Market Landscape
- 4.1 Market Overview and Role of Reverse Logistics in Logistics
- 4.2 Market Drivers
- 4.2.1 Expansion of E-Commerce Returns and Return-to-Origin Volumes
- 4.2.2 Rising Consumer Trust Requirements for Frictionless Returns
- 4.2.3 Resale, Refurbishment, and Recommerce Monetization
- 4.2.4 Poor Product Data and Expectation Mismatch in Online Commerce
- 4.2.5 E-Waste Compliance and Circular Economy Adoption
- 4.2.6 Rapid Growth of 3PL-Led Reverse Logistics Networks
- 4.3 Market Restraints
- 4.3.1 High Reverse Handling Cost as a Share of Order Value
- 4.3.2 Fragmented Pickup, Sorting, and Quality-Check Infrastructure Outside Tier 1 Hubs
- 4.3.3 Value Erosion From Delayed Validation and Restocking
- 4.3.4 Complex Dispute Resolution for Open-Box, Damaged, and Refused Returns
- 4.4 Regulatory Framework
- 4.5 Value Chain and Distribution Channel Architecture Analysis
- 4.6 Technology Innovations Outlook
- 4.7 Porter's Five Forces
- 4.7.1 Threat of New Entrants
- 4.7.2 Bargaining Power of Suppliers
- 4.7.3 Bargaining Power of Buyers
- 4.7.4 Threat of Substitutes
- 4.7.5 Rivalry Among Competitors
- 4.8 Evolution of Reverse Logistics Requirements
- 4.9 Spotlight - India E-commerce Industry
- 4.10 Study on Changing Consumer Behavior and Preferences
- 4.11 Impact of Cost of Returns on Retailers - Analyst View
- 4.12 Impact of Geo-Political Events on Supply Chain Shifts
5 Market Size & Growth Forecasts (Value, 2026-2031)
- 5.1 By Reverse Logistics Function
- 5.1.1 Transportation
- 5.1.1.1 Road
- 5.1.1.2 Air
- 5.1.1.3 Other Modes
- 5.1.2 Warehousing (Storage, Distribution, Consolidation)
- 5.1.3 Other Value-added Services (Return Processing, Restocking, Refurbishment, Disposition)
- 5.1.1 Transportation
- 5.2 By End-user Industry
- 5.2.1 Consumer and Retail
- 5.2.2 Home and Decor
- 5.2.3 Healthcare and Pharmaceuticals
- 5.2.4 FMCG
- 5.2.5 Other End Users
- 5.3 By Region
- 5.3.1 North
- 5.3.2 Central
- 5.3.3 West
- 5.3.4 East
- 5.3.5 South
6 Competitive Landscape
- 6.1 Market Concentration
- 6.2 Key Strategic Moves
- 6.3 Market Share Analysis
- 6.4 Company Profiles (includes Global level Overview, Market level overview, Core Segments, Financials as available, Strategic Information, Market Rank/Share for key companies, Products & Services, and Recent Developments)
- 6.4.1 Blue Dart Express Limited
- 6.4.2 Delhivery Limited
- 6.4.3 DTDC Express Limited
- 6.4.4 Shadowfax Technologies Private Limited
- 6.4.5 Safexpress Private Limited
- 6.4.6 Xpressbees
- 6.4.7 Mahindra Logistics Limited
- 6.4.8 TVS Supply Chain Solutions Limited
- 6.4.9 Allcargo Gati
- 6.4.10 DHL Express
- 6.4.11 FedEx Corporation
- 6.4.12 DSV (incl. DB Schenker)
- 6.4.13 Kuehne + Nagel International AG
- 6.4.14 Yusen Logistics Co., Ltd.
- 6.4.15 Kintetsu World Express, Inc.
- 6.4.16 Aramex PJSC
- 6.4.17 Attero Recycling Private Limited
- 6.4.18 TCI Supply Chain Solutions (TCI-SCS)
- 6.4.19 Ekart Logistics
- 6.4.20 CEVA Logistics (CMA CGM)
- 6.4.21 WareIQ
7 Market Opportunities & Future Outlook
- 7.1 White-space & Unmet-Need Assessment


