

|
시장보고서
상품코드
2099056
중국의 역물류 시장 : 시장 점유율 분석, 업계 동향 및 통계, 성장 예측(2026-2031년)China Reverse Logistics - Market Share Analysis, Industry Trends & Statistics, Growth Forecasts (2026 - 2031) |
||||||
 Mordor Intelligence
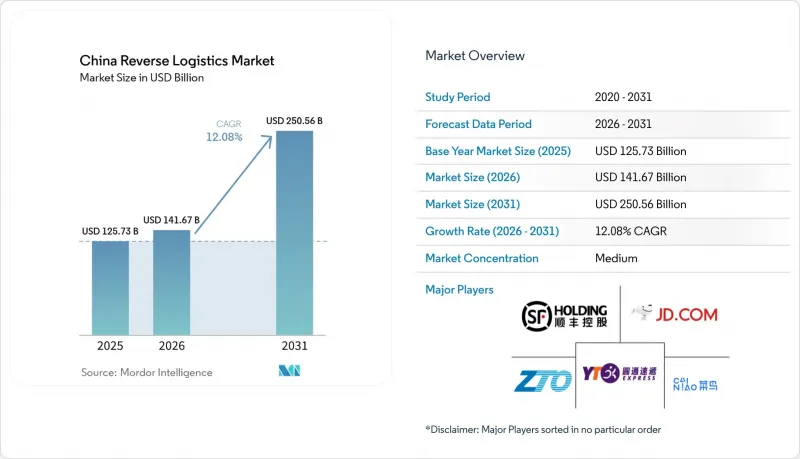
Mordor Intelligence에 의하면, 중국의 역물류 시장 규모는 2025년 1,257억 3,000만 달러로 평가되었고, 2026년에는 1,416억 7,000만 달러로 확대될 것으로 추정되고, 2031년까지 2,505억 6,000만 달러에 이를 것으로 예측되며, 2026-2031년 CAGR 12.08%로 성장할 전망입니다.
중국의 역물류 시장은 중국의 대규모 전자상거래 생태계, 증가하는 소비자 반품, 그리고 제품 회수 및 재판매에 대한 관심 고조에 힘입어 견조한 추세를 보이고 있습니다. 본 보고서는 역물류 기능별(운송(육상, 항공, 기타 운송 수단), 창고 보관, 기타 부가가치 서비스), 최종 사용자 산업별(소비자 및 소매, 주택 및 인테리어, 의료 및 의약품, FMCG, 기타 최종 사용자), 지역별(북부, 북동부, 동부, 중부, 남부, 남서부, 북서부)로 분류되어 있습니다. 시장 전망은 금액(달러) 기준으로 제시되어 있습니다.
중국의 역물류 시장 동향 및 인사이트
증가하는 전자상거래 반품량과 환불에 대한 기대
중국의 매우 거대한 온라인 소매 시장은 해당국의 역물류 시장에 계속해서 막대한 반품 물량을 발생시키고 있습니다. 2024년 온라인 소매 매출액은 2조 1,600억 달러에 달했으며, 이로 인해 국내 주요 소비 회랑 전역에서 소포 수거 밀도가 높은 수준으로 유지되었습니다. 환불 처리 속도 향상과 반품 절차 간소화가 약속되는 가운데, 판매업체들은 반품을 단순한 부수적 과정이 아닌 핵심 서비스 요건으로 인식하기 시작했습니다. 이러한 변화에 따라 점점 더 많은 판매업체들이 수거, 분류, 처리 업무를 중국 역물류 시장의 전문 업체에 위탁하고 있습니다.
순환형 경제와 생산자 책임에 대한 압력
순환형 경제와 자원 회수 프로그램은 중국 역물류 시장에서 더욱 지속 가능한 수요층을 창출하고 있습니다. 중국 내 배터리 추적 체계의 추진과 재활용의 광범위한 제도화로 인해 제품 회수는 더욱 체계화된 채널로 전환되고 있습니다. JD 로지스틱스는 2025년 6월, 50만 개의 재사용 가능한 콜드체인 배송 상자를 도입하며, 대규모 포장재 재사용이 이미 물류 업무에 정착되었음을 보여주었습니다. 이러한 프로그램을 통해 단일 판매 행사 기간뿐만 아니라 제품의 전체 수명 주기에 걸쳐 지속되는 회수, 분류, 재사용 및 자원 회수 업무가 창출되고 있습니다. 이를 통해 수요 기반이 더욱 안정화되어, 중국 역물류 시장의 장기적인 처리 능력 확충을 뒷받침하는 데 기여하고 있습니다.
선별, 검사, 재생에 드는 높은 비용
비용 회수는 여전히 중국 역물류 시장의 주요 제약 요인으로 남아 있습니다. 많은 반품된 전자 기기의 경우, 검사, 선별, 재생에 재판매 가격의 30%에서 40%가 소요될 수 있어, 높은 처리량을 자랑하는 자동화 시스템을 갖추지 못한 사업자에게는 이익 여지가 거의 남지 않습니다. 『Caixin』지는 2026년 6월, 사용 후 전기차 배터리 중 공식 재활용 경로를 통해 회수된 비율은 30% 미만이라고 보도했습니다. 이는 비용 유출과 비공식적 경쟁을 극복하기 위해 법규를 준수하는 처리가 여전히 어려움을 겪고 있음을 여실히 보여줍니다. 리튬 가격 변동도 추가적인 압박 요인으로 작용하고 있습니다. 회수된 자재의 가치가 하락하면 정식 처리의 수익성이 훼손되기 때문입니다. 그 결과, 중국의 역물류 시장에서는 대규모 사업자가 비교적 견조한 추세를 보이는 반면, 중소규모 기업은 계속해서 이익률 압박에 직면하고 있습니다.
부문 분석
2025년, 운송 부문은 중국 역물류 시장 점유율의 45.50%를 차지했으며, 활동의 상당 부분이 여전히 수거, 간선 운송 및 혼재 운송 업무에 집중되어 있음을 보여줍니다. 반품은 인구 밀도가 높은 도시권과 분산된 교외 수요 거점 사이에서 발생하기 때문에 이러한 물류 흐름의 대부분은 도로망을 통해 처리되고 있습니다. 항공 운송은 비용보다 속도와 관리가 중시되는 시간적 제약이 엄격한 전자제품 및 의약품 반품 분야에서 여전히 중요한 역할을 수행하고 있습니다. 기타 운송 수단은 규모가 작은 경우나 국경을 넘는 반품, 장거리 반품 운송에서 저비용 대안이 요구될 때 철도나 복합 일괄 운송의 선택지가 중요성을 더하고 있습니다.
창고업은 연평균 성장률(CAGR) 18.09%로 확대될 것으로 예측되며, 이는 해당 부문에서 가장 빠른 성장 속도로서, 중국 역물류 시장에서 가치 회수의 중요성이 높아지고 있음을 명확히 보여줍니다. 현재 반품된 상품은 단순한 배송 거점이 아닌 전문 처리 센터에서 보관, 선별, 집약된 후 재배송되는 사례가 늘고 있습니다. 또한, 판매업체들이 단일 운영 체인 내에서 재고 보충, 재생, 처분에 관한 지원을 필요로 함에 따라 기타 부가가치 서비스도 강화되고 있습니다. 이에 따라 중국의 역물류 업계는 운송과 체계적인 처리를 결합한 통합 플랫폼으로 전환되고 있습니다.
기타 혜택 :
- 엑셀 형식 시장 예측(ME) 시트
- 3개월간의 애널리스트 지원
자주 묻는 질문
목차
제1장 서론
제2장 조사 방법
제3장 주요 요약
제4장 시장 구도
제5장 시장 규모 및 성장 예측(금액, 2026-2031년)
제6장 경쟁 구도
제7장 시장 기회 및 향후 전망
AJY 26.08.07According to Mordor Intelligence, the China reverse logistics market size is projected to expand from USD 125.73 billion in 2025 to USD 141.67 billion in 2026 and reach USD 250.56 billion by 2031, growing at a CAGR of 12.08% from 2026 to 2031.
China's reverse logistics market is performing steadily, supported by the country's large e-commerce ecosystem, growing consumer returns, and increasing focus on product recovery and resale. This report is Segmented by Reverse Logistics Function (Transportation (Road, Air, Other Modes), Warehousing, and Other Value-Added Services), by End-User Industry (Consumer and Retail, Home and Decor, Healthcare and Pharmaceuticals, FMCG, and Other End Users), and by Region (North, Northeast, East, Central, South, Southwest, and Northwest). The Market Forecasts are Provided in Terms of Value (USD).
China Reverse Logistics Market Trends and Insights
Rising E-Commerce Return Volumes and Refund Expectations
China's very large online retail base continues to send high volumes of returns into the Country's reverse logistics market. Online retail sales reached USD 2.16 trillion in 2024, which kept parcel density high across the country's main consumption corridors. Faster refunds and easier returns promises are making merchants treat returns as a core service requirement rather than a side process. That shift is pushing more sellers to outsource pickup, sorting, and disposition work to specialist providers across the China reverse logistics market.
Circular Economy and Producer Responsibility Pressures
Circularity and recovery programs are creating a more durable demand layer in the China reverse logistics market. China's battery-tracking push and broader formalization of recycling are moving product recovery into more structured channels. JD Logistics deployed 500,000 reusable cold-chain delivery boxes in June 2025, demonstrating that large-scale packaging reuse is already embedded in logistics operations. These programs create recurring collection, sorting, reuse, and recovery work that lasts throughout product life cycles rather than just during a single sales event. That makes this demand base steadier and helps support long-term capacity build-out in the China reverse logistics market.
High Cost of Sorting, Testing, and Refurbishment
Cost recovery remains a core limit in the China reverse logistics market. For many returned electronics, testing, triage, and refurbishment can consume 30% to 40% of the resale value, leaving little room for operators without high-throughput automation. Caixin reported in June 2026 that less than 30% of retired EV power batteries were collected through formal recycling channels, underscoring the ongoing struggle of compliant processing to overcome cost leakage and informal competition. Lithium price swings add another layer of pressure because lower recovered material values weaken the economics of formal processing. The result is that scale players hold up better, while smaller firms in the China reverse logistics market continue to face margin pressure.
Other drivers and restraints analyzed in the detailed report include:
- EV Battery, Electronics, and High-Value Asset Take-Back Flows
- Urban Consolidation Needs Across Tiered Distribution Hubs
- Fragmented Regional Service Standards and Operating Complexity
For complete list of drivers and restraints, kindly check the Table Of Contents.
Segment Analysis
Transportation held 45.50% of the China reverse logistics market share in 2025, indicating that much of the activity still sits in pickup, line-haul, and consolidation work. Road networks carry most of these flows because returns arise across dense city clusters and dispersed suburban demand points. Air remains important for time-sensitive electronics and pharmaceutical returns where speed and custody matter more than cost. Other modes remain smaller, but rail and intermodal options are gaining relevance where cross-border or long-distance return movements need lower-cost alternatives.
Warehousing is forecast to expand at 18.09% CAGR, the fastest pace in this segmentation, and a clear sign that value recovery is becoming more important in the China reverse logistics market. More returns are now being stored, graded, consolidated, and redirected to specialized processing centers rather than simple delivery stations. Other value-added services are also strengthening, as merchants need restocking, refurbishment, and disposition support within a single operating chain. This is shifting the China reverse logistics industry toward integrated platforms that combine transport with disciplined processing.
Complete Report Scope:
- By Reverse Logistics Function
- Transportation
- Road
- Air
- Other Modes
- Warehousing (Storage, Distribution, Consolidation)
- Other Value-added Services (Return Processing, Restocking, Refurbishment, Disposition)
- Transportation
- By End-user Industry
- Consumer and Retail
- Home and Decor
- Healthcare and Pharmaceuticals
- FMCG
- Other End Users
- By Region
- North
- Northeast
- East
- Central
- South
- Southwest
- Northwest
List of Companies Covered in this Report:
- JD Logistics, Inc.
- SF Holdings Co., Ltd.
- Cainiao Network
- YTO Express Group Co., Ltd.
- ZTO Express (Cayman) Inc.
- STO Express Co., Ltd.
- Yunda Holding Co., Ltd.
- J&T Global Express Limited
- Sinotrans Limited
- GEM Co.,Ltd.
- China Post Group Co., Ltd.
- DHL Supply Chain
- DSV (incl. DB Schenker)
- Kuehne + Nagel International AG
- CEVA Logistics
- FedEx Corporation
- United Parcel Service, Inc.
- Geodis
- Nippon Express Holdings, Inc.
- Yusen Logistics Co., Ltd.
- ANE Logistics
Additional Benefits:
- The market estimate (ME) sheet in Excel format
- 3 months of analyst support
TABLE OF CONTENTS
1 Introduction
- 1.1 Study Assumptions & Market Definition
- 1.2 Scope of the Study
2 Research Methodology
3 Executive Summary
4 Market Landscape
- 4.1 Market Overview and Role of Reverse Logistics in Logistics
- 4.2 Market Drivers
- 4.2.1 Rising E-Commerce Return Volumes and Refund Expectations
- 4.2.2 Circular Economy and Producer Responsibility Pressures
- 4.2.3 EV Battery, Electronics, and High-Value Asset Take-Back Flows
- 4.2.4 Urban Consolidation Needs Across Tiered Distribution Hubs
- 4.2.5 Digitized Return Authorization and Visibility Expectations
- 4.2.6 Cross-Border Return Complexity from International E-Commerce
- 4.3 Market Restraints
- 4.3.1 High Cost of Sorting, Testing, and Refurbishment
- 4.3.2 Fragmented Regional Service Standards and Operating Complexity
- 4.3.3 Margin Erosion on Low-Value, High-Volume Returns
- 4.3.4 Data Sharing, Custody, and Chain-of-Responsibility Risks in Multi-Party Returns
- 4.4 Regulatory Framework
- 4.5 Value Chain and Distribution Channel Architecture Analysis
- 4.6 Technology Innovations Outlook
- 4.7 Porter's Five Forces
- 4.7.1 Threat of New Entrants
- 4.7.2 Bargaining Power of Suppliers
- 4.7.3 Bargaining Power of Buyers
- 4.7.4 Threat of Substitutes
- 4.7.5 Rivalry Among Competitors
- 4.8 Evolution of Reverse Logistics Requirements
- 4.9 Spotlight - United States E-commerce Industry
- 4.10 Study on Changing Consumer Behavior and Preferences
- 4.11 Impact of Cost of Returns on Retailers - Analyst View
- 4.12 Impact of Geo-Political Events on Supply Chain Shifts
5 Market Size & Growth Forecasts (Value, 2026-2031)
- 5.1 By Reverse Logistics Function
- 5.1.1 Transportation
- 5.1.1.1 Road
- 5.1.1.2 Air
- 5.1.1.3 Other Modes
- 5.1.2 Warehousing (Storage, Distribution, Consolidation)
- 5.1.3 Other Value-added Services (Return Processing, Restocking, Refurbishment, Disposition)
- 5.1.1 Transportation
- 5.2 By End-user Industry
- 5.2.1 Consumer and Retail
- 5.2.2 Home and Decor
- 5.2.3 Healthcare and Pharmaceuticals
- 5.2.4 FMCG
- 5.2.5 Other End Users
- 5.3 By Region
- 5.3.1 North
- 5.3.2 Northeast
- 5.3.3 East
- 5.3.4 Central
- 5.3.5 South
- 5.3.6 Southwest
- 5.3.7 Northwest
6 Competitive Landscape
- 6.1 Market Concentration
- 6.2 Key Strategic Moves
- 6.3 Market Share Analysis
- 6.4 Company Profiles (includes Global level Overview, Market level overview, Core Segments, Financials as available, Strategic Information, Market Rank/Share for key companies, Products & Services, and Recent Developments)
- 6.4.1 JD Logistics, Inc.
- 6.4.2 SF Holdings Co., Ltd.
- 6.4.3 Cainiao Network
- 6.4.4 YTO Express Group Co., Ltd.
- 6.4.5 ZTO Express (Cayman) Inc.
- 6.4.6 STO Express Co., Ltd.
- 6.4.7 Yunda Holding Co., Ltd.
- 6.4.8 J&T Global Express Limited
- 6.4.9 Sinotrans Limited
- 6.4.10 GEM Co.,Ltd.
- 6.4.11 China Post Group Co., Ltd.
- 6.4.12 DHL Supply Chain
- 6.4.13 DSV (incl. DB Schenker)
- 6.4.14 Kuehne + Nagel International AG
- 6.4.15 CEVA Logistics
- 6.4.16 FedEx Corporation
- 6.4.17 United Parcel Service, Inc.
- 6.4.18 Geodis
- 6.4.19 Nippon Express Holdings, Inc.
- 6.4.20 Yusen Logistics Co., Ltd.
- 6.4.21 ANE Logistics
7 Market Opportunities & Future Outlook
- 7.1 White-space & Unmet-Need Assessment


